
Elliott Wave chart analysis for the S&P 500 for 2nd August, 2011. Please click on the charts below to enlarge.
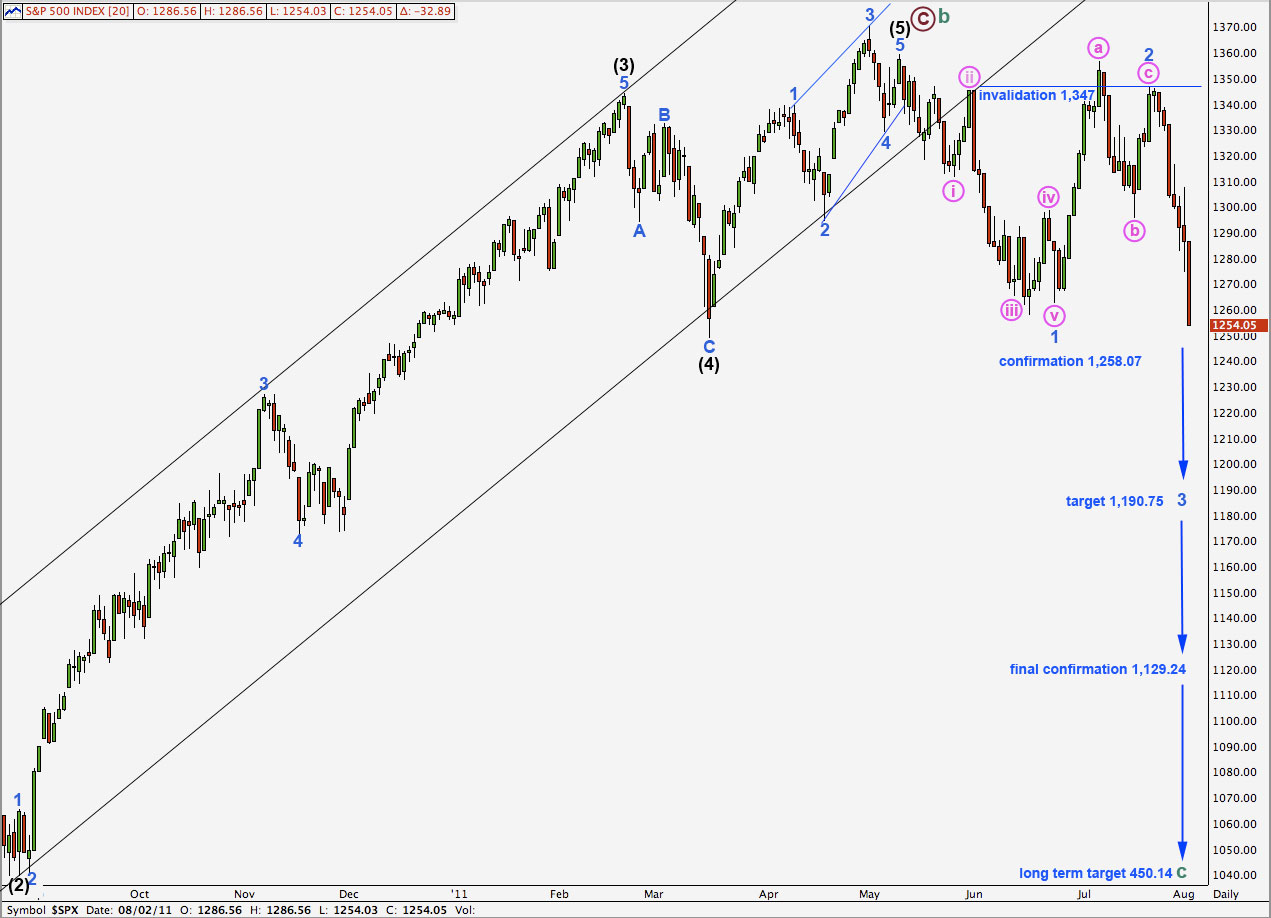
Movement below 1,258.07 has provided some clarification for our wave count. The alternate is invalidated and this will now be our only wave count.
Price has just broken below the sideways trend it has been in since February.
If this wave count is correct then we should expect a continuation of downwards movement for at least a year to an eventual long term target at 450.14 where cycle wave c would reach equality with cycle wave a.
Our mid term target is at least two weeks away still. Wave 3 blue would reach 1.618 the length of wave 1 blue at 1,190.75.
On the daily chart we may move the invalidation point down a little. Now that wave 3 blue is confirmed with movement beyond the end of wave 1 blue we may expect to not see movement above 1,347.
When price eventually moves below 1,129.24 that will be full and final confirmation that the S&P is in a bear market to make new lows and which should last at least a year if not longer (from the start in February 2011).
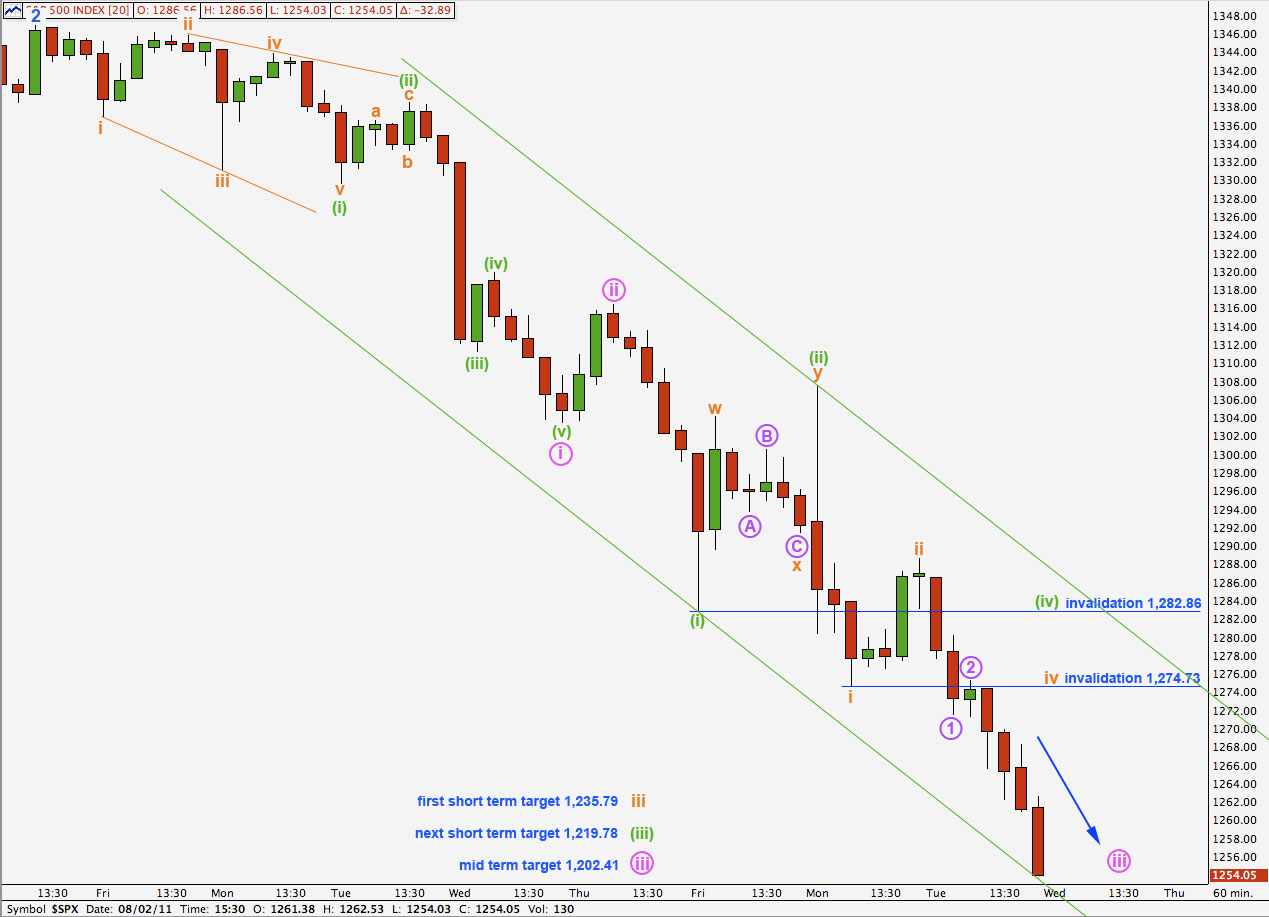
The downwards movement that we saw for Tuesday is exactly what this wave count expected. Momentum has increased downwards.
Looking at yesterday’s movement on a 5 minute chart it looks like the session may have ended within the middle of a third wave. It looks like we may open with a continuation of downwards movement tomorrow. Targets have been revised downwards.
The first short term target may be reached next session. Wave iii orange would reach 1.618 the length of wave i orange at 1,235.79.
About that point we should see a small fourth wave correction for iv orange which may not move into wave i orange price territory. At that stage this wave count is invalidated with movement above 1,274.73.
The next short term target is for wave (iii) green. At 1,219.78 it would reach 2.618 the length of wave (i) green. This target may be reached towards the end of next session or the day after.
About that point we should expect another small fourth wave correction. Wave (iv) green may not move into wave (i) green price territory. At that stage the wave count is invalidated with movement above 1,282.86.
Thereafter, a final fifth wave down towards 1,202.41 would end wave iii pink where it would reach 2.618 the length of wave i pink. This target may be one to two weeks away.
The trend channel drawn here is a best fit. As price continues to move lower we should redraw the channel. I have drawn it about wave iii pink first from the low of (i) green to the latest low, then a parallel copy on the high of (ii) green.
When wave (iii) green is complete then wave (iv) green may end about the upper end of this parallel channel.