
Elliott Wave chart analysis for the S&P 500 for 1st August, 2011. Please click on the charts below to enlarge.
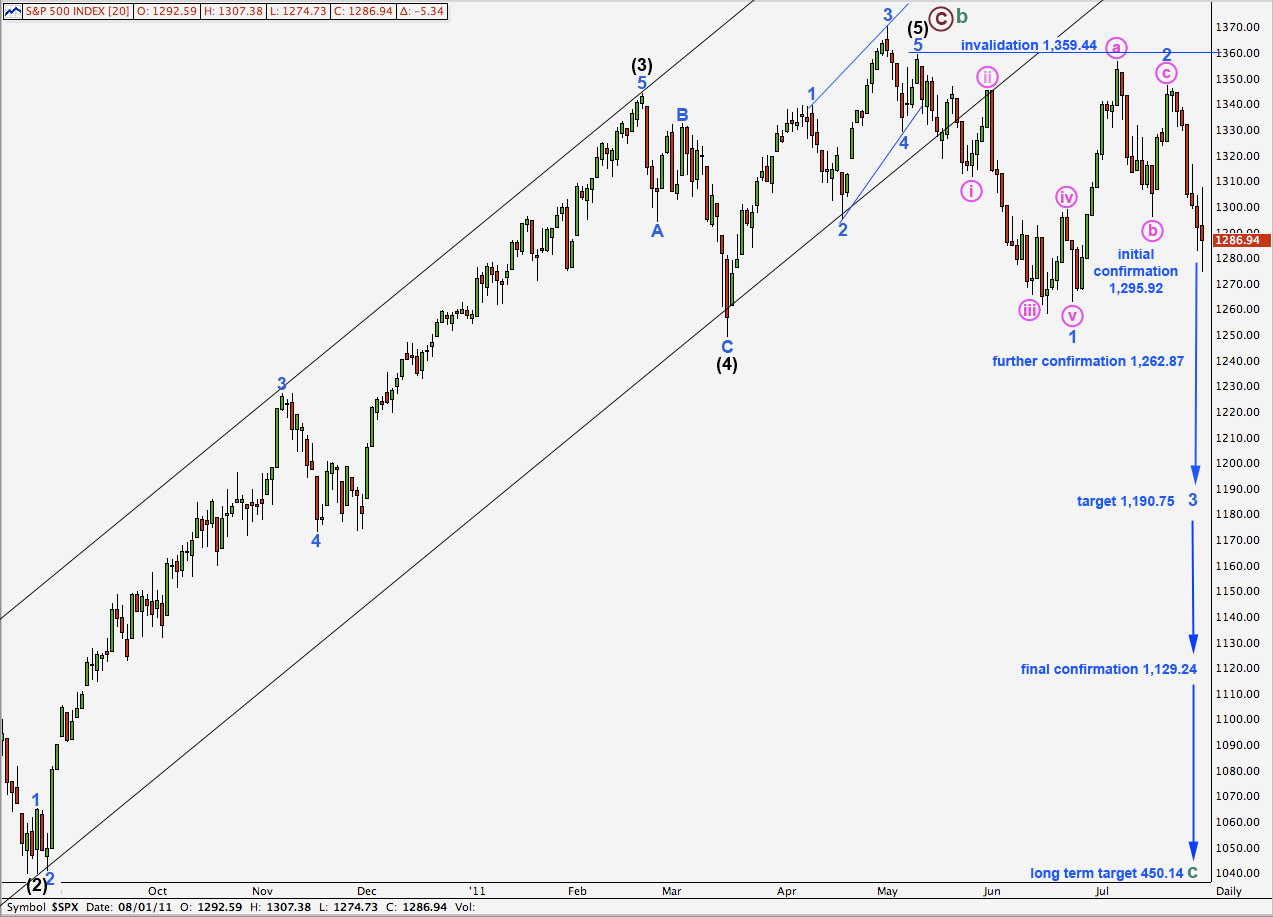
As expected from this wave count we have seen further downwards movement but not yet below 1,262.87, which is required to confirm this wave count.
We may see this wave count confirmed this week or early next week.
At this stage we would expect an increase in downwards momentum as the third wave moves towards the middle. At 1,190.75 wave 3 blue would reach 1.618 the length of wave 1 blue and this remains our mid to long term target. This target is still at least a couple of weeks away.
The long term target for cycle wave c sees it reach equality with cycle wave a within a super cycle zigzag correction, at 450.14. This target is likely more than a year away yet.
Any further extension of wave 2 blue upwards may not move beyond the start of wave 1 blue. This wave count is invalidated with movement above 1,359.44.
When wave 3 blue is confirmed with a core rule being met, as it moves beyond the end of wave 1 blue below 1,262.87, then we may move the invalidation point down to the start of wave 3 blue at 1.347.
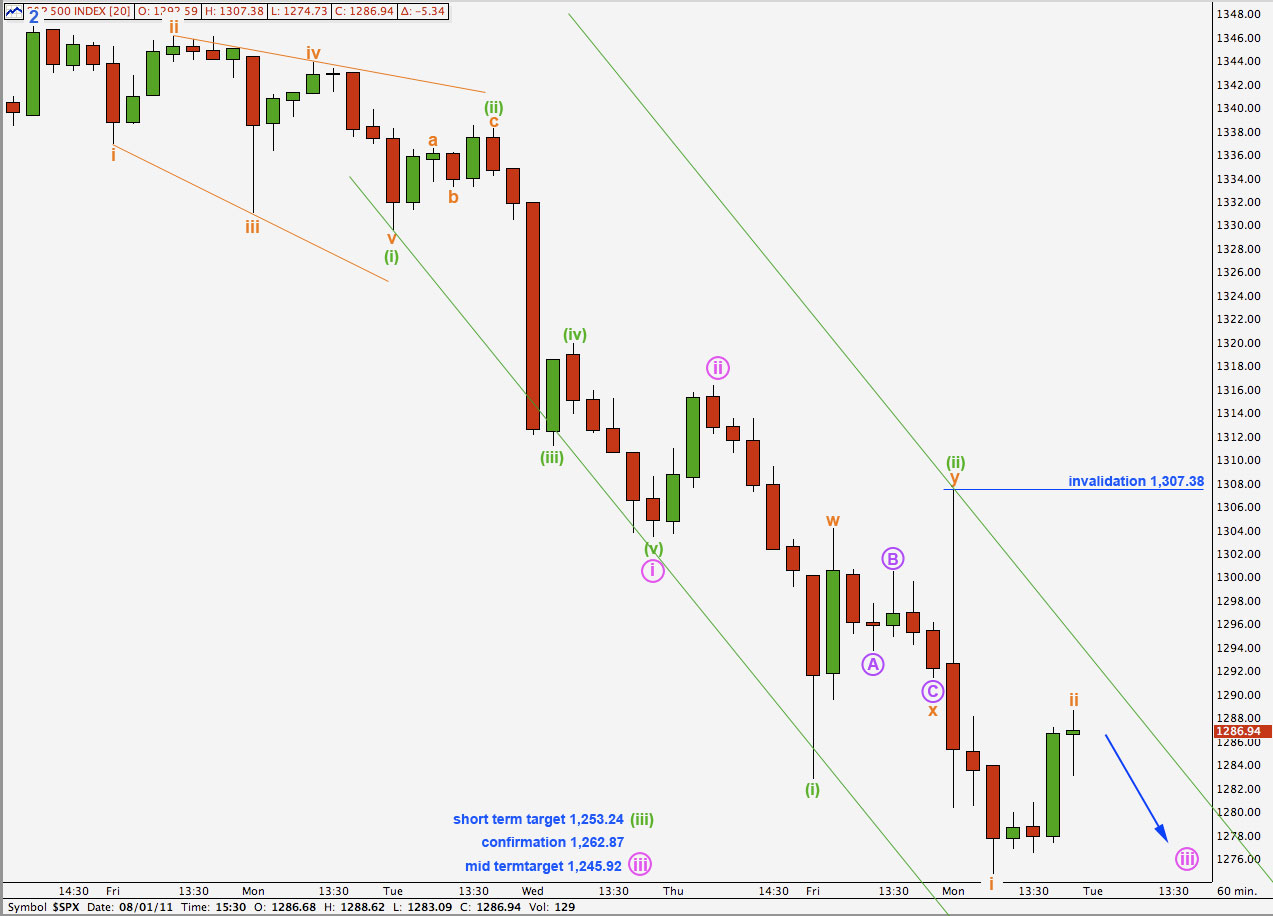
The alternate hourly wave count was confirmed and the main hourly wave count invalidated with movement above 1,304.16. Thereafter, we saw some strong downwards movement.
Wave (ii) green is not an expanded flat though as wave b orange did not reach 90% the length of wave a. Wave (ii) green is a double zigzag structure.
Within the middle of this third wave the first wave i orange is complete. Any further upwards movement of wave ii orange may not move beyond the start of wave i orange. This wave count is invalidated with movement above 1,307.38.
A short term target for wave (iii) green is at 1,253.24 where it would reach 1.618 the length of wave (i) green. This target may be a couple of days away.
A mid term target for wave iii pink is at 1,245.92 where it would reach 1.618 the length of wave i pink. This target may be one to two weeks away.
I have drawn a best fit channel about downwards movement. It may continue to be contained within this channel. When wave (iii) green is complete the channel should be redrawn using Elliott’s technique, if that fits.
Although downwards movement now has a complete impulsive count of 13 I do not think it is over. The fifth wave to end it would not fit as either an impulse (4 overlaps 1) or as an ending diagonal (1, 3 and 5 are not zigzags). So even if my labeling is off for this downwards movement we should still expect to see it continue for a while yet.
Alternate Daily Wave Count.
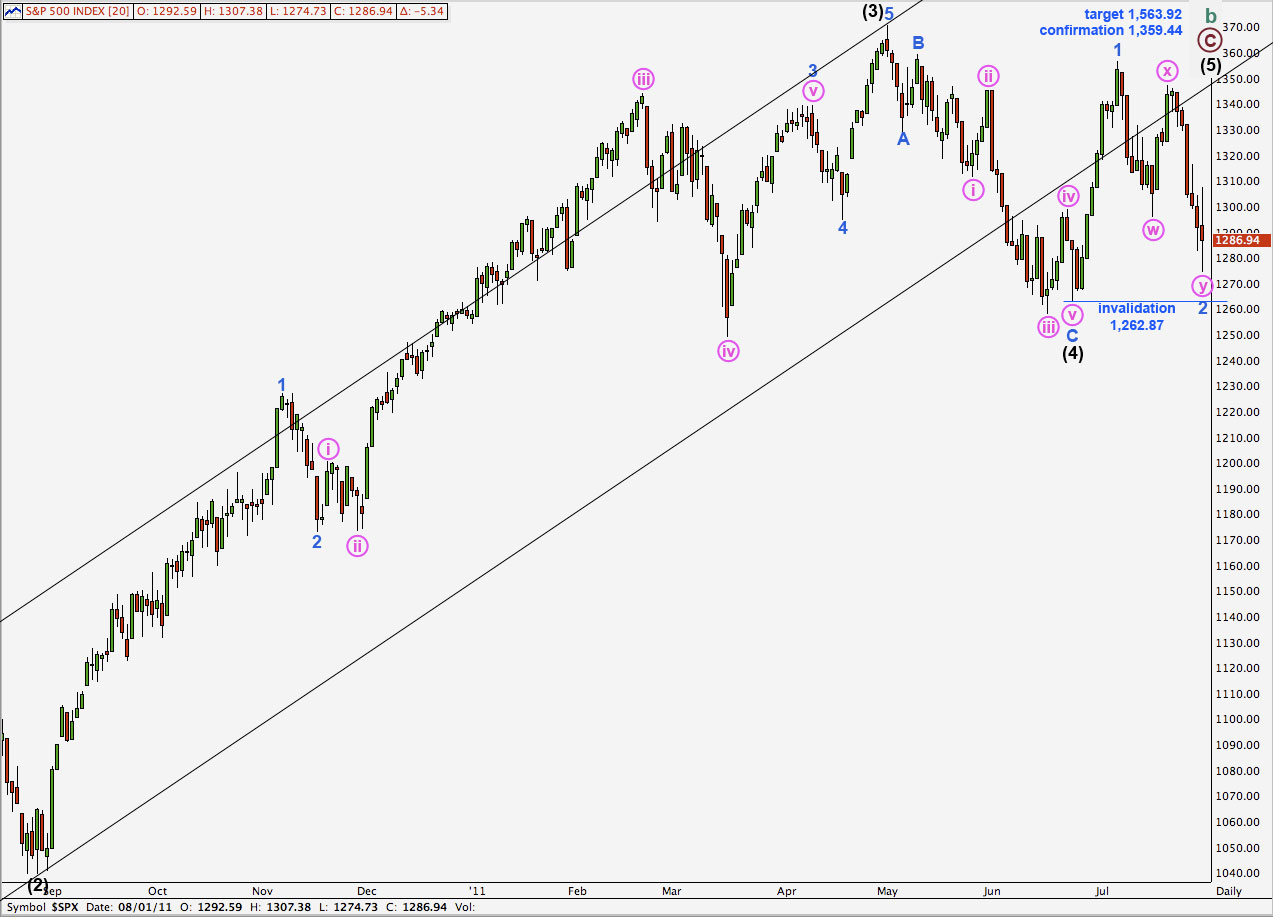
Movement below 1,295.92 has reduced the probability of this wave count.
Wave 2 blue may be a complete, or almost complete, double zigzag structure. So far wave y pink downwards has a count of 13 on the hourly chart. For this wave count to remain valid further downwards movement is now required to make a corrective count of 15.
Wave 2 blue may not move beyond the start of wave 1 blue. This wave count is invalidated with movement below 1,262.87.
The major problem with this wave count on the daily chart is the size and duration of wave iv pink within 3 blue of (3) black upwards. It is larger than other corrections of one and two degrees higher.