
Elliott Wave chart analysis for the S&P 500 for 29th July, 2011. Please click on the charts below to enlarge.
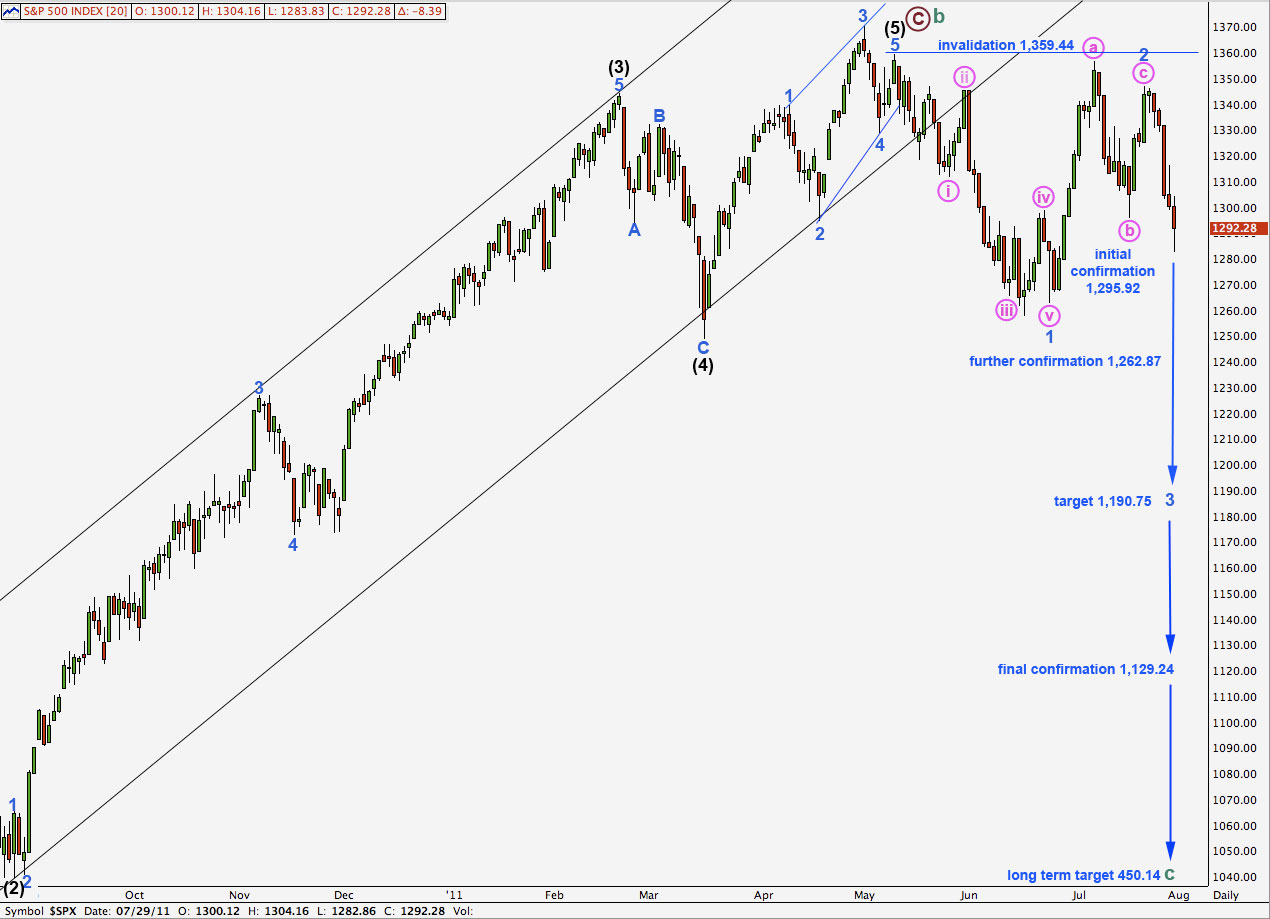
Movement below 1,295.92 has increased the probability of this bearish wave count. The bullish wave count now must be our alternate. Further downwards movement below 1,262.87 in the next week or so is likely to further confirm our bearish wave count. At that stage we will have only one wave count.
A large head and shoulders pattern may be completed. Next week may see increasing downwards momentum and volume as a third wave unfolds.
On the daily chart this wave count has the better look of the two. The only real problem with it at this stage is the internal structure of the ending contracting diagonal for wave (5): all subwaves must be zigzags within an ending diagonal and here subwaves 1 and 3 don’t entirely look like obvious zigzags. However, wave 1 can be seen as a corrective wave count and wave 3 can be seen as a zigzag on the daily chart.
We must see cycle wave A (the “credit crunch”) as a five wave structure when it is more easily seen as a three.
If this wave count is correct then the S&P is in a bear market to last at least a year from May 2011 and most likely much longer than a year. We should see new lows and at 450.14 cycle wave C would reach equality with cycle wave A within a supercycle zigzag.
There is no downwards limit to this market.
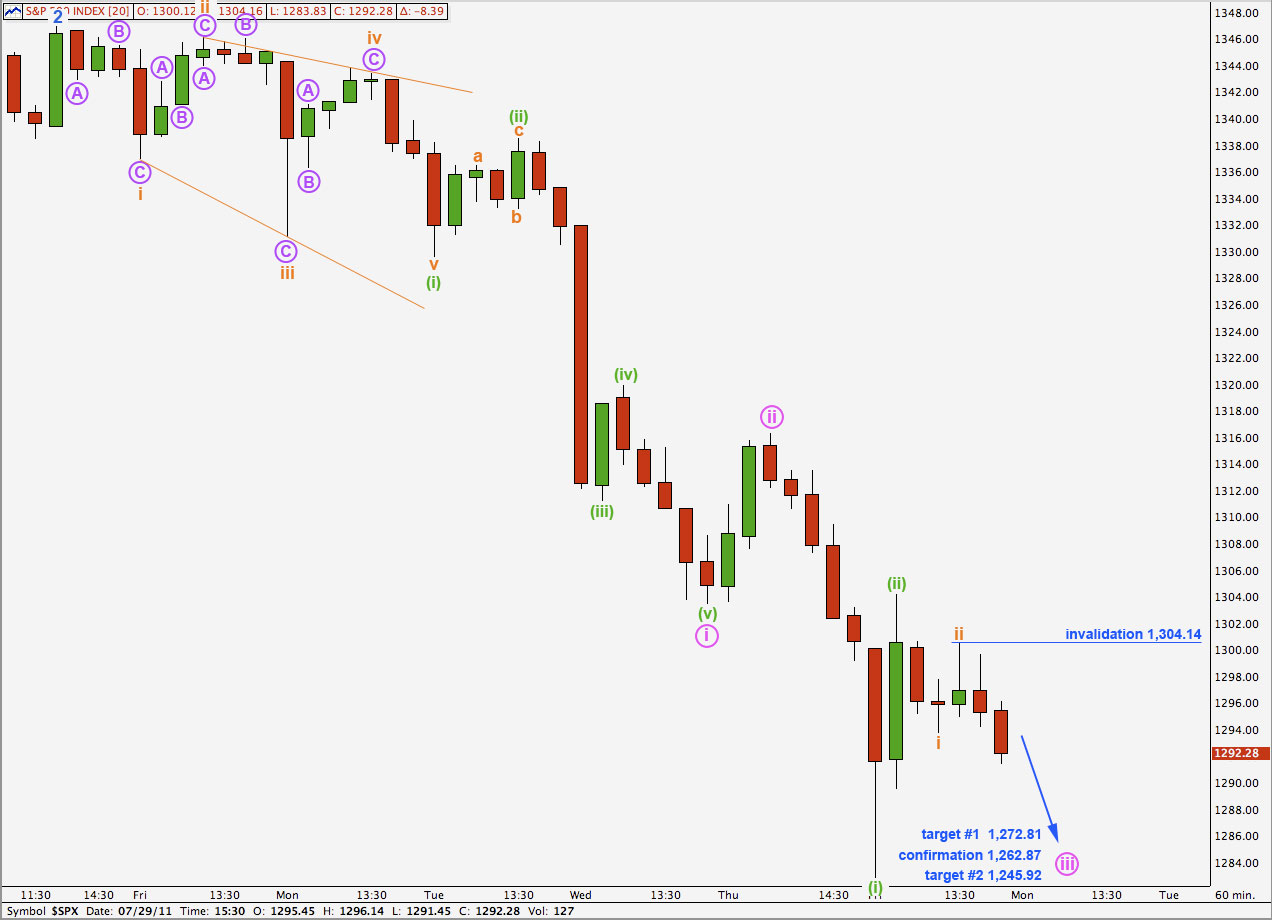
We were expecting the market to open with a little upwards movement but this did not happen. Thereafter, we were expecting strong third wave movement down. We have seen some downwards movement but it has not been as strong as we were expecting for Friday. The strongest downwards movement may yet be ahead of us.
There are at least two ways to look at Friday’s movement. The most optimistic outlook is presented above. This expects Monday to see very strong downwards movement as the middle of a third wave unfolds.
Wave (ii) green upwards is clear three on the 15 and 5 minute charts and wave i orange downwards is a clear five.
The short term targets for wave iii pink may be reached about the end of next week. At 1,272.81 wave iii pink would reach equality with wave i pink, and at 1,245.92 wave iii pink would reach 1.618 the length of wave i pink.
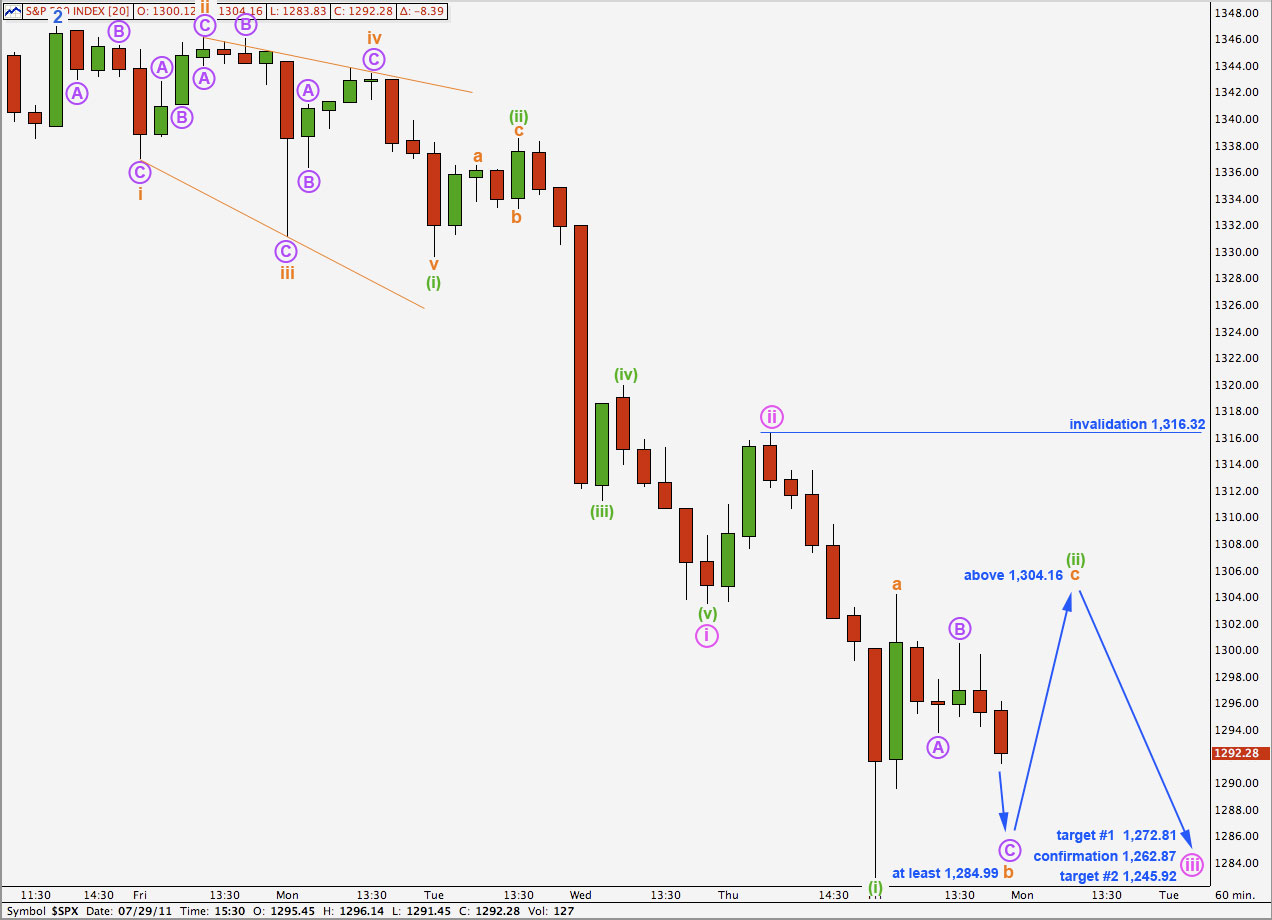
Alternatively, wave (ii) green may not be over if it is continuing as a flat correction. Wave b orange would have to reach 90% of wave a orange minimum to meet the rules for a flat and may make a new low. This price point is at 1,284.99. There is no downwards invalidation point for wave b orange.
Wave c orange upwards should move beyond the end of wave a orange above 1,304.16. It would be unlikely to be truncated and wave (ii) green is unlikely to be a rare running flat correction. However, it is a slim possibility.
Wave (ii) green may not move beyond the start of wave (i) green. This wave count is invalidated with movement above 1,316.32.
The short term targets for wave iii pink are the same.
The probability of this wave count is lower than the first hourly wave count, because the proportion of wave (ii) green would not have as good a look as the first hourly wave count. Also, and this is only a small consideration, the first hourly wave count sees wave (ii) green as a zigzag and this second count sees it as a flat correction. A zigzag is a more common structure for a second wave correction.
Alternate Daily Wave Count.
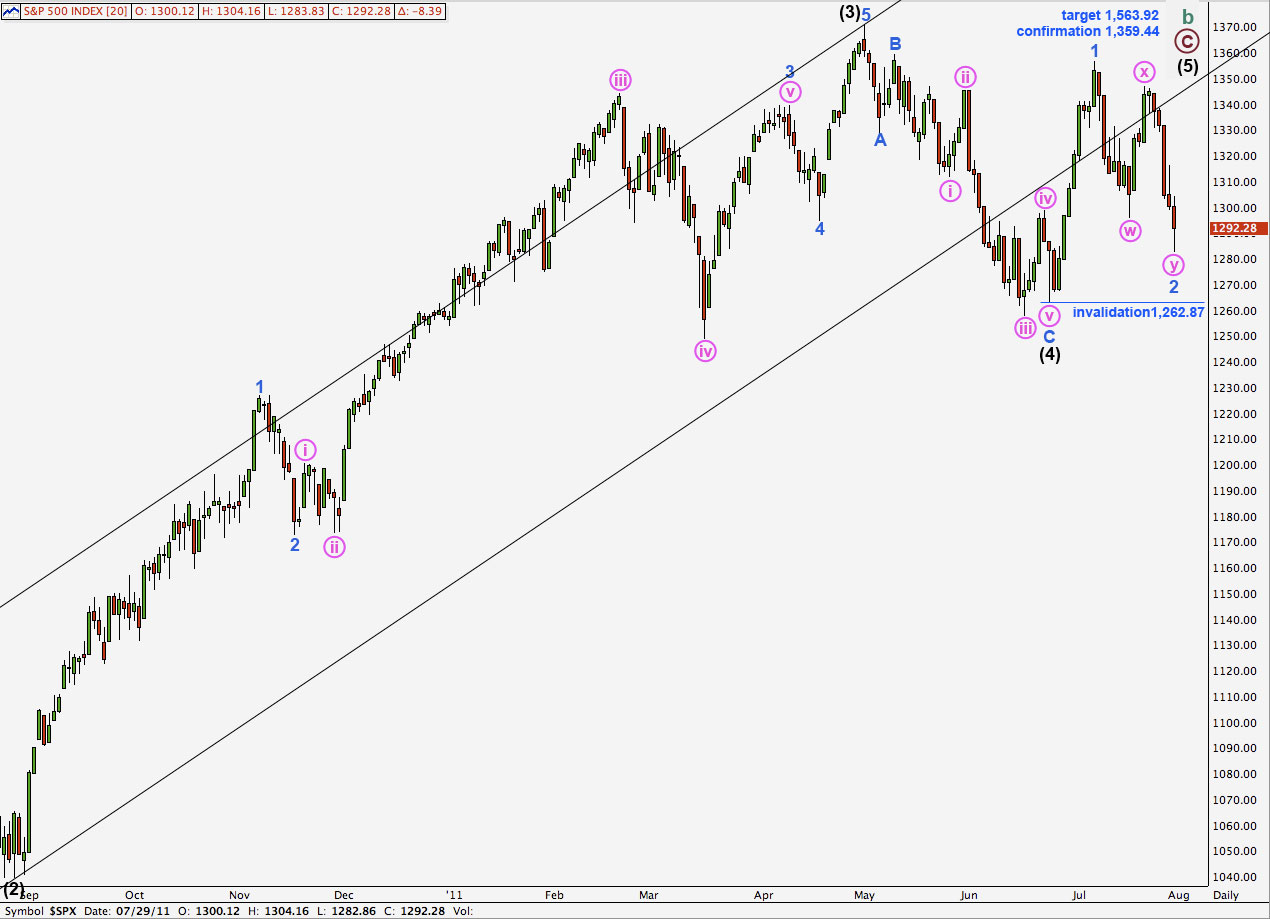
Movement below 1,295.92 has reduced the probability of this wave count.
Wave 2 blue may be a complete, or almost complete, double zigzag structure. So far wave y pink downwards has a complete corrective count of 11 on the hourly chart. If a new low is formed then this wave count would require more downwards movement of two more waves to continue for a corrective count of 15 to remain valid.
Wave 2 blue may not move beyond the start of wave 1 blue. This wave count is invalidated with movement below 1,262.87.
The major problem with this wave count on the daily chart is the size and duration of wave iv pink within 3 blue of (3) black upwards. It is larger than other corrections of one and two degrees higher.