
Elliott Wave chart analysis for the S&P 500 for 28th July, 2011. Please click on the charts below to enlarge.
Main Wave Count.
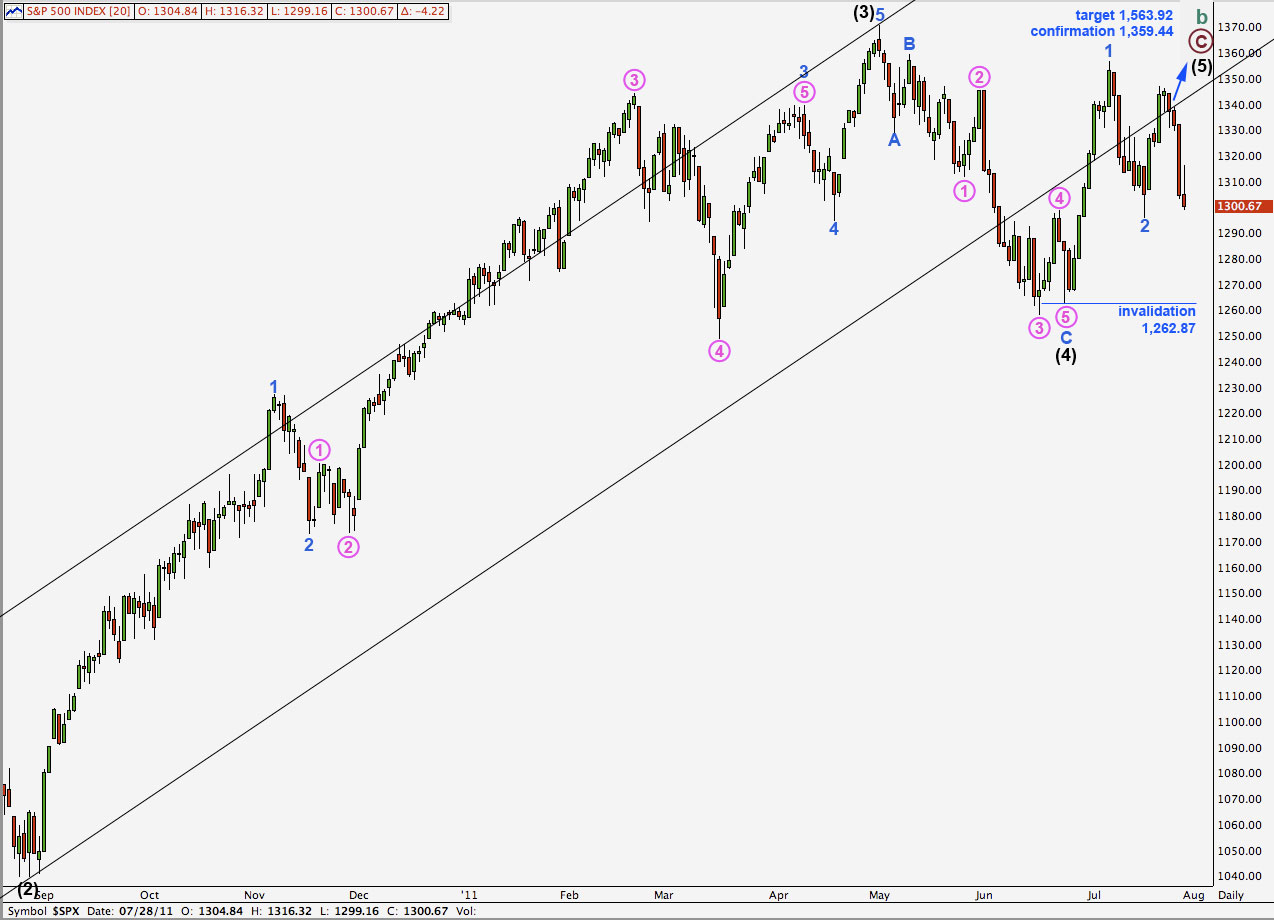
As expected the S&P moved higher to end 2.62 points short of our short term target, then turned downwards to make a new low.
For this main wave count downwards movement should be over for now. We would expect strong upwards movement to begin tomorrow for a third wave. Our alternate wave count expects a little upwards movement tomorrow, but it expects this to be followed by strong third wave movement down. At this stage our wave counts again diverge in our expectations in the short term.
Positives for this wave count:
– we can see cycle wave A as a three wave structure and expect upwards movement for cycle wave B to reach at least to 1,494.15 where it will be 90% the length of cycle wave A.
– the problem of how to see the last piece of upwards movement to end black wave 3 is completely resolved.
– with a new all time high possible for this wave count it fits with other indices which have made new all time highs.
Negatives for this wave count:
– wave 4 pink within wave 3 blue within wave 3 black is out of proportion to other corrections of a higher wave degree; it is too large.
– it does not have as good a fit within its trend channel as the main wave count does.
– wave behaviour for this week does not fit with this wave count
It is possible that this wave count is correct as second waves can correct to deep degrees. Wave ii pink, however, now has an impulsive look to it and not an obvious corrective look.
We may use Elliott’s channeling technique around the second structure in the double for ii pink, about wave y green. We would want to see this channel breached by upwards movement to have some indication that wave ii pink is over and wave iii pink is underway.
Movement above 1,316.32 would invalidate the alternate hourly wave count and add confidence to this main wave count.
The mid term target remains the same: at 1,447.38 wave 3 blue would reach 1.618 the length of wave 1 blue.
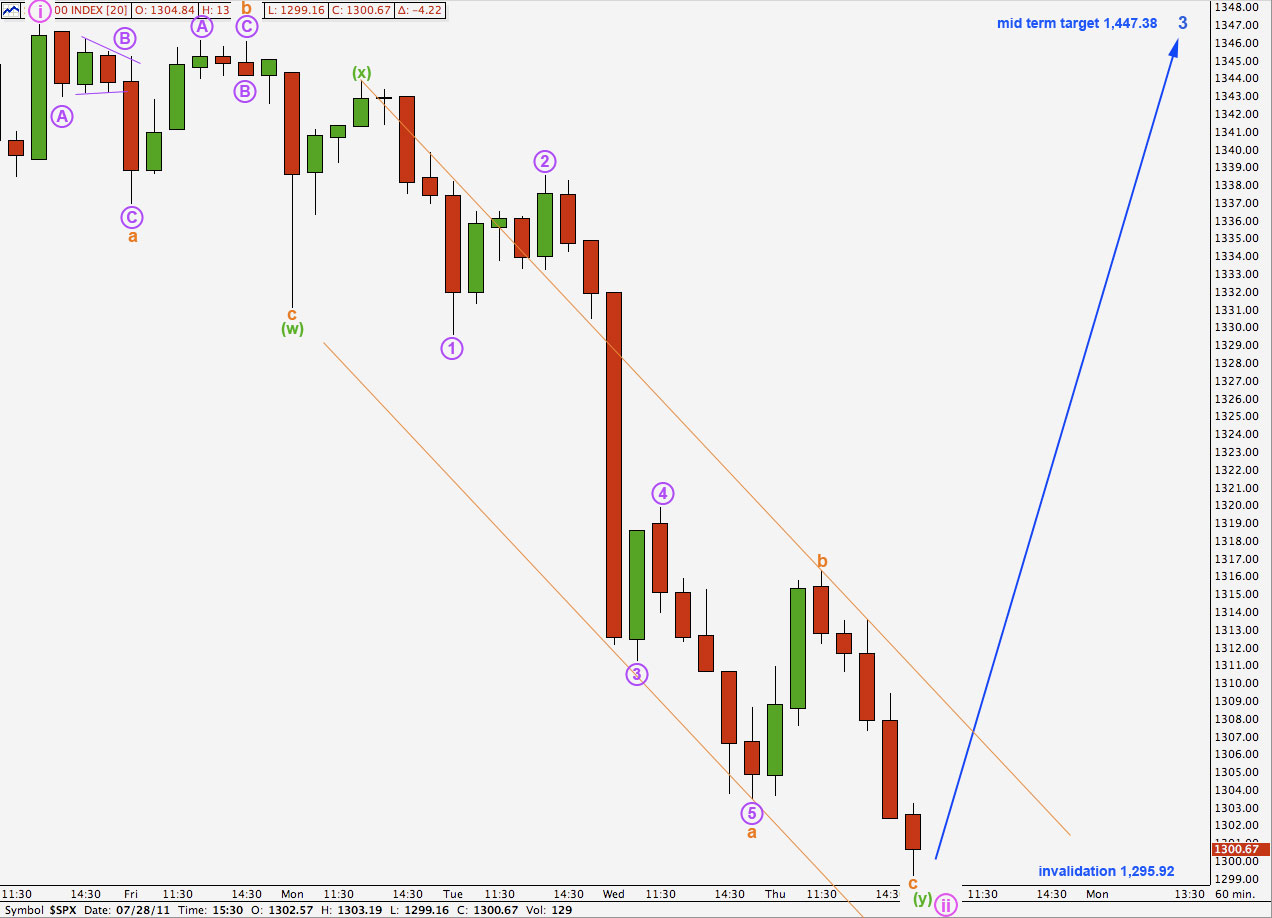
On the 5 minute chart wave c orange to end wave y green to end wave ii pink is a complete impulsive structure. It is likely that downwards movement for wave c orange is complete. If, however, price moves lower when markets open tomorrow, extending wave c orange further, it may not move beyond the start of wave i pink at 1,295.92.
Alternate Wave Count.
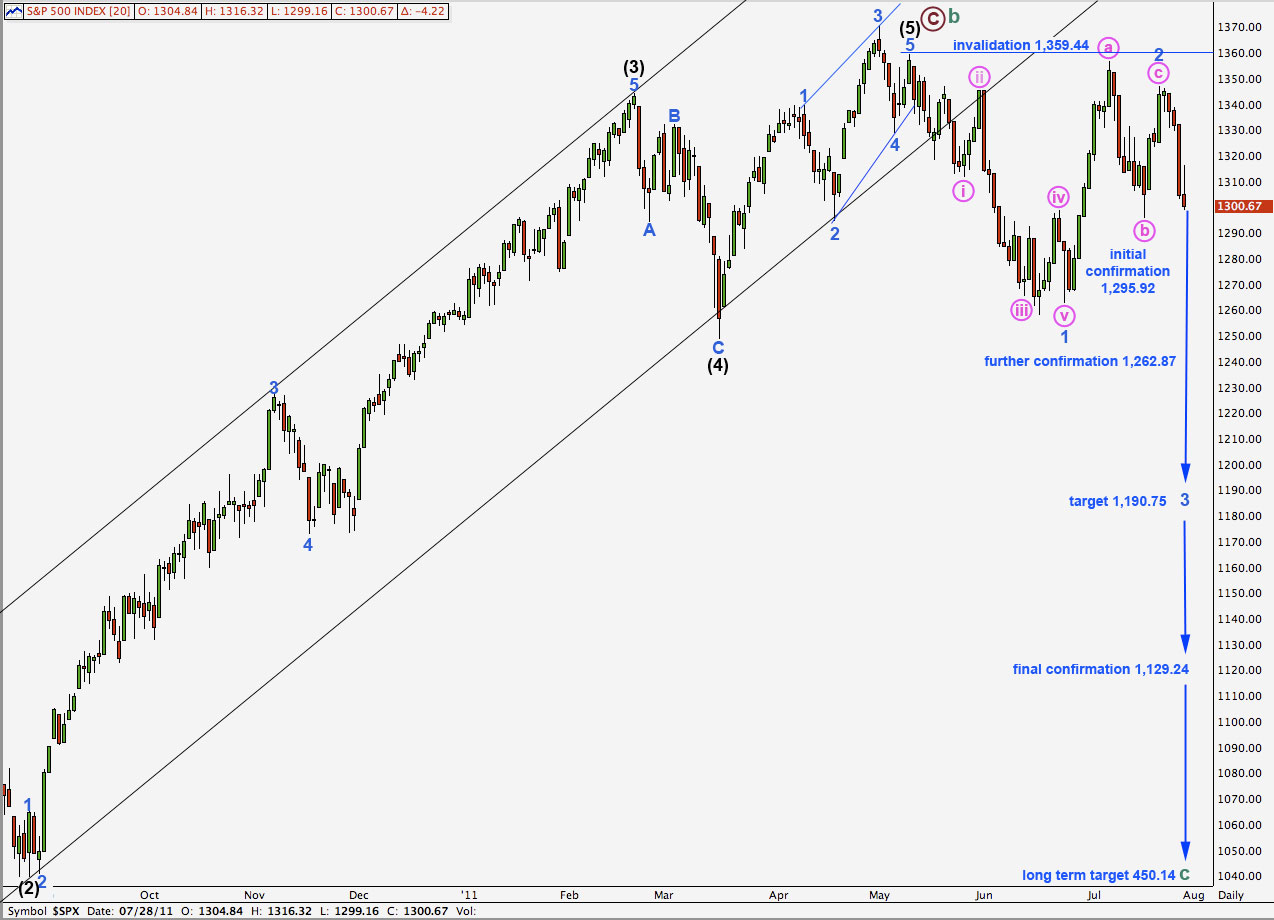
This wave count expected the same short term movement as the main hourly wave count did for yesterday. The target for a little upwards movement was 1,319 and price fell 2.62 points short of this.
This wave count expects a continuation of overall downwards movement tomorrow which should increase in volume and momentum.
If price moves below 1,295.92 the probability of this wave count will significantly increase.
Movement below 1,262.87 would be significant further confirmation. At that stage this would be our only daily wave count to consider and the main wave count would be relegated to an outlying alternate with the historical analysis.
Movement below 1,129.24 would provide final confirmation that we are in a bear market to last more than a year.
Positives for this wave count:
– it has a good fit in its trend channel.
– within primary wave C the proportions of black and blue waves look good.
– it explains the strong trend channel breach with recent downwards movement.
– yesterday’s wave behaviour fits well with expectations for this wave count and is enough force to explain the truncated c wave within 2 blue.
Negatives for this wave count:
– within the ending diagonal of wave 5 black it must see waves 1 and 3 blue as zigzags and this is stretching credulity a bit.
– I would have expected cycle B to reach 90% of cycle A at 1,494.15, because cycle A is most easily seen as a three wave structure, so then this would be a super cycle flat correction. With cycle wave B less than 90% of cycle wave A we have to see cycle wave A as a five wave structure which does not have a good fit.
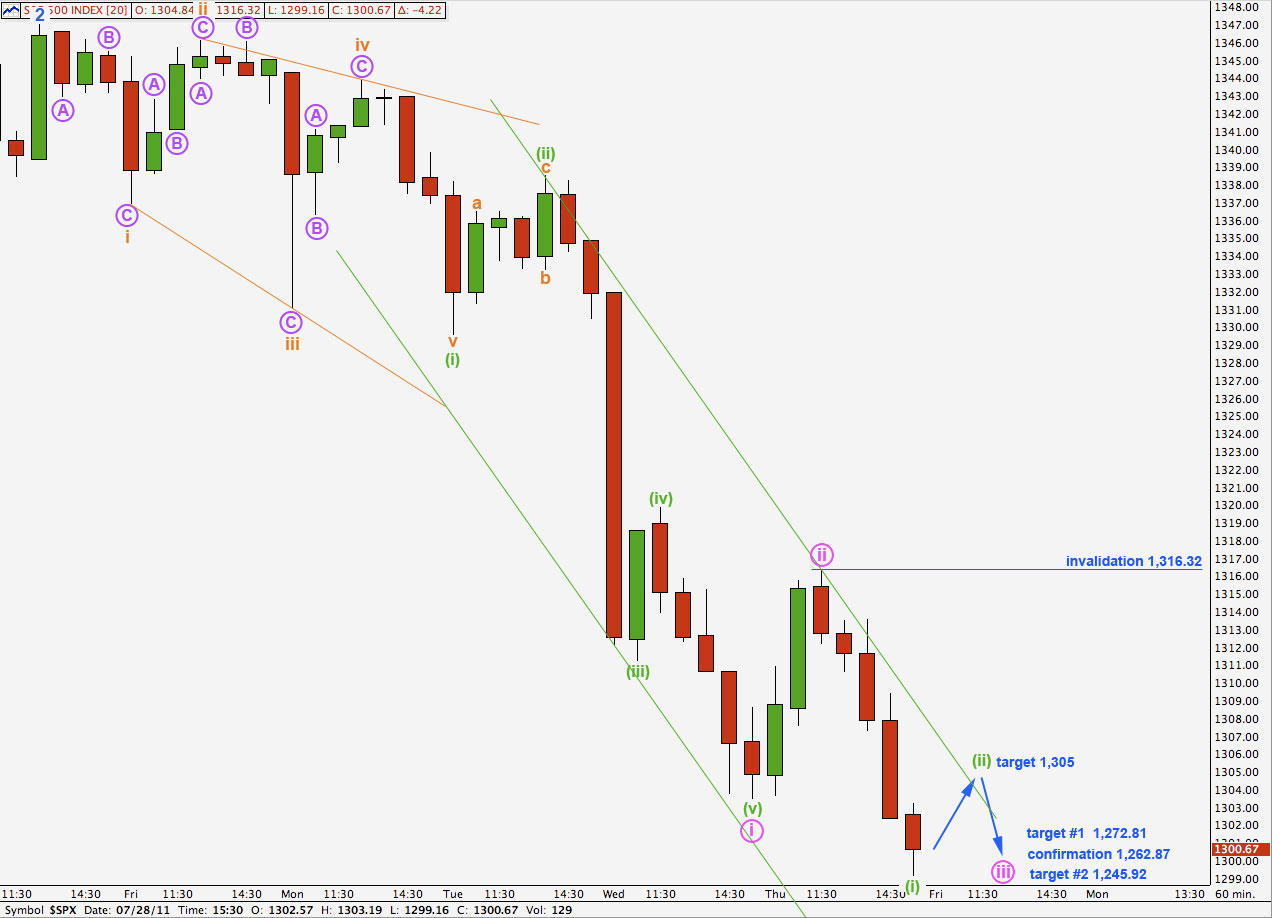
We should expect tomorrow’s session to most likely begin with a little upwards movement for a second wave correction which may be shallow and may only reach to about the 0.382 Fibonacci ratio of wave (i) green at 1,305.
Thereafter, this wave count expects a strong third wave within a third wave within a third wave downwards. If this wave count is correct this next wave down may be very strong.
Targets for wave iii pink to end are at 1,272.81 where it would reach equality with wave i pink. This is less likely than the second target at 1,245.92 where wave iii pink would reach 1.618 the length of wave i pink. About this point there is also some resistance on the daily chart at the end of wave 4 black at 1,249.05.
The end of wave iii pink may be another one to two weeks away.
I have drawn a best fit trend channel about this downwards movement. Price may be fairly well contained within it. When waves (ii) and (iii) green are complete we may redraw the channel using Elliott’s technique to find the ends of waves (iv) and (v) green and therefore the end of wave iii pink.
Wave (ii) green may not move beyond the start of wave (i) green. This wave count is invalidated with movement above 1,316.32.