
Elliott Wave chart analysis for the S&P 500 for 27th July, 2011. Please click on the charts below to enlarge.
I apologise to members for the very late publication of last analysis. It was prepared at the usual time but publication was missed. This is an oversight which should not happen again.
Main Wave Count.
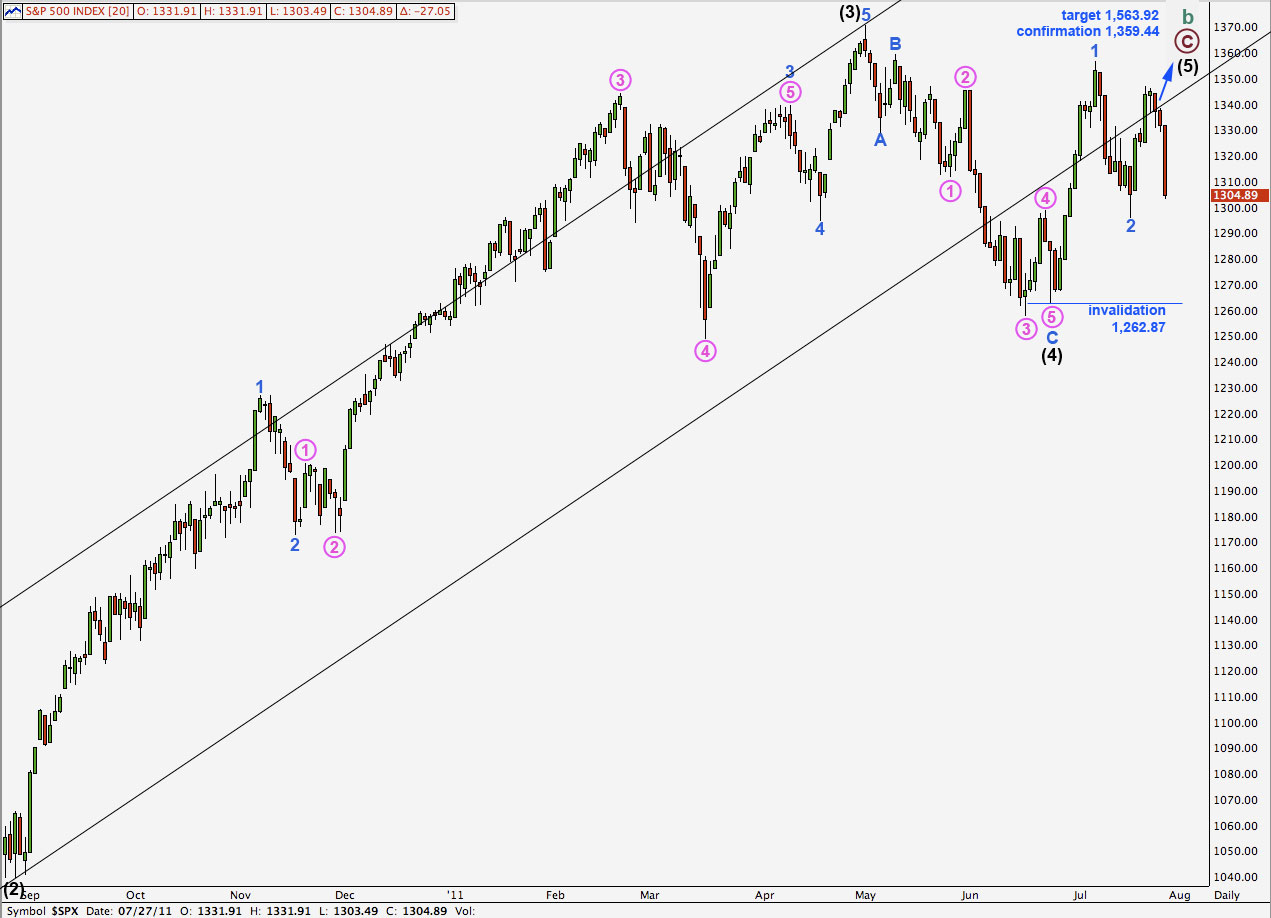
Last analysis expected a little more downwards movement but not as much as we got. Yesterday’s wave behaviour is exactly what we would expect to see for a third wave down which does not fit this wave count.
Positives for this wave count:
– we can see cycle wave A as a three wave structure and expect upwards movement for cycle wave B to reach at least to 1,494.15 where it will be 90% the length of cycle wave A.
– the problem of how to see the last piece of upwards movement to end black wave 3 is completely resolved.
– with a new all time high possible for this wave count it fits with other indices which have made new all time highs.
Negatives for this wave count:
– wave 4 pink within wave 3 blue within wave 3 black is out of proportion to other corrections of a higher wave degree; it is too large.
– it does not have as good a fit within its trend channel as the main wave count does.
– wave behaviour for yesterday does not fit with this wave count
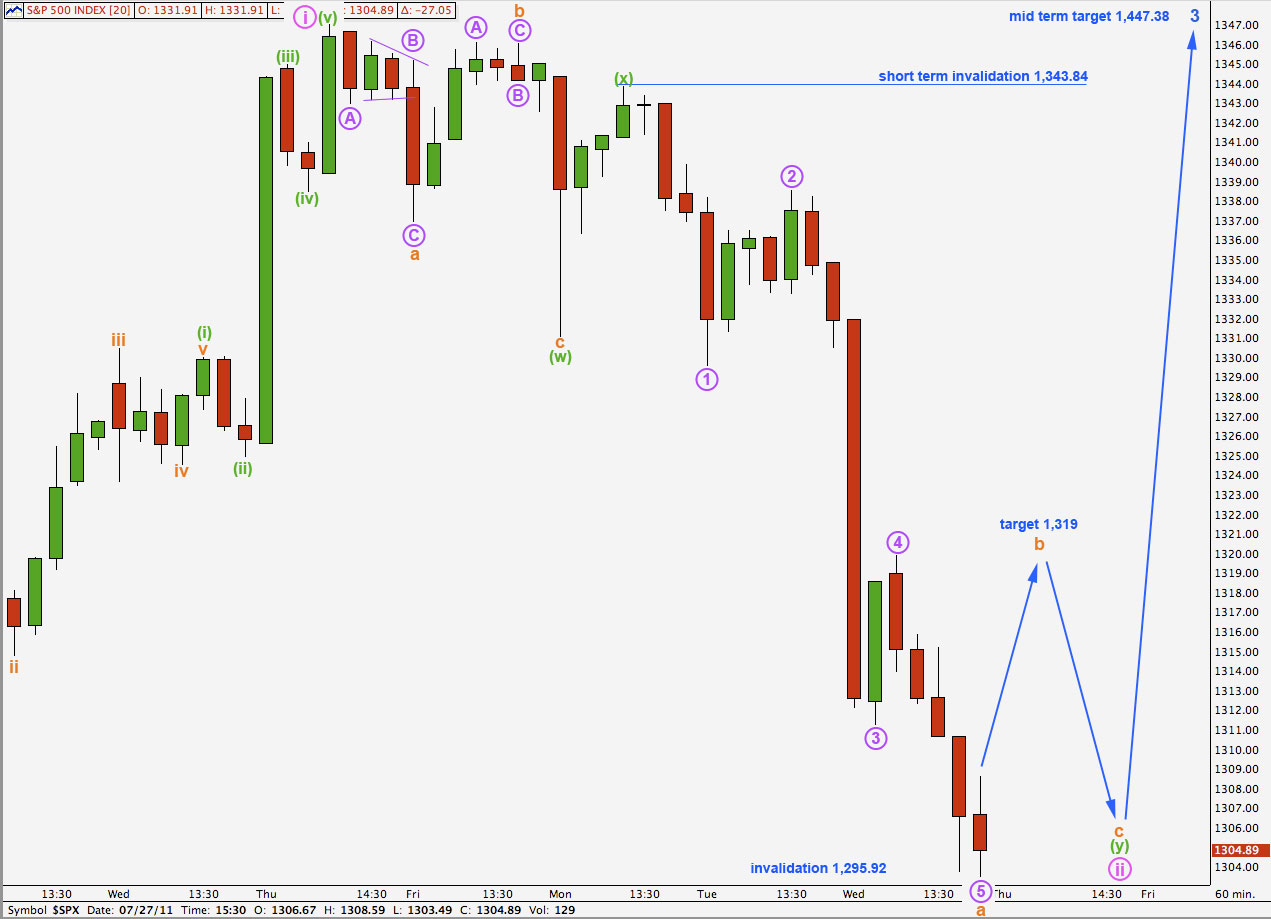
So far downwards movement has a count of 9 and no matter how we label this downwards movement it requires another two waves to complete a corrective count (one up and one down). We will be expecting more downwards movement for tomorrow.
Wave ii pink is here labeled as a double zigzag combination: flat – X – zigzag. Wave y orange for the zigzag is incomplete.
Wave b orange within wave y green may correct to about 0.382 the length of wave a orange, about 1,319.
Thereafter, one final wave down would complete the correction for wave ii pink.
Wave ii pink may not move beyond the start of wave i pink. This wave count is invalidated with movement below 1,295.92.
If price moves below 1,295.92 the alternate wave count below will significantly increase in probability. At that stage this wave count will be an outlying alternate.
Alternate Wave Count.
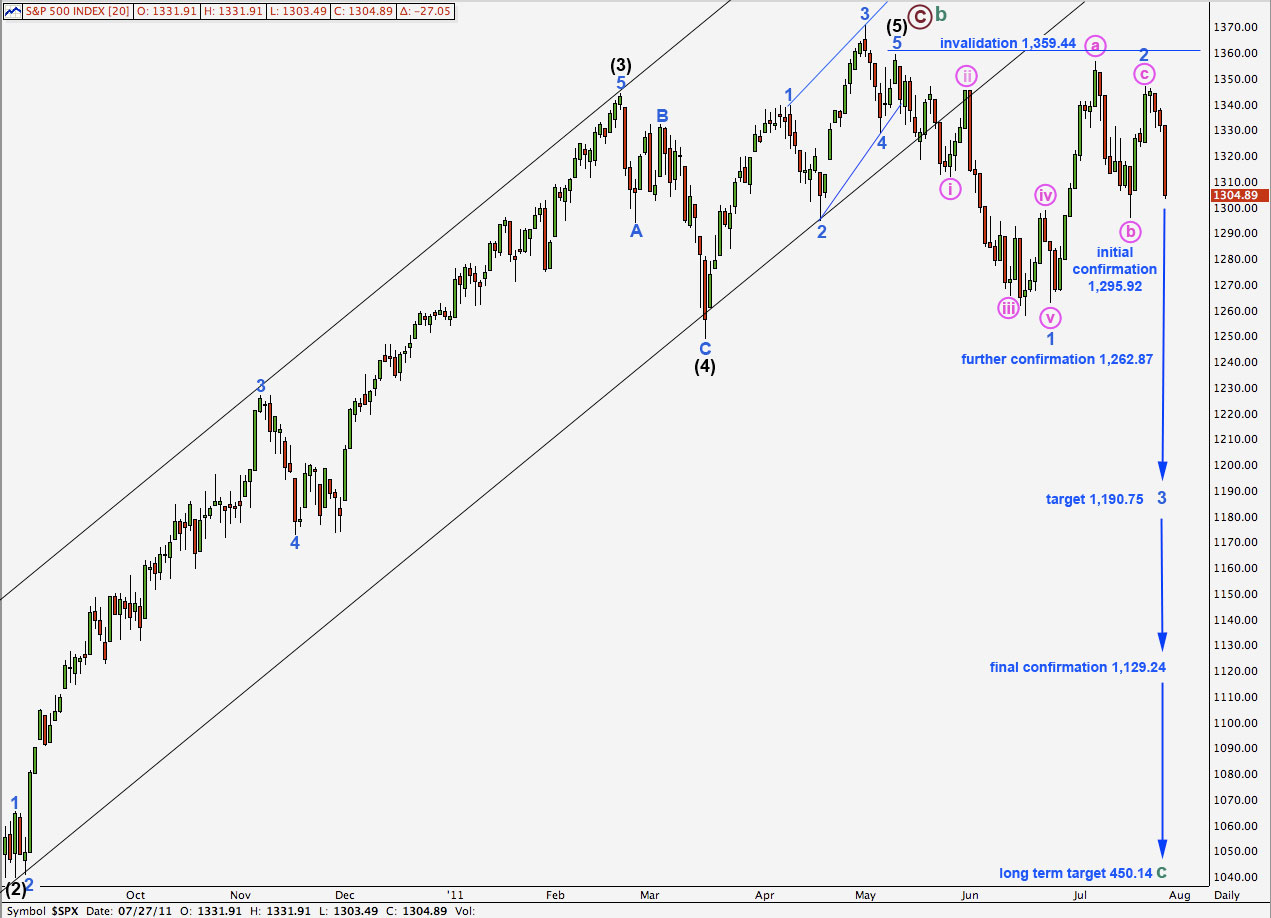
The very strong downwards movement yesterday may be enough force to explain a truncation for wave c pink of wave 2 blue zigzag.
If price moves below 1,295.92 the probability of this wave count will significantly increase.
Movement below 1,262.87 would be significant further confirmation. At that stage this would be our only daily wave count to consider and the main wave count would be relegated to an outlying alternate with the historical analysis.
Movement below 1,129.24 would provide final confirmation that we are in a bear market to last more than a year.
Positives for this wave count:
– it has a good fit in its trend channel.
– within primary wave C the proportions of black and blue waves look good.
– it explains the strong trend channel breach with recent downwards movement.
– yesterday’s wave behaviour fits well with expectations for this wave count and is enough force to explain the truncated c wave within 2 blue.
Negatives for this wave count:
– within the ending diagonal of wave 5 black it must see waves 1 and 3 blue as zigzags and this is stretching credulity a bit.
– I would have expected cycle B to reach 90% of cycle A at 1,494.15, because cycle A is most easily seen as a three wave structure, so then this would be a super cycle flat correction. With cycle wave B less than 90% of cycle wave A we have to see cycle wave A as a five wave structure which does not have a good fit.
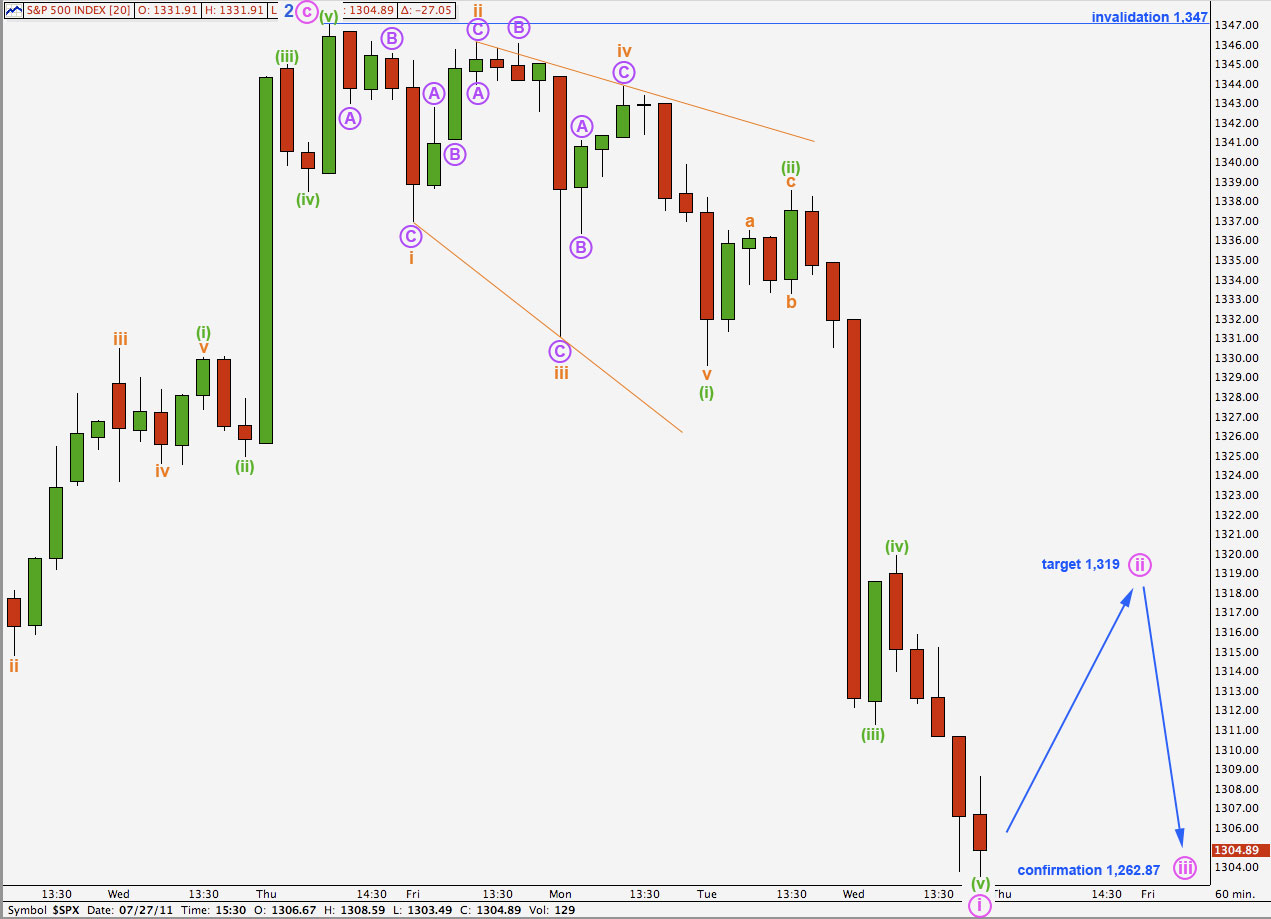
So far downwards movement from the high at 1,347 has an impulsive count of 9. The final wave down can be seen as a complete impulse on the 5 minute chart and it may be over here at 1,303.49.
Ratios within wave i pink are: wave (iii) green is just 0.9 points short of 1.618 the length of wave (i) green and wave (v) green is 1.03 points short of equality with wave (i) green. The probability that this is correctly labeled is high with these excellent and typical Fibonacci ratios within this impulse. Although a very small 1.03 points further downwards, immediately upon markets opening tomorrow, would improve the ratio between wave (v) green and wave (i) green.
We may expect a little upwards movement for a second wave correction to begin tomorrow. Wave ii pink may only correct to about the 0.382 Fibonacci ratio of wave i pink at 1,319. This correction may be shallow because the force within wave 3 blue may be enough to shorten it.
Wave ii pink may not move beyond the start of wave i pink. This wave count is invalidated with movement above 1,347.