
Elliott Wave chart analysis for the S&P 500 for 26th July, 2011. Please click on the charts below to enlarge.
Main Wave Count.
Movement when viewed on the hourly chart conforms to our expectations for this wave count.
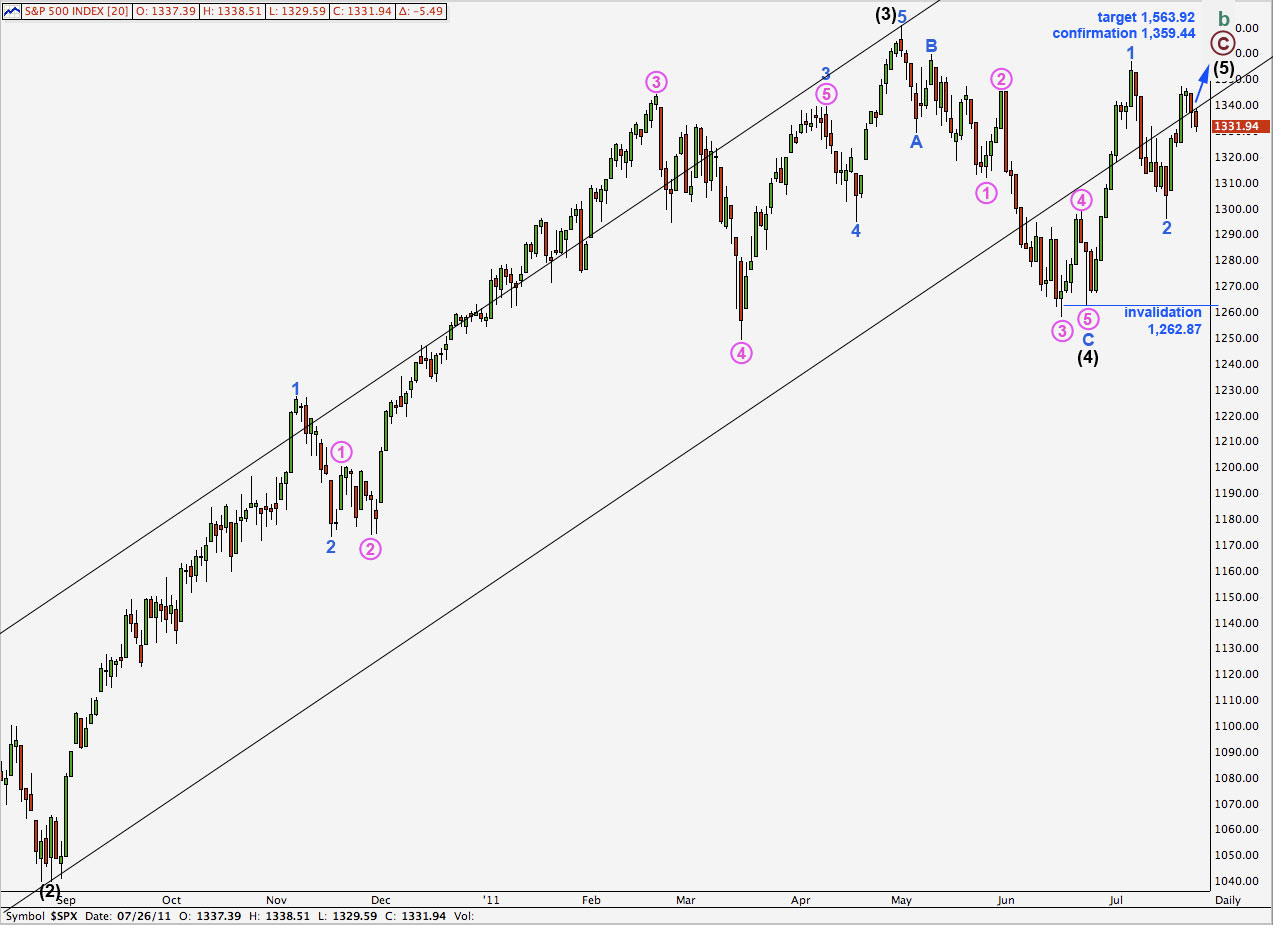
Positives for this wave count:
– we can see cycle wave A as a three wave structure and expect upwards movement for cycle wave B to reach at least to 1,494.15 where it will be 90% the length of cycle wave A.
– the problem of how to see the last piece of upwards movement to end black wave 3 is completely resolved.
– recent wave behaviour fits expectations for this wave count.
– with a new all time high possible for this wave count it fits with other indices which have made new all time highs.
Negatives for this wave count:
– wave 4 pink within wave 3 blue within wave 3 black is out of proportion to other corrections of a higher wave degree; it is too large.
– it does not have as good a fit within its trend channel as the main wave count does.
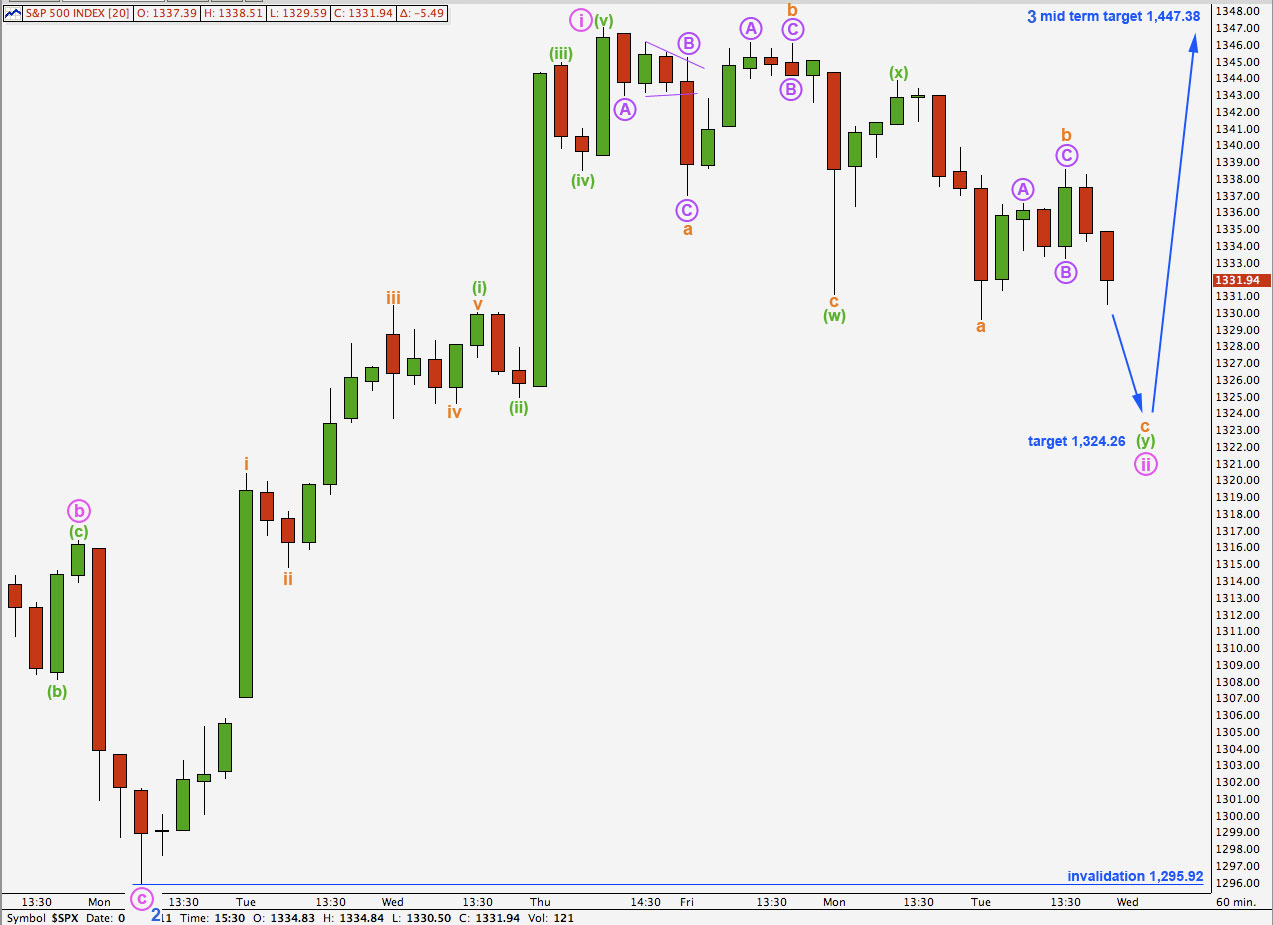
As expected the S&P moved lower yesterday. Wave a orange within wave (y) green is a clear 5 wave structure on the 5 minute chart. Wave b orange is a clear three.
Wave ii pink is here labeled as an incomplete double combination correction. Wave y orange is incomplete. At 1,324.26 wave c orange would reach equality with wave a orange. This is our target for downwards movement to end wave ii pink.
Wave ii could continue as a triple zigzag but the rarity of that structure means the probability of a continuation of downwards movement once the zigzag for (y) green is complete is very low.
Wave ii may not move beyond the start of wave i pink. This wave count is invalidated with movement below 1,295.92.
Alternate Wave Count.
Positives for this wave count:
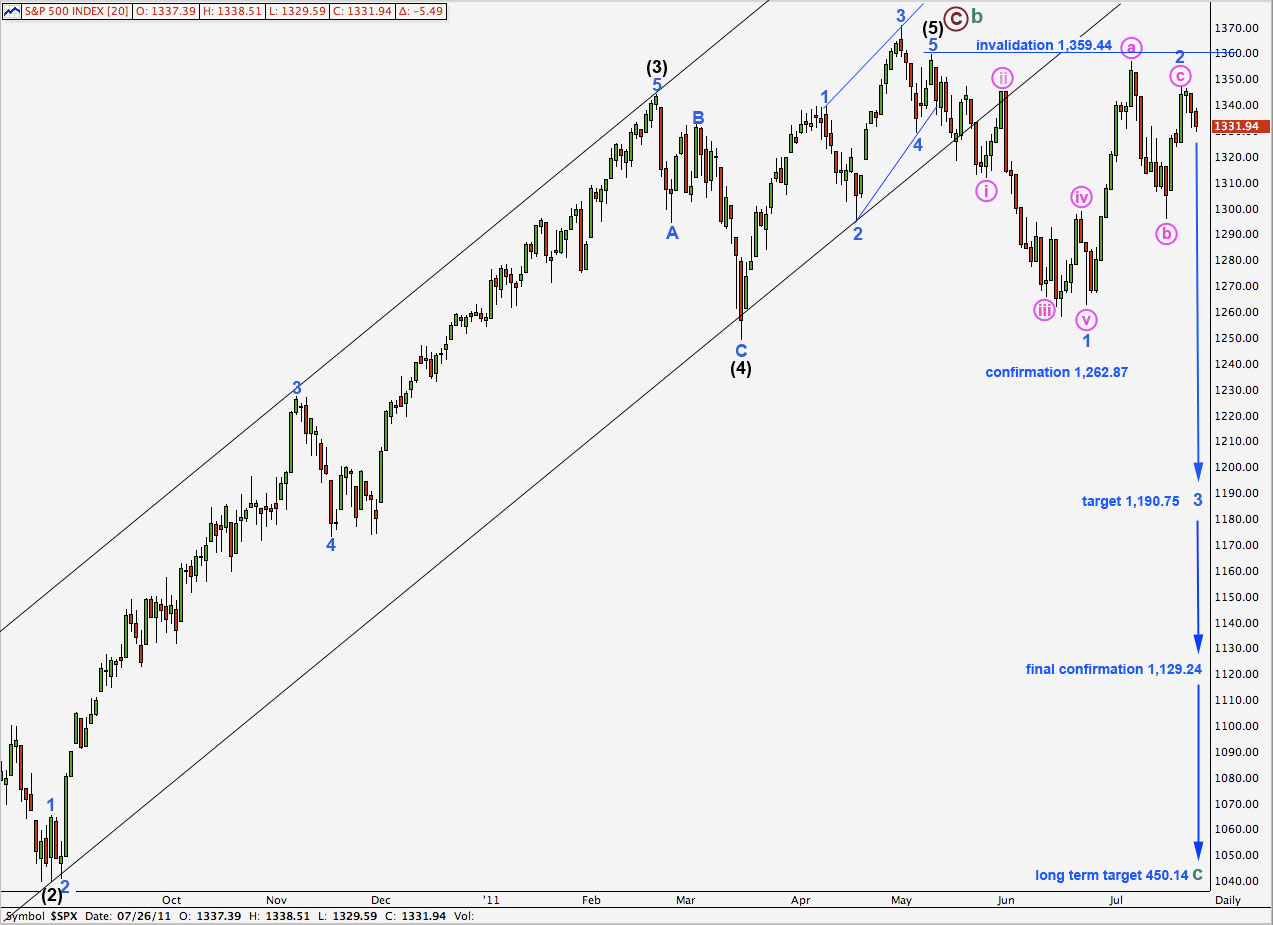
– it has a good fit in its trend channel.
– within primary wave C the proportions of black and blue waves look good.
– it explains the strong trend channel breach with recent downwards movement.
Negatives for this wave count:
– within the ending diagonal of wave 5 black it must see waves 1 and 3 blue as zigzags and this is stretching credulity a bit.
– I would have expected cycle B to reach 90% of cycle A at 1,494.15 because cycle A is most easily seen as a three wave structure, so then this would be a super cycle flat correction. With cycle wave B less than 90% of cycle wave A we have to see cycle wave A as a five wave structure which does not have a good fit.
– recent wave behaviour does not fit with expectations for this wave count.
– within wave 2 blue zigzag correction wave c pink is strongly truncated.
Wave 2 blue may not move beyond the start of wave 1 blue. This wave count is invalidated with movement above 1,359.44.
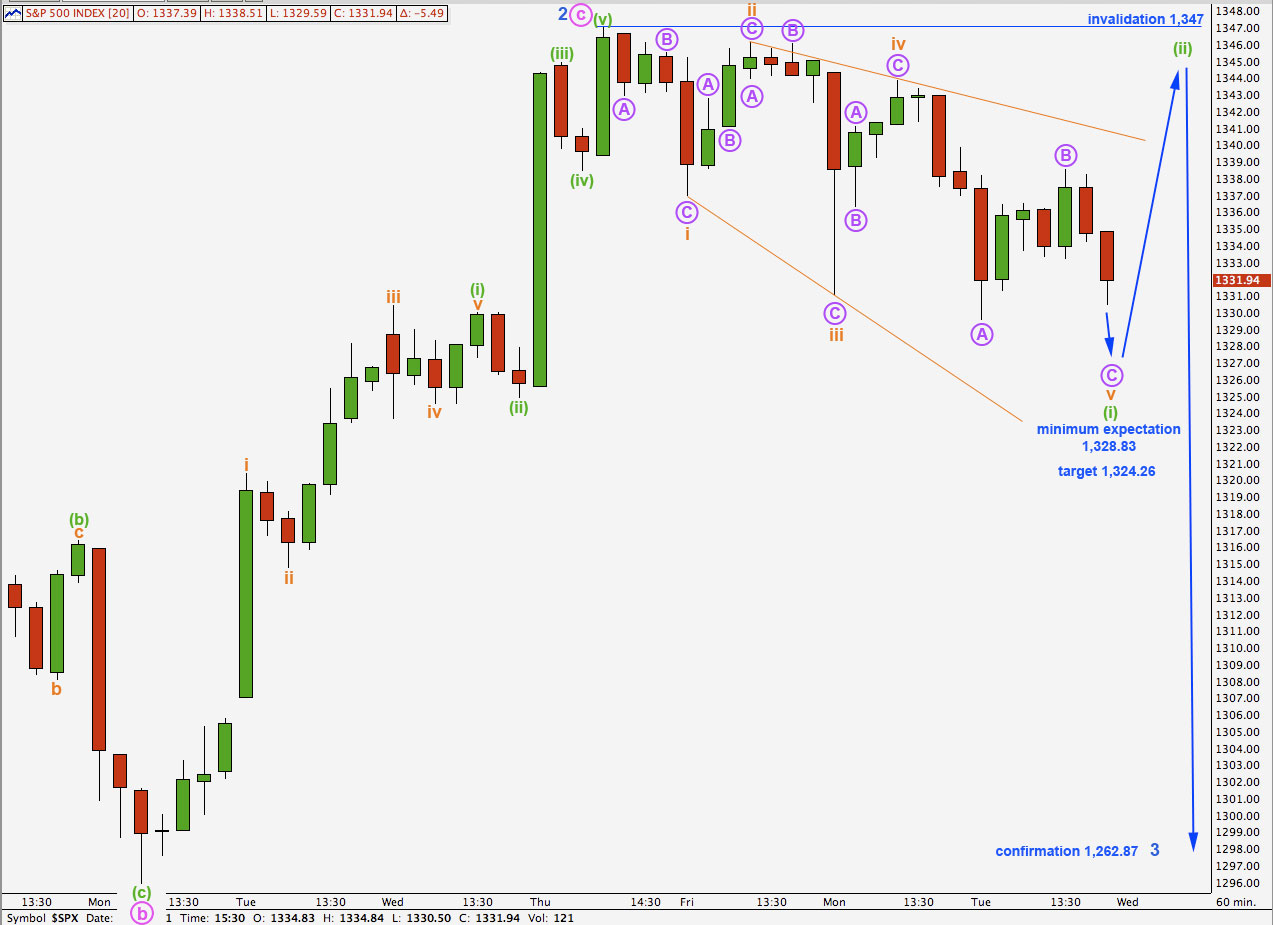
If wave (i) green is unfolding as a leading diagonal then wave v orange is unlikely to be complete and requires further downwards movement.
Within the zigzag for wave v orange wave C purple would reach equality with wave A purple at 1,324.26.
The diagonal is expanding because the fourth wave is longer than the second. We would expect then wave v orange to be longer than wave iii orange. Wave v orange passes equality with wave iii orange at 1,328.83.
When wave C purple completes wave v orange and wave (i) green then we will expect a trend change and upwards movement. Wave (ii) green may not move beyond the start of wave (i) green. This wave count is invalidated with movement above 1,347.
Movement below 1,262.87 would invalidate the main hourly wave count and confirm this alternate.