
Elliott Wave chart analysis for the S&P 500 for 22nd July, 2011. Please click on the charts below to enlarge.
Main Wave Count.
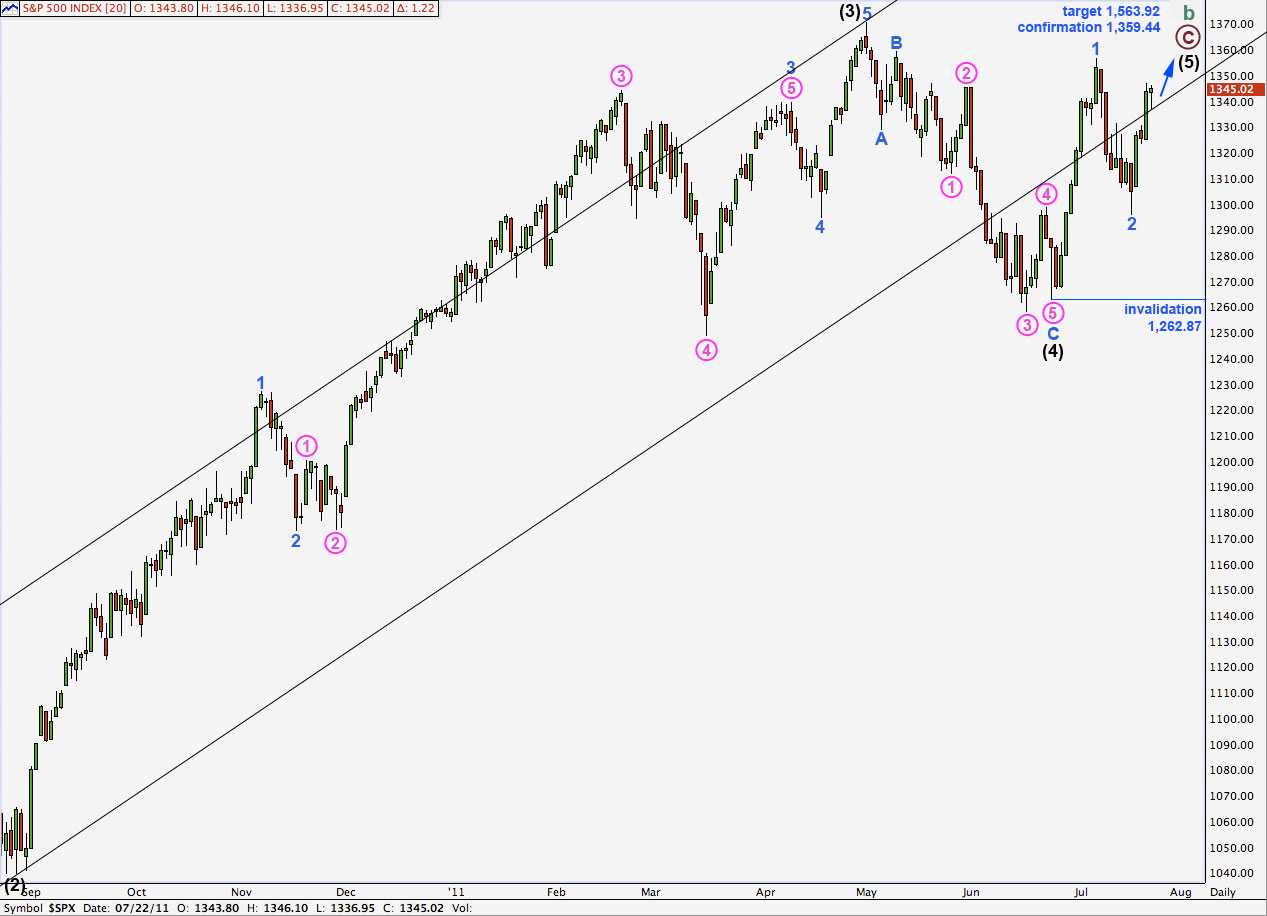
This wave count remains our more likely wave count at this stage.
It would be confirmed if price moves above 1,359.44. While price remains below this point both our wave counts will be valid.
If price moves above 1,359.44 we should expect it to continue to at least 1,494.15 where cycle wave b will reach 90% the length of cycle wave a. It is highly likely to reach 1,563.92 where primary wave C would reach equality with primary wave A.
Within intermediate (black) wave (5) there will be two reasonably sized corrections. We have already seen one with blue wave 2. Wave 4 blue may most likely be a shallow flat or triangle.
Any further extension of blue wave 2 downwards may not move beyond the start of wave 1 blue. This wave count is invalidated with movement below 1,262.87.
Positives for this wave count:
– we can see cycle wave A as a three wave structure and expect upwards movement for cycle wave B to reach at least to 1,494.15 where it will be 90% the length of cycle wave A.
– the problem of how to see the last piece of upwards movement to end black wave 3 is completely resolved.
– recent wave behaviour fits expectations for this wave count.
– with a new all time high possible for this wave count it fits with other indices which have made new all time highs.
Negatives for this wave count:
– wave 4 pink within wave 3 blue within wave 3 black is out of proportion to other corrections of a higher wave degree; it is too large.
– it does not have as good a fit within its trend channel as the main wave count does.
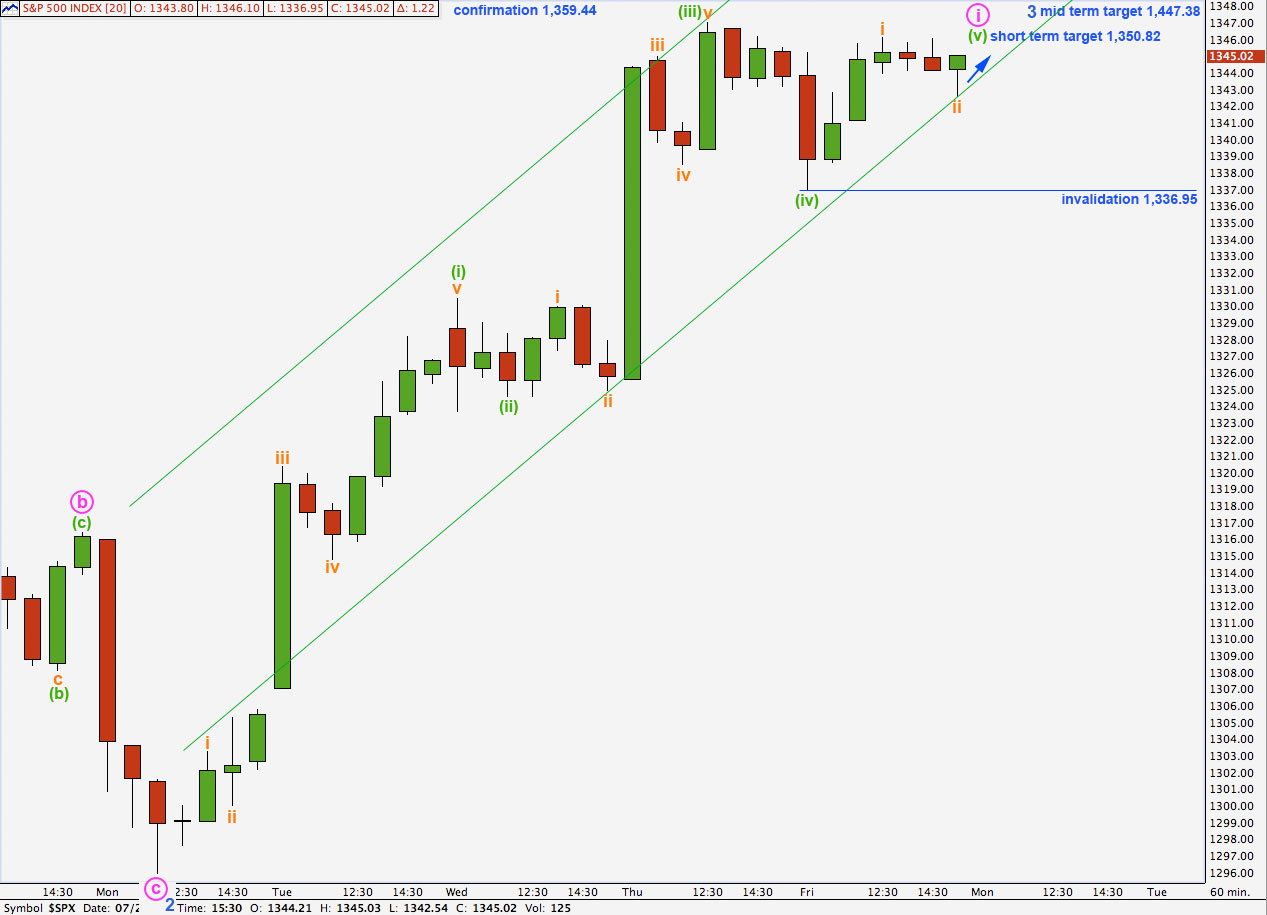
Wave (iv) green continued lower to begin Friday’s session which was not what we had expected but we understood it could happen. Wave (iv) green ended a little lower than the fourth wave of one lesser degree.
Thereafter, upwards movement has an impulsive count of 9 on the 5 minute chart. This may have been wave i orange within wave (v) green or it may also have been wave (v) green in its entirety if it is slightly truncated. I have labeled this wave with the highest probability labeling which assumes no truncation.
Wave ii orange looks like a completed flat correction on the 5 minute chart, but if it continues further as a double it may not move beyond the start of wave i orange below 1,336.95.
If price moves below this point then we may expect that wave (v) green and therefore wave i pink is complete. The invalidation point would move down to 1,295.92.
What is most likely is that we shall see upwards movement to start next week. At 1,350.42 wave (v) green would reach 0.618 the length of wave (i) green. This target should be reached within another two to three days. Because wave (iii) green is shorter than wave (i) green this gives a maximum limit to wave (v) green of no longer than equality with wave (iii) green, at 1,359.40.
At 1,447.38 wave 3 blue would reach 1.618 the length of wave 1 blue. This target may be still at least two weeks away.
Alternate Wave Count.
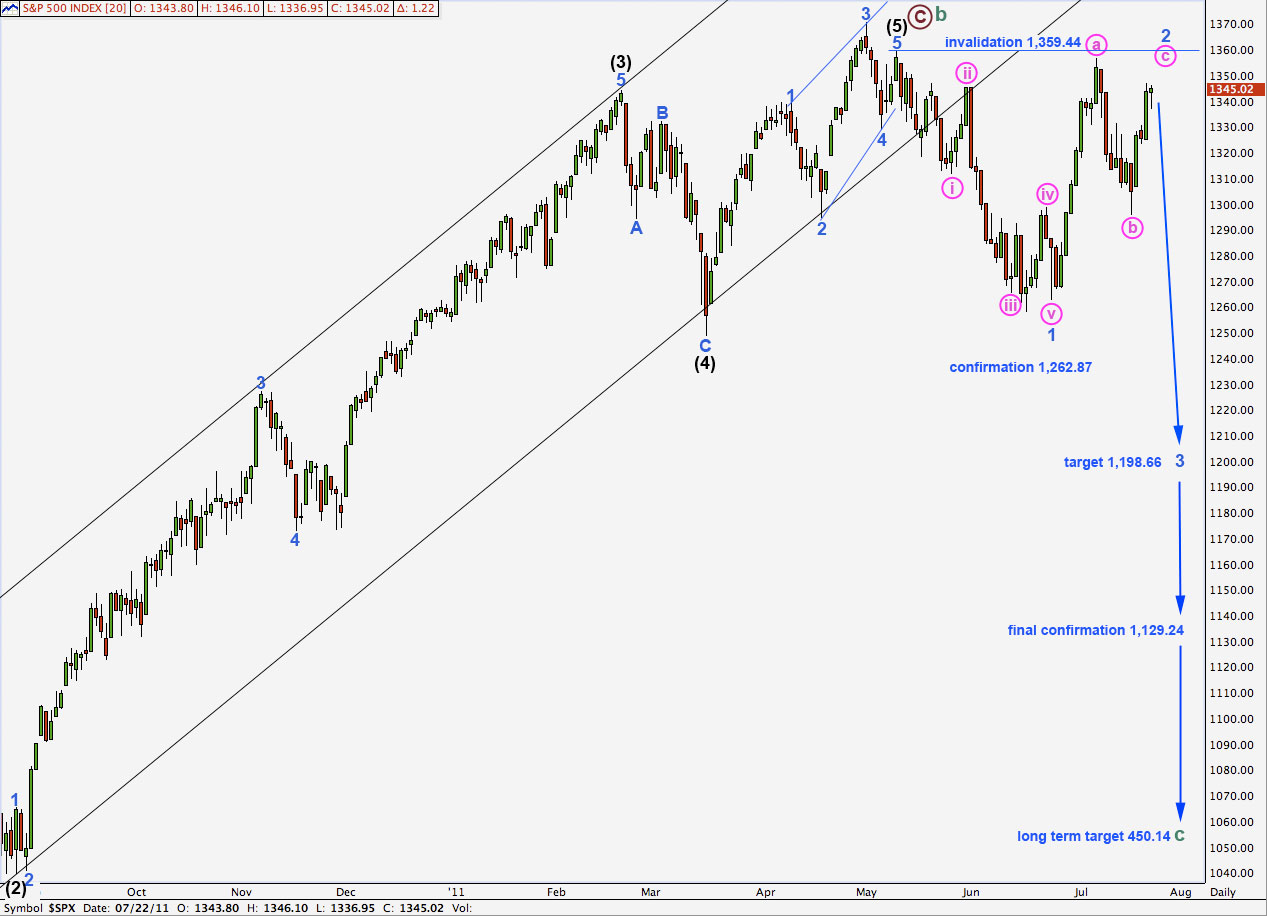
I have adjusted the labeling for recent movement on the daily chart back to how I had originally labeled it as it unfolded. Wave 1 blue may have ended at 1,262.87. Wave 2 blue is a very deep zigzag and may make a double top with the start of wave 1 blue.
Wave 2 blue now looks a little out of proportion to wave 1 blue. However, this interpretation has a higher probability than how I had it labeled for last analysis.
Positives for this wave count:
– it has a good fit in its trend channel.
– within primary wave C the proportions of black and blue waves look good.
– it explains the strong trend channel breach with recent downwards movement.
Negatives for this wave count:
– within the ending diagonal of wave 5 black it must see waves 1 and 3 blue as zigzags and this is stretching credulity a bit.
– I would have expected cycle B to reach 90% of cycle A at 1,494.15 because cycle A is most easily seen as a three wave structure, so then this would be a super cycle flat correction. With cycle wave B less than 90% of cycle wave A we have to see cycle wave A as a five wave structure which does not have a good fit.
– recent wave behaviour does not fit with expectations for this wave count
Wave 2 blue may not move beyond the start of wave 1 blue. This wave count is invalidated with movement above 1,359.44.
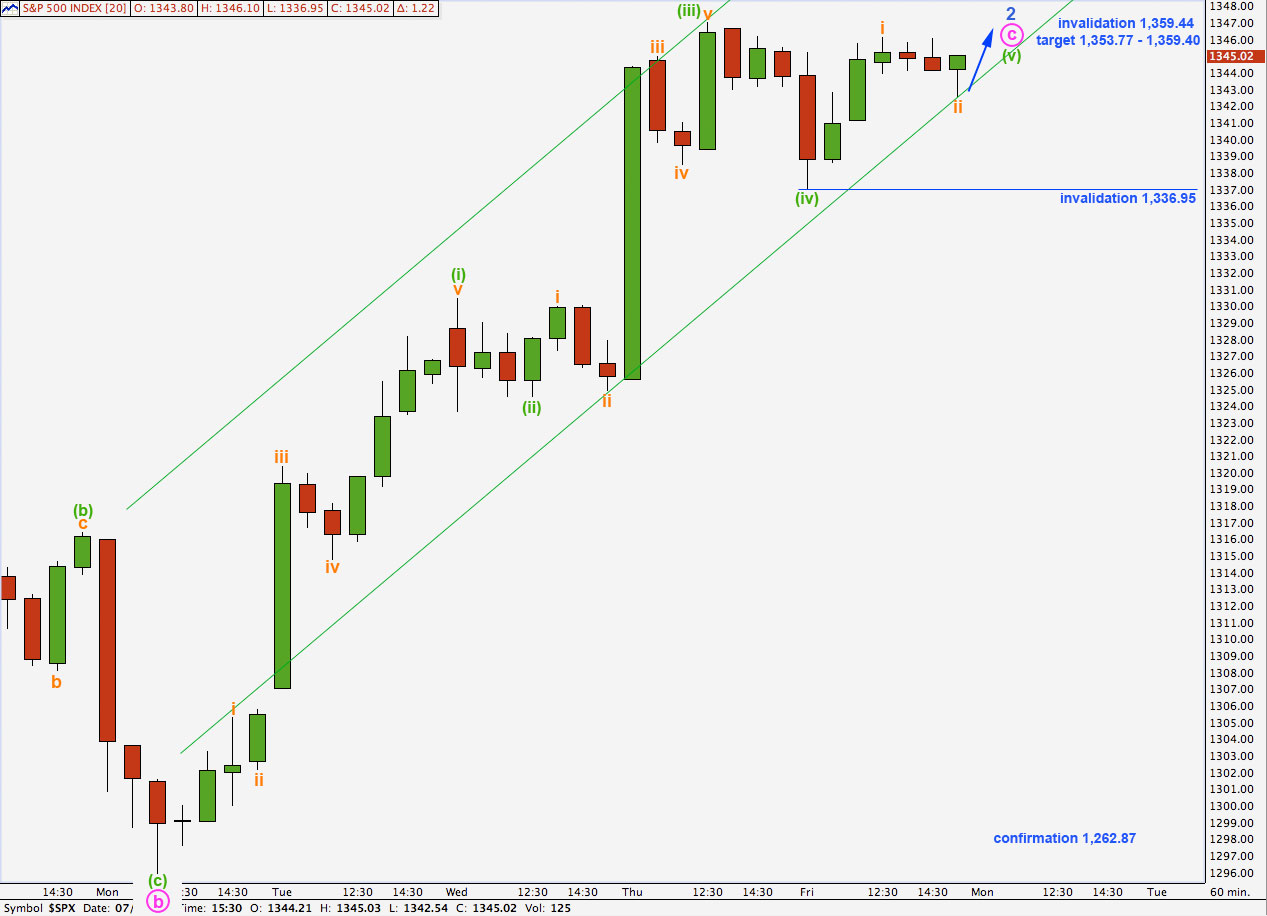
The labeling of subdivisions for recent movement is the same here as for the main hourly wave count and so our expectations of movement for the short term do not diverge.
Again, the last wave upwards may be labeled at orange degree and may only be wave i of wave (v) green. Or it may be a truncated wave (v) green in its entirety. I have labeled it with the most likely count, avoiding a truncation.
Movement below 1,336.95 would indicate that the impulse for wave c pink is complete.
When wave 2 blue is complete the next movement should be a strong third wave downwards.
At 1,353.77 wave c pink would reach 0.618 the length of wave a pink. At 1,359.40 wave (v) green would reach equality with wave (iii) green. This gives us our target zone for upwards movement to end.
Wave 2 blue may not move beyond the start of wave 1 blue. This wave count is invalidated with movement above 1,359.44.