
Elliott Wave chart analysis for the S&P 500 for 21st July, 2011. Please click on the charts below to enlarge.
Upwards movement for Thursday’s session has significantly reduced the probability of our bearish wave count and as a result I have swapped them around. The bullish wave count now looks more likely than the bearish one. Furthermore, because we have a triangle just formed on the hourly chart, we can be pretty certain that upwards movement is not over, at least in the short term.
Main Wave Count.
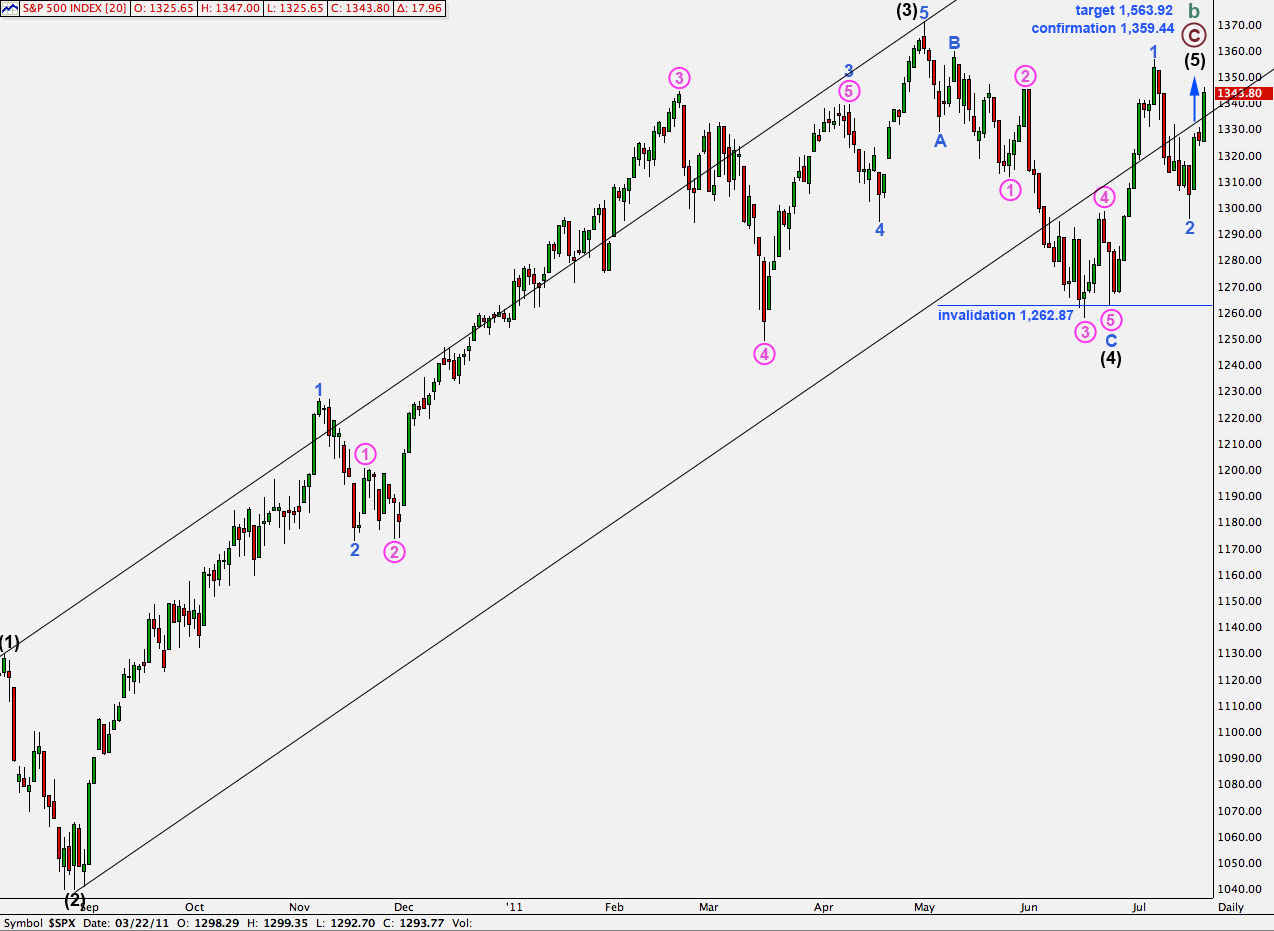
Recent upwards movement is looking very impulsive as this wave count would expect. If price continues higher, as we expect it to do, and moves above 1,359.44, then this will be our only wave count and the alternate will be invalidated.
If price moves above 1,359.44 we should expect that it is extremely likely to continue upwards to reach at least to 1,494.15. At that price point cycle wave b zigzag would be a 90% correction of cycle wave a. This means we can see cycle wave a as a three wave structure which fits better, and the correction at super cycle degree is a flat.
At 1,563.92 primary wave C would reach equality with primary wave A within this cycle degree wave b zigzag. This target has a fairly high probability because this is a common relationship between waves A and C of a zigzag.
Within this final fifth wave up at intermediate degree there will be two reasonably sized corrections: a second wave and a fourth wave. We have already seen the second wave for 2 blue which was a deep zigzag and the upcoming fourth wave correction for wave 4 blue should be shallow and either a flat or a triangle (most likely).
Positives for this wave count:
– we can see cycle wave A as a three wave structure and expect upwards movement for cycle wave B to reach at least to 1,494.15 where it will be 90% the length of cycle wave A.
– the problem of how to see the last piece of upwards movement to end black wave 3 is completely resolved.
– recent wave behaviour fits expectations for this wave count.
– with a new all time high possible for this wave count it fits with other indices which have made new all time highs.
Negatives for this wave count:
– wave 4 pink within wave 3 blue within wave 3 black is out of proportion to other corrections of a higher wave degree; it is too large.
– it does not have as good a fit within its trend channel as the main wave count does.
Upwards movement is a clear impulse which we would expect to see for a third wave. Wave behaviour fits this wave count very well.
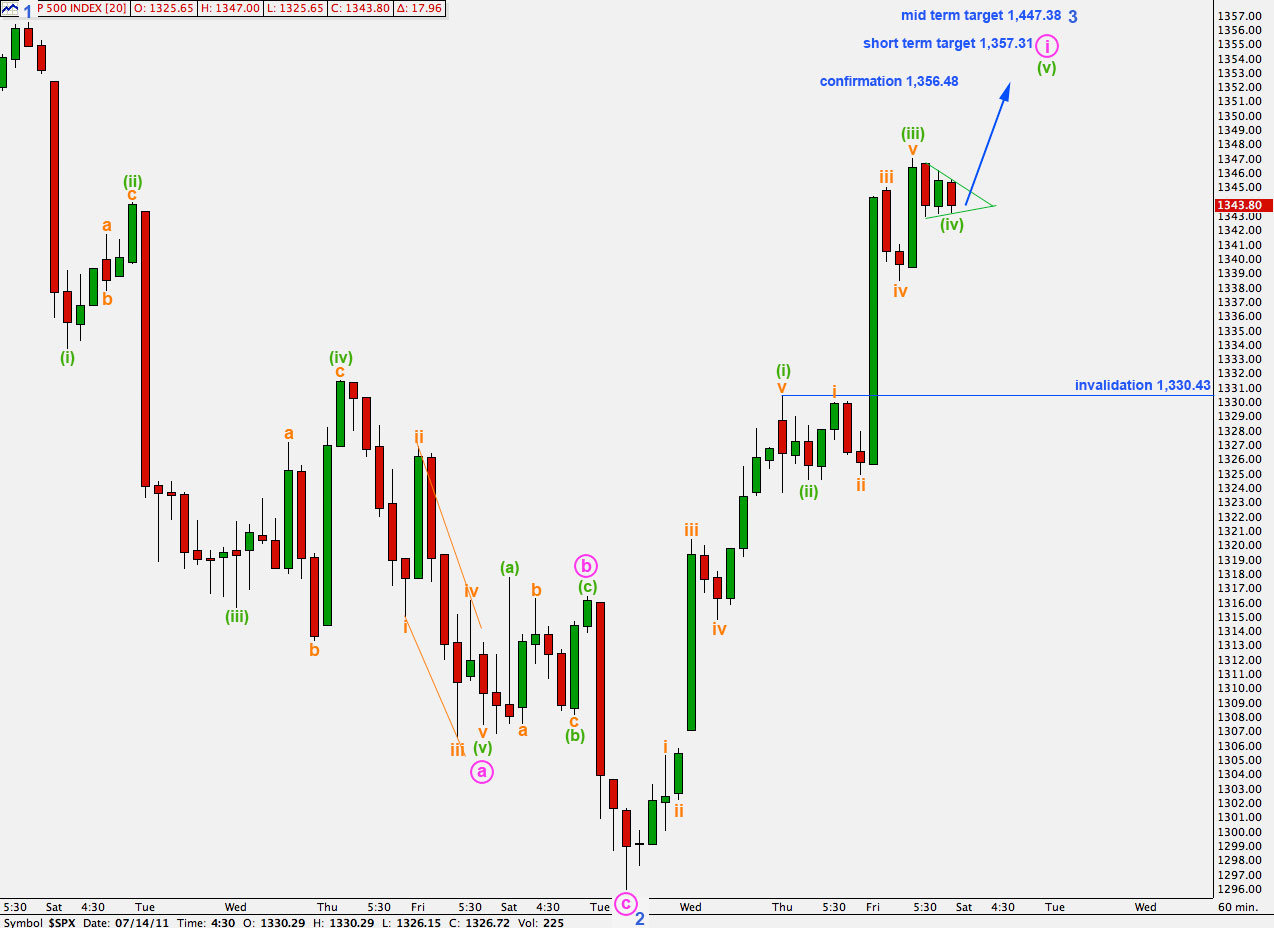
On the 5 minute chart we can see a triangle which may be almost complete; wave E within it looks to be subdividing into a triangle as well. It is fairly likely that wave (iv) green is either over or very close to it. If I have analysed the triangle incorrectly it may be wave b within wave (iv) green, and wave c would take price lower to end this fourth wave. Wave (iv) green may not move into wave (i) green price territory. This wave count is invalidated with movement below 1,330.43.
Wave (iii) green is shorter than wave (i) green and this limits wave (v) green to no longer than equality with wave (iii) green. This gives us a maximum level for wave (v) green to complete wave i pink at 1,365.88.
Ratios within wave (iii) green are: wave iii orange has no Fibonacci ratio to wave i orange and wave v orange is just 0.2 points short of 1.618 the length of wave i orange.
Wave (iii) green is just 1.1 points longer than 0.618 the length of wave (i) green. At 1,357.31 wave (v) green would reach 0.618 the length of wave (iii) green. This short term target may be reached in another day or two.
At 1,447.38 wave 3 blue would reach 1.618 the length of wave 1 blue. Because wave 2 blue was a relatively deep correction (64.7%) it is very likely that wave 3 would be longer than wave 1. About this target we may see the temporary end to upwards movement and the start of the next larger correction.
The mid term target for wave 3 blue may be at least a couple of weeks away still.
Alternate Wave Count.
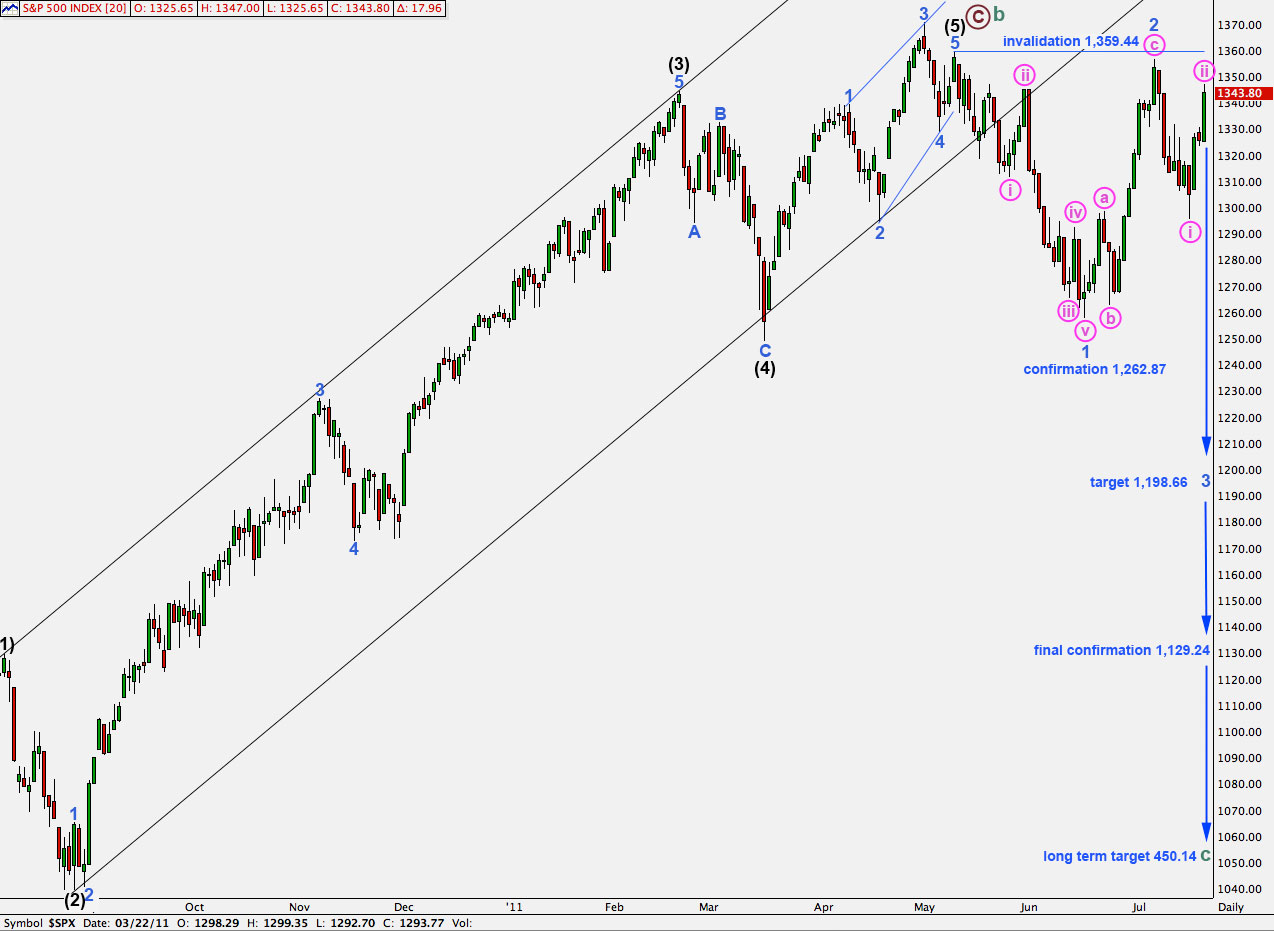
This wave count remains technically possible, and second waves can be deep corrections, but it is unlikely that we would see two very deep second wave corrections at the start of a new downtrend. We would have expected wave ii pink to be shallower than this.
Positives for this wave count:
– it has a good fit in its trend channel.
– within primary wave C the proportions of black and blue waves look good.
– it explains the strong trend channel breach with recent downwards movement.
Negatives for this wave count:
– within the ending diagonal of wave 5 black it must see waves 1 and 3 blue as zigzags and this is stretching credulity a bit.
– I would have expected cycle B to reach 90% of cycle A at 1,494.15 because cycle A is most easily seen as a three wave structure, so then this would be a super cycle flat correction. With cycle wave B less than 90% of cycle wave A we have to see cycle wave A as a five wave structure which does not have a good fit.
– recent wave behaviour does not fit with expectations for this wave count
Wave 2 blue may not move beyond the start of wave 1 blue. This wave count is invalidated with movement above 1,359.44.
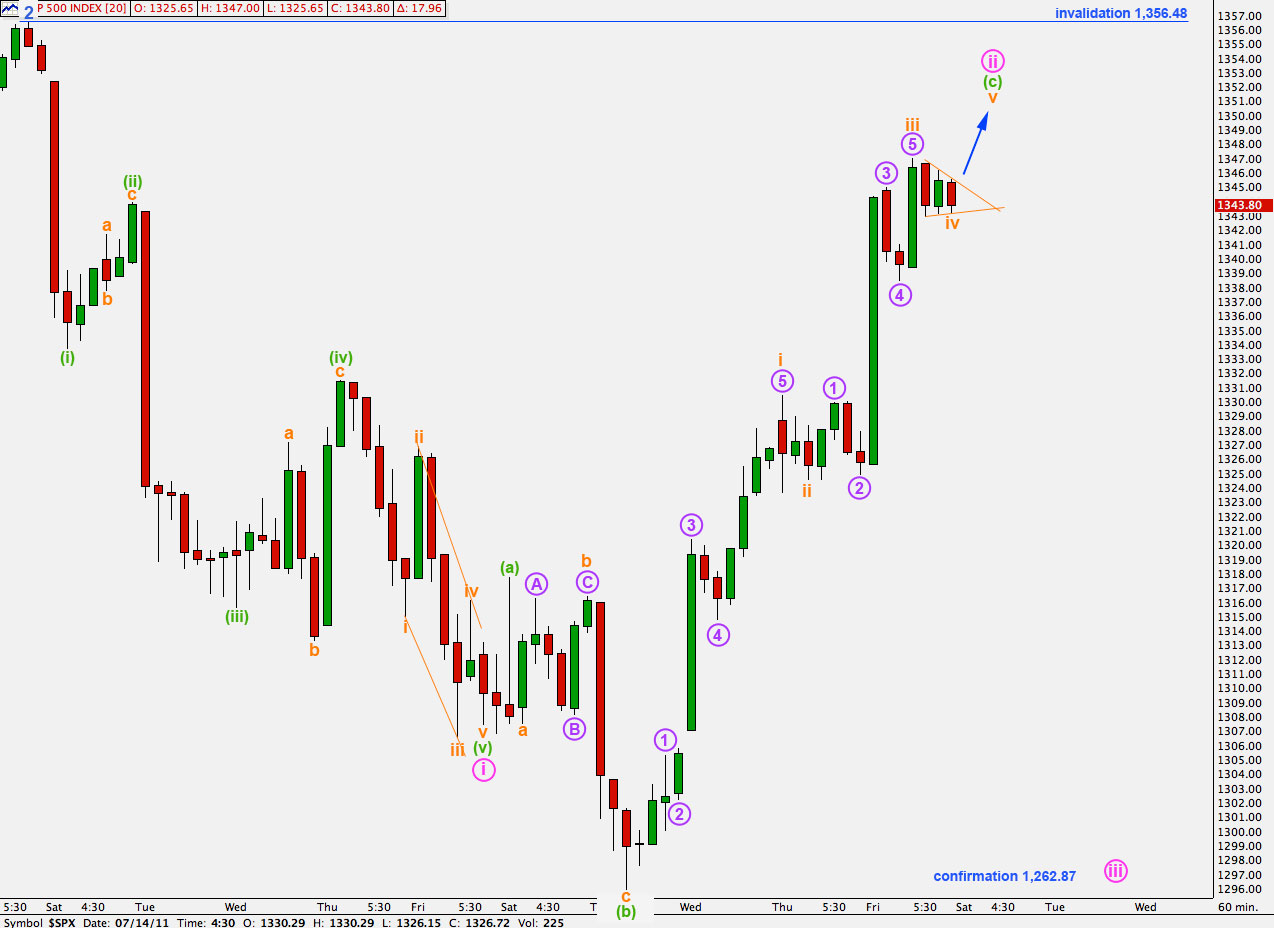
There is very little room for movement. Hopefully the next wave up will take price above 1,356.48 and provide us with clarity. But it would be unsurprising if it did not.
The upwards structure for both wave counts is incomplete and, with a triangle looking like it is either complete or almost complete in a fourth wave position, it is extremely likely we shall see more upwards movement tomorrow.
With wave ii pink now a very deep correction this wave count has significantly reduced in probability.
Wave ii pink may not move beyond the start of wave i pink. This wave count is invalidated with movement above 1,356.48.
If price moves above 1,356.48 this interpretation on the hourly chart will be invalid. However, on the daily chart we could see movement as still wave 2 blue and an obvious zigzag. Only movement above 1,359.44 will finally fully invalidate this bearish wave count.