
Elliott Wave chart analysis for the S&P 500 for 19th July, 2011. Please click on the charts below to enlarge.
Main Wave Count.
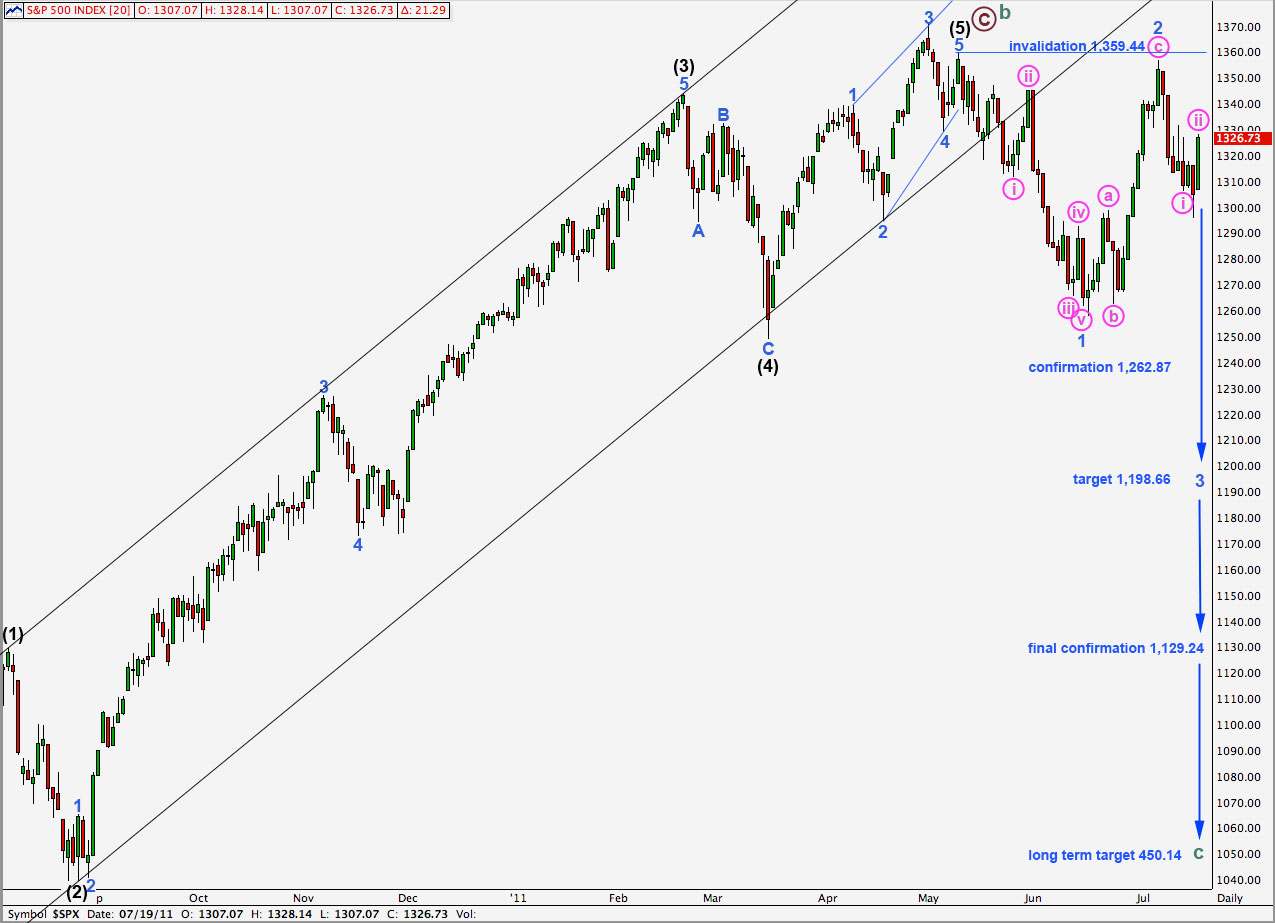
Upwards movement had our main hourly wave count for yesterday invalidated. In trying to see another possibility on the hourly chart I have found one which actually fits better. If wave ii pink was over yesterday at 1,328.14 then it is still a relatively shallow correction, being 43% of wave 1 pink. This is still acceptable in the context of a third wave down.
Positives for this wave count:
– it has a good fit in its trend channel.
– within primary wave C the proportions of black and blue waves look good.
– it explains the strong trend channel breach with recent downwards movement.
Negatives for this wave count:
– within the ending diagonal of wave 5 black it must see waves 1 and 3 blue as zigzags and this is stretching credulity a bit.
– I would have expected cycle B to reach 90% of cycle A at 1,494.15 because cycle A is most easily seen as a three wave structure, so this would be a super cycle flat correction.
Wave 2 blue may not move beyond the start of wave 1 blue. This wave count is invalidated with movement above 1,359.44.
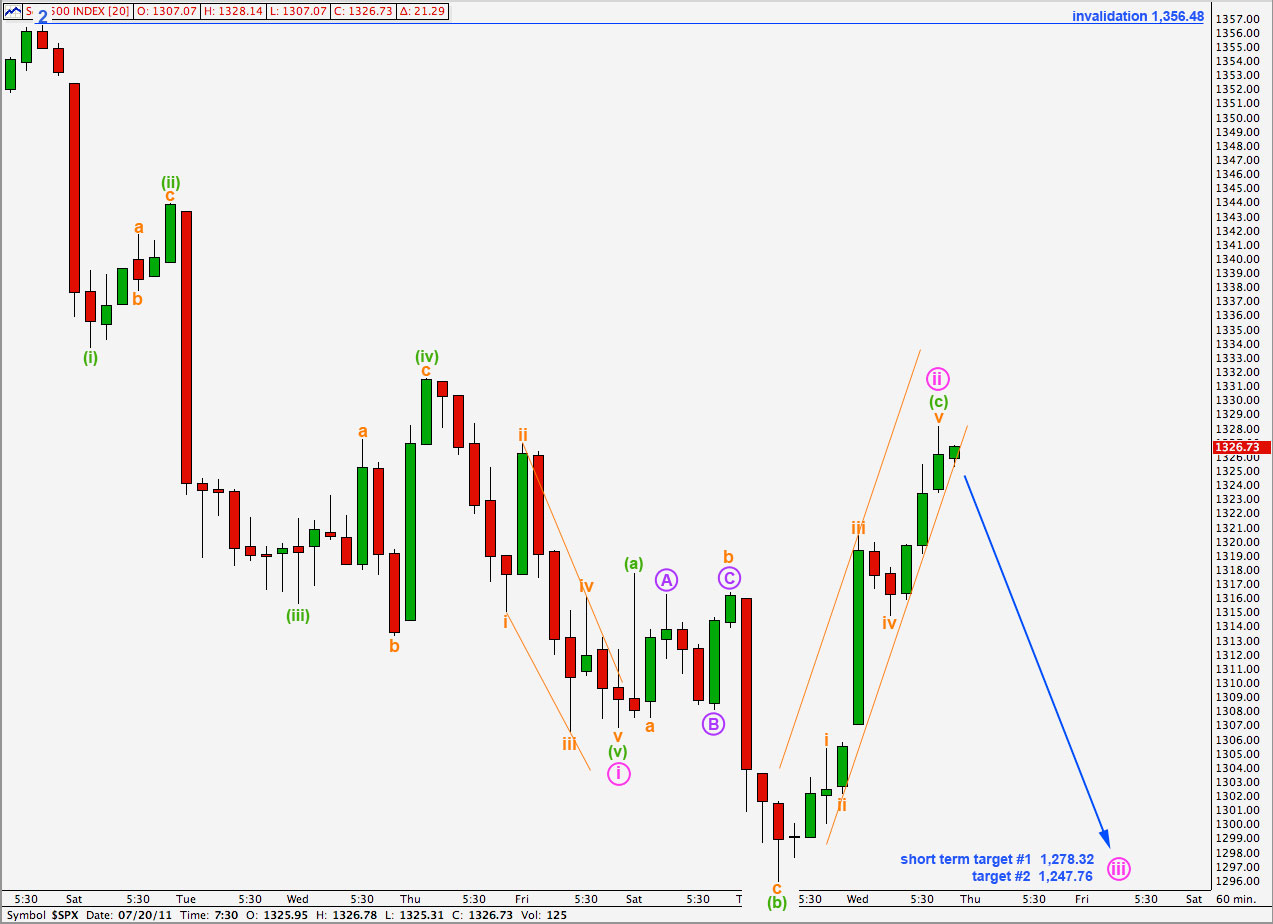
After a few failed attempts I have finally seen a wave count where all rules are met, many guidelines are adhered to, and most importantly the subdivisions fit.
Wave i pink is counted here the same as previously.
Wave ii pink is an expanded flat correction. Wave (b) green within it is just short of twice the length of wave (a) green and wave (c) green is 3.68 points longer than 2.618 the length of wave (a) green.
Wave ii pink is a shallow 43% correction of wave i pink and is now much better proportioned to wave i pink than our prior count.
Wave (c) green is a complete five wave impulse structure; each subdivision can be seen as complete on the 5 minute chart.
Ratios within wave (c) green are: wave iii orange has no Fibonacci ratio to wave i orange and wave v orange is 1.52 points longer than 0.618 the length of wave iii orange.
This wave count resolves the problem that yesterday’s count had of a truncated C wave within wave ii pink (labeled here C purple to end b orange).
We may draw a best fit trend channel about yesterday’s upwards movement. When this channel is breached by downwards movement we will have the first indication that the trend has changed. For this wave count the next downwards movement should be a strong third wave.
Wave ii pink, if wave (c) green extends higher, may not move beyond the start of wave i pink. This wave count is invalidated with movement above 1,356.48.
Alternate Wave Count.
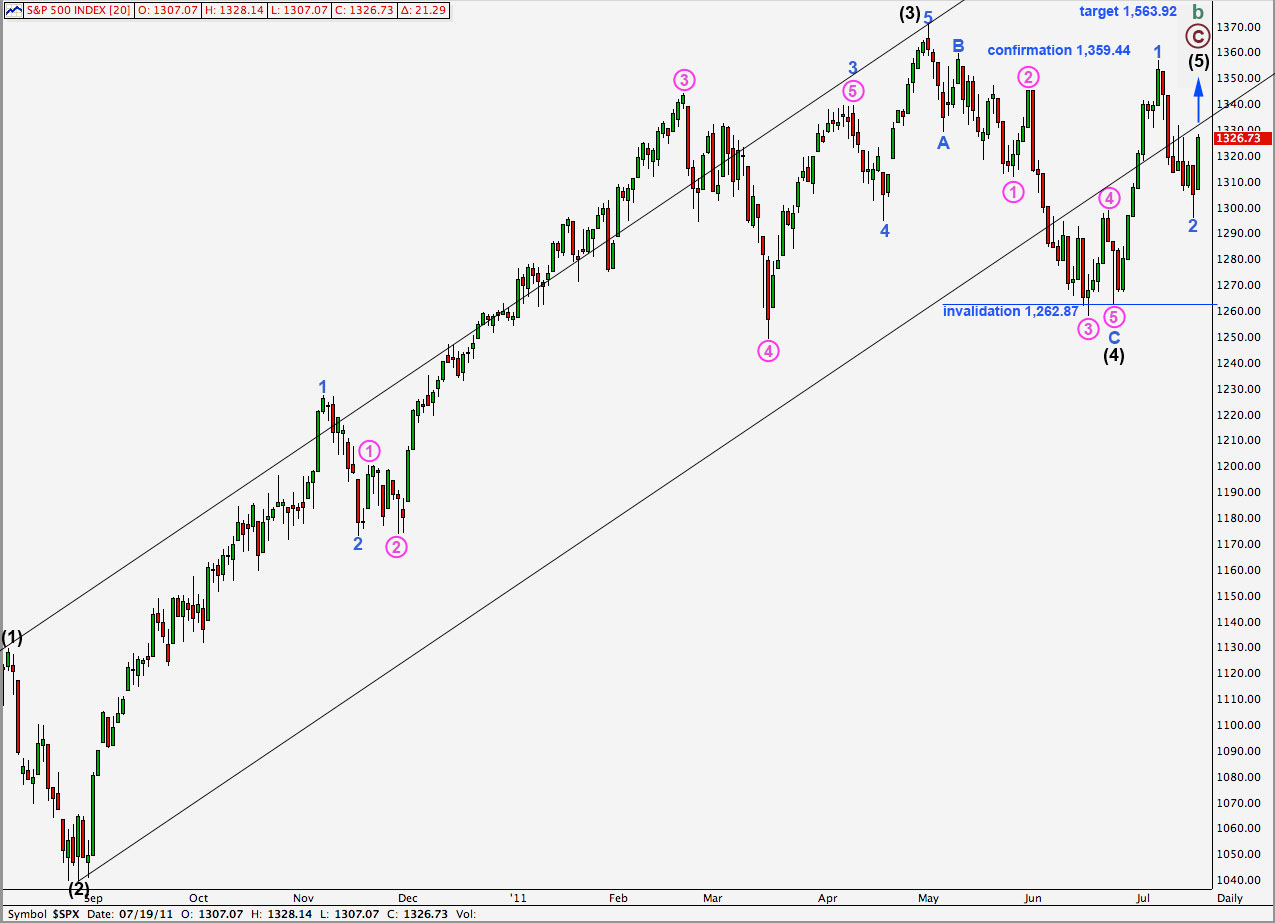
This wave count remains less likely than the main wave count because the problems with it at minute (pink) degree to intermediate (black) degree here on the daily chart are greater.
Positives for this wave count:
– we can see cycle wave A as a three wave structure and expect upwards movement for cycle wave B to reach at least to 1,494.15 where it will be 90% the length of cycle wave A.
– the problem of how to see the last piece of upwards movement to end black wave 3 is completely resolved.
– recent wave behaviour fits expectations for this wave count.
– with a new all time high possible for this wave count it fits with other indices which have made new all time highs.
Negatives for this wave count:
– wave 4 pink within wave 3 blue within wave 3 black is out of proportion to other corrections of a higher wave degree; it is too large.
– it does not have as good a fit within its trend channel as the main wave count does.
Wave 2 blue may not move beyond the start of wave 1 blue. This wave count is invalidated with movement below 1,262.87.
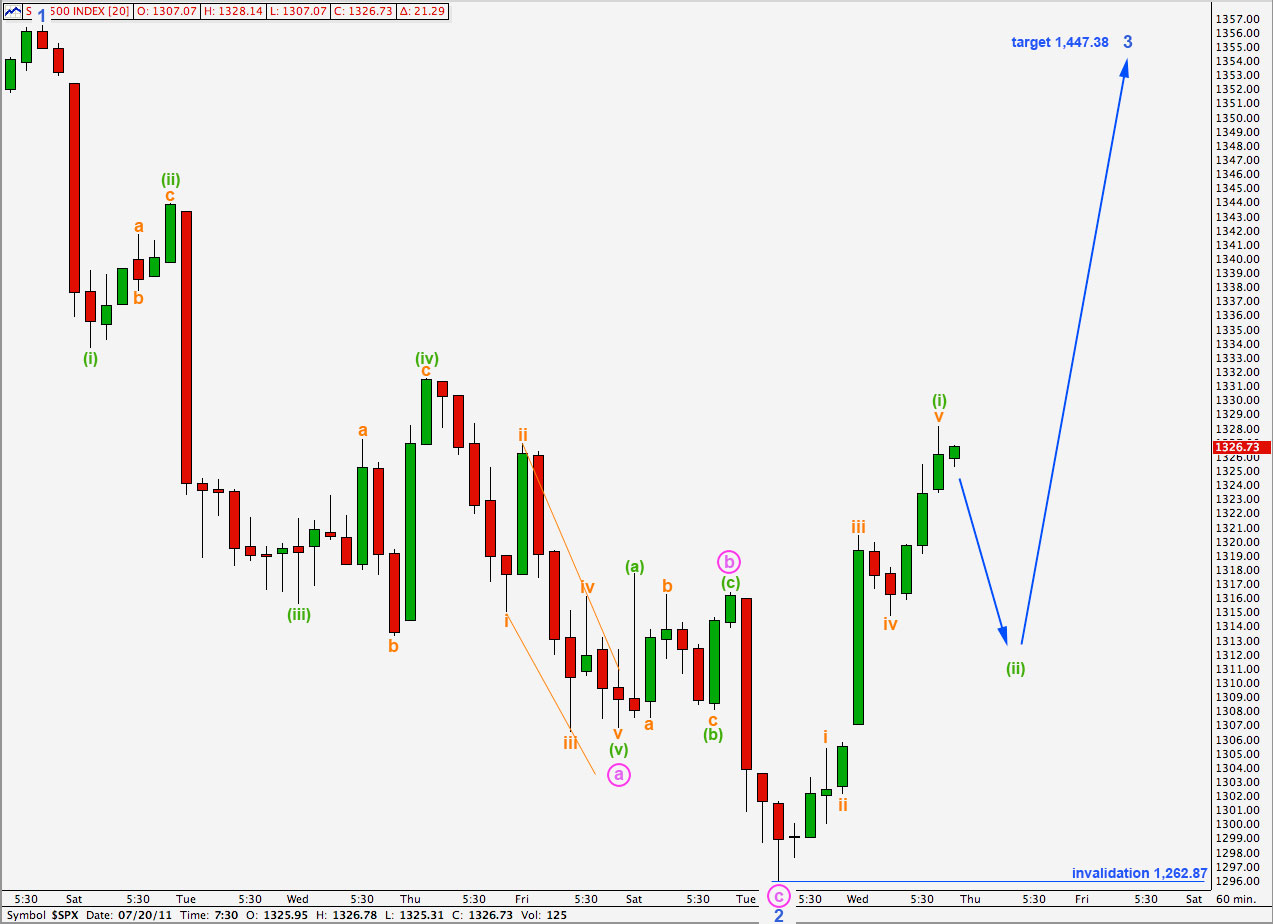
We have the first five wave up structure on the hourly chart for wave 3 blue. Wave (i) green is complete.
Wave (ii) green may not move beyond the start of wave (i) green. This wave count is invalidated with movement below 1,262.87.
At 1,447.38 wave 3 blue will reach 1.618 the length of wave 1 blue. This remains our target for upwards movement to end. This target may be about 2 weeks away.