
Elliott Wave chart analysis for the S&P 500 for 15th July, 2011. Please click on the charts below to enlarge.
I have changed labeling again to be in line with the notation used in Frost and Prechter’s “Elliott Wave Principle” (page 27). I have kept our original colour scheme. You will find an updated wave notation file here. This change should assist several or our members who are colour blind. Please let me know how you find this new system.
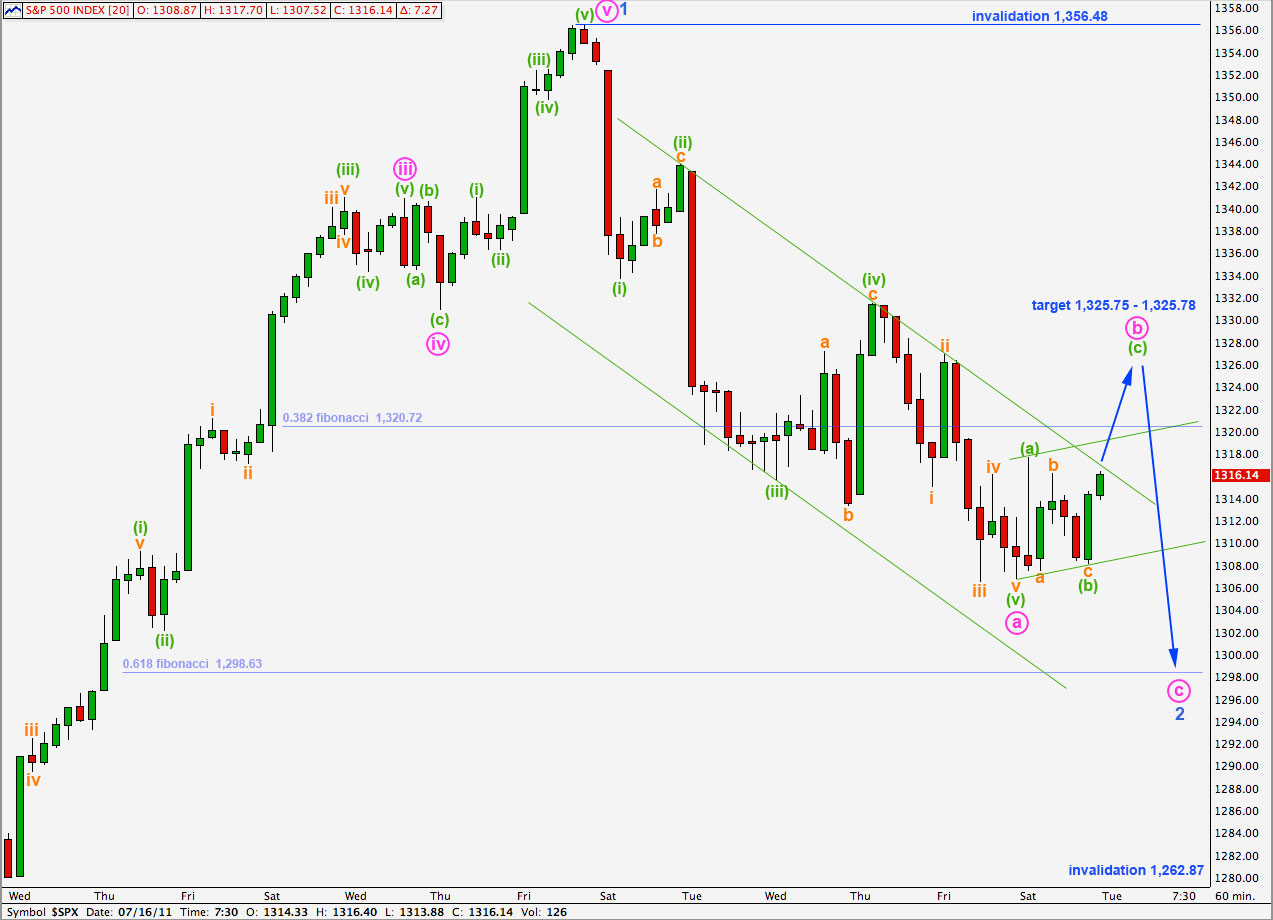
Main Wave Count.

We did not get the small amount of downwards movement we were expecting yesterday. Price moved mostly sideways which may be the correction we were looking out for.
Looking back on the hourly chart at movement about the end of wave 1 blue shows it may have ended at 1,261.90. If wave 2 blue begins here then wave a pink is a three and wave b pink is a 97% correction of wave a pink meeting rules for a flat correction. Wave c pink is just 2.5 points short of 2.618 the length of wave a pink.
This alters the target calculation for wave 3 blue. At 1,198.66 wave 3 blue would reach 1.618 the length of wave 1 blue. This mid term target may now be about 3 weeks away.
Positives for this wave count:
– it has a good fit in its trend channel.
– within primary wave C the proportions of black and blue waves look good.
– it explains the strong trend channel breach with recent downwards movement.
Negatives for this wave count:
– within the ending diagonal of wave 5 black it must see waves 1 and 3 blue as zigzags and this is stretching credulity a bit.
– I would have expected cycle B to reach 90% of cycle A at 1,494.15 because cycle A is most easily seen as a three wave structure, so this would be a super cycle flat correction.
Wave 2 blue may not move beyond the start of wave 1 blue. This wave count is invalidated with movement above 1,359.44.
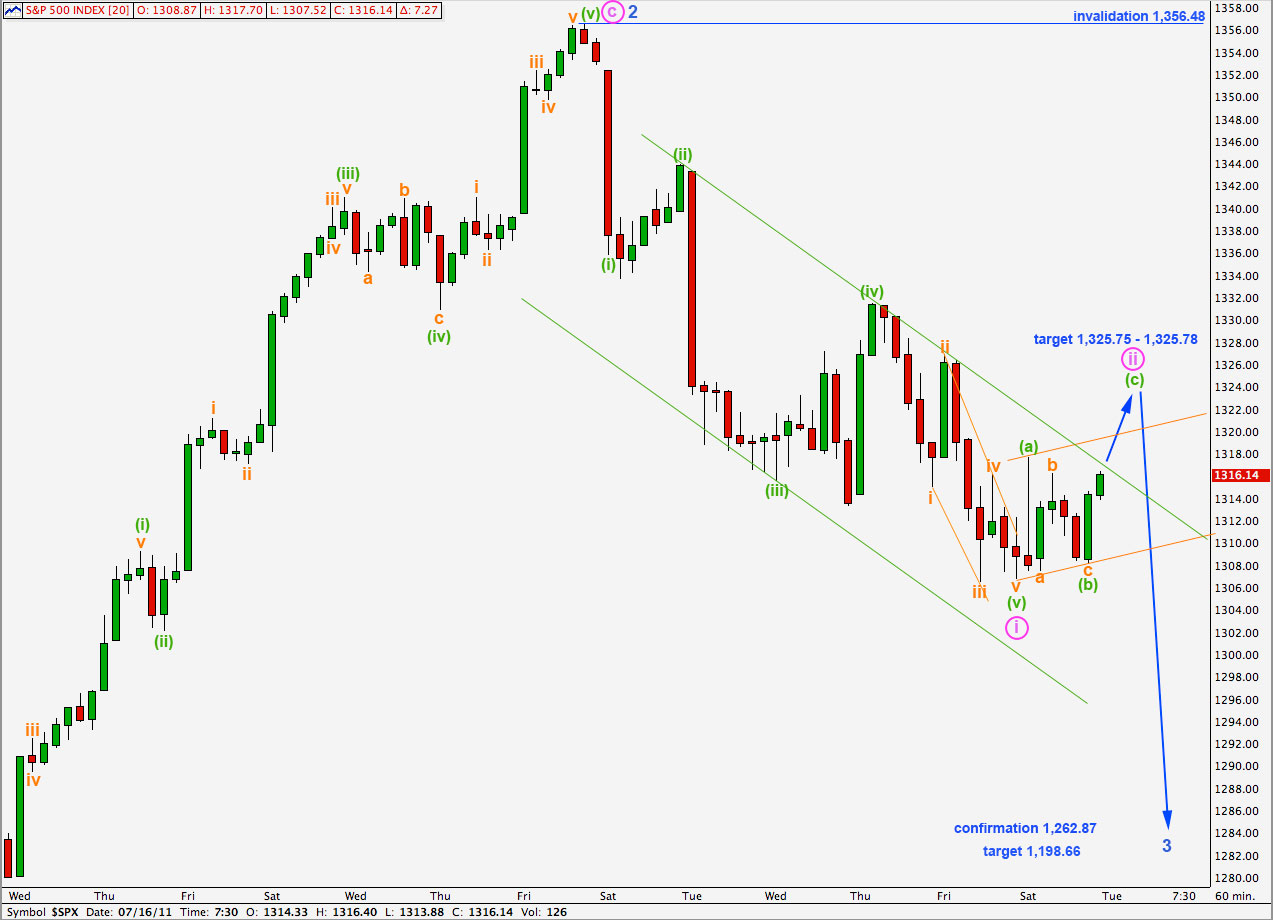
I have moved the degree of labeling for recent downwards movement all up one degree.
Wave (v) green was expected to end a little lower and this did not happen. It may have been slightly truncated.
Ratios within wave i pink are: wave (iii) green has no Fibonacci ratio to wave (i) green and wave (v) green is just 1.91 points longer than equality with wave (i) green.
At 1,325.75 wave (c) green will reach 1.618 the length of wave (a) green. This would see wave ii pink ending about the 0.382 Fibonacci ratio of 1,325.78.
We would expect wave ii pink to breach the parallel channel containing wave i downwards.
When wave (c) green ends wave ii pink we should see the small upwards sloping parallel channel containing wave ii pink breached to the downside. At that point we may expect that wave iii pink is underway.
Wave ii pink may not move beyond the start of wave i pink. This wave count is invalidated with movement above 1,356.48.
Alternate Wave Count.
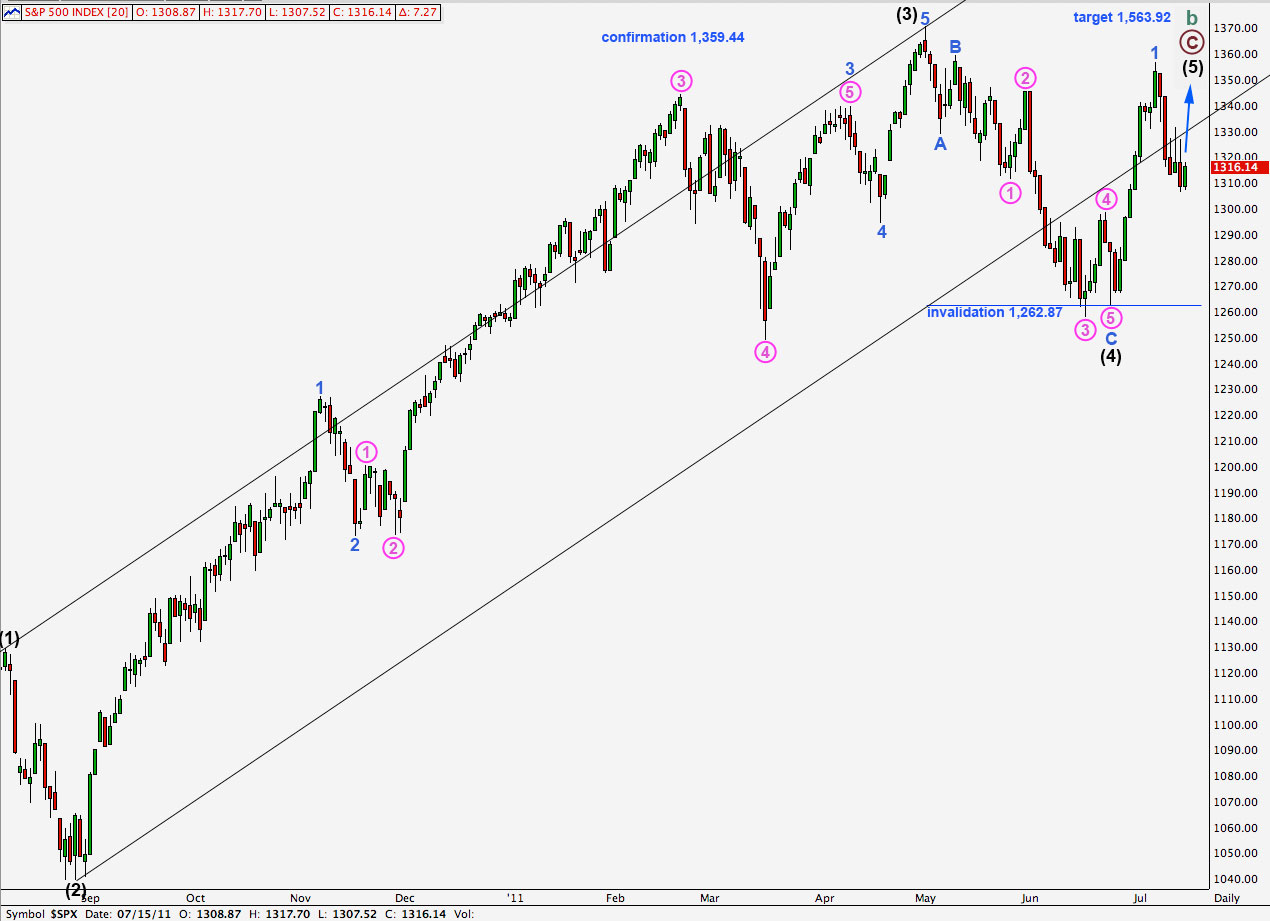
If price breaks above 1,359.44 then we shall expect overall upwards movement for another month or few to about 1,563.92 where primary wave C would reach equality with primary wave A within this cycle degree b zigzag.
Positives for this wave count:
– recent upwards movement labeled 1 blue fits very well and has the right look on the hourly chart.
– we can see cycle wave A as a three wave structure and expect upwards movement for cycle wave B to reach at least to 1,494.15 where it will be 90% the length of cycle wave A.
– the problem of how to see the last piece of upwards movement to end black wave 3 is completely resolved.
– so far recent downwards movement is not behaving completely according to expectations for the main hourly wave count and may fit this wave count better
Negatives for this wave count:
– wave 4 pink within wave 3 blue within wave 3 black is out of proportion to other corrections of a higher wave degree; it is too large.
– it does not have as good a fit within its trend channel as the main wave count does.
This wave count expects the same movement next as the main wave count because 1-2-3 and A-B-C have the same subdivisions and behaviour.
Downwards movement so far is not quite as strong as we would expect for the main wave count and so wave behaviour at this stage fits this alternate slightly better.
If, however, the next wave downwards develops with increased momentum it may be a third wave.
Wave 2 blue may not move beyond the start of wave 1 blue. This wave count is invalidated with movement below 1,262.87.
We may also have to consider that the labeling about the end of wave 1 blue should be as it now is for the main wave count. This would move the invalidation point down to 1,258.07.