
Elliott Wave chart analysis for the S&P 500 for 14th July, 2011. Please click on the charts below to enlarge.
Main Wave Count.
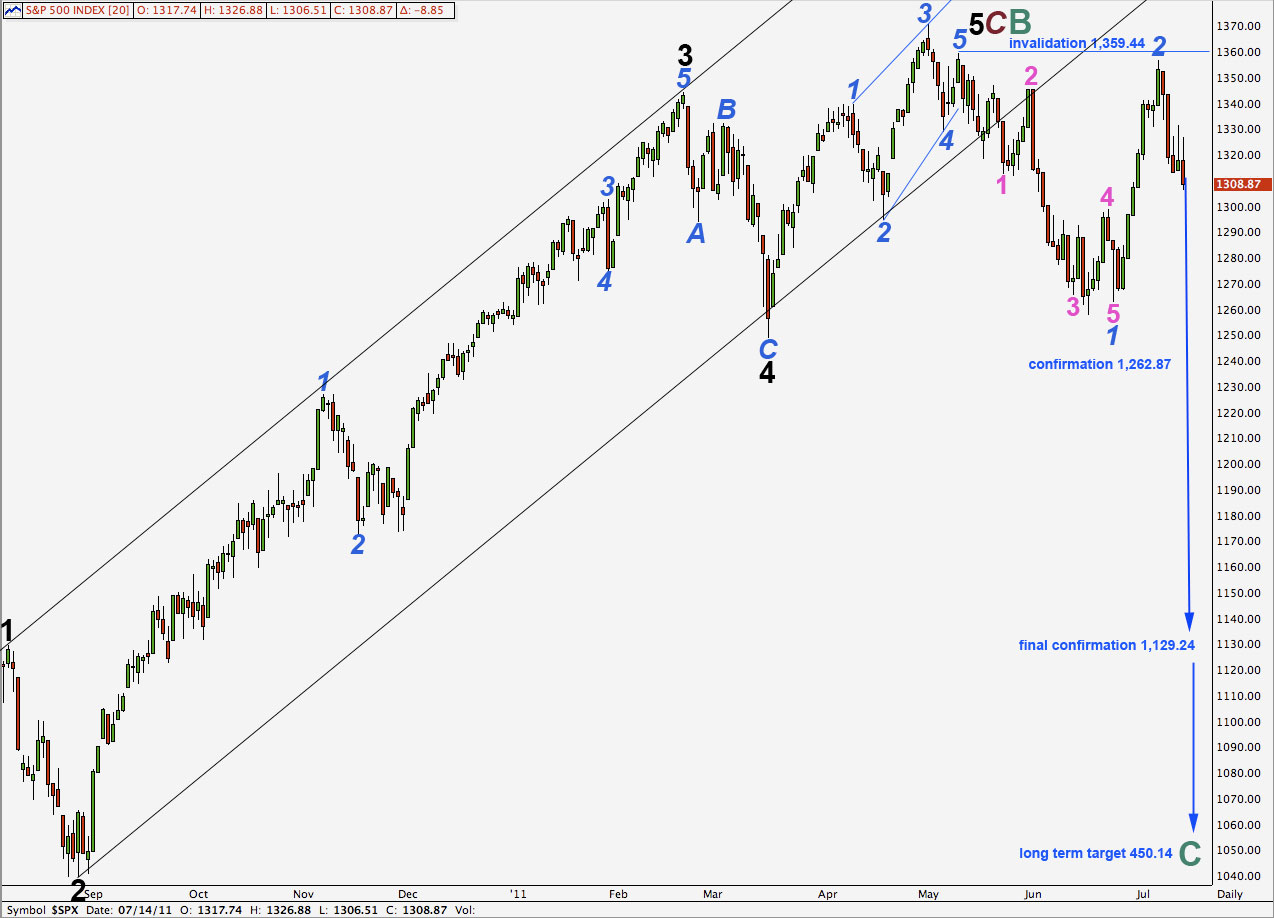
The S&P has behaved as expected, moving lower to reach 2.2 points below our target calculated on the hourly chart.
We should expect a small amount of downwards movement to begin tomorrow before a short term trend change for an upwards correction.
Positives for this wave count:
– it has a good fit in its trend channel.
– within primary wave C the proportions of black and blue waves look good.
– it explains the strong trend channel breach with recent downwards movement.
Negatives for this wave count:
– within the ending diagonal of wave 5 black it must see waves 1 and 3 blue as zigzags and this is stretching credulity a bit.
– wave 2 blue does not have a very clear three wave look on the daily chart and on the hourly chart this movement looks wrong as a zigzag.
– I would have expected cycle B to reach 90% of cycle A at 1,494.15 because cycle A is most easily seen as a three wave structure, so this would be a super cycle flat correction.
Wave 2 blue may not move beyond the start of wave 1 blue. This wave count is invalidated with movement above 1,359.44.
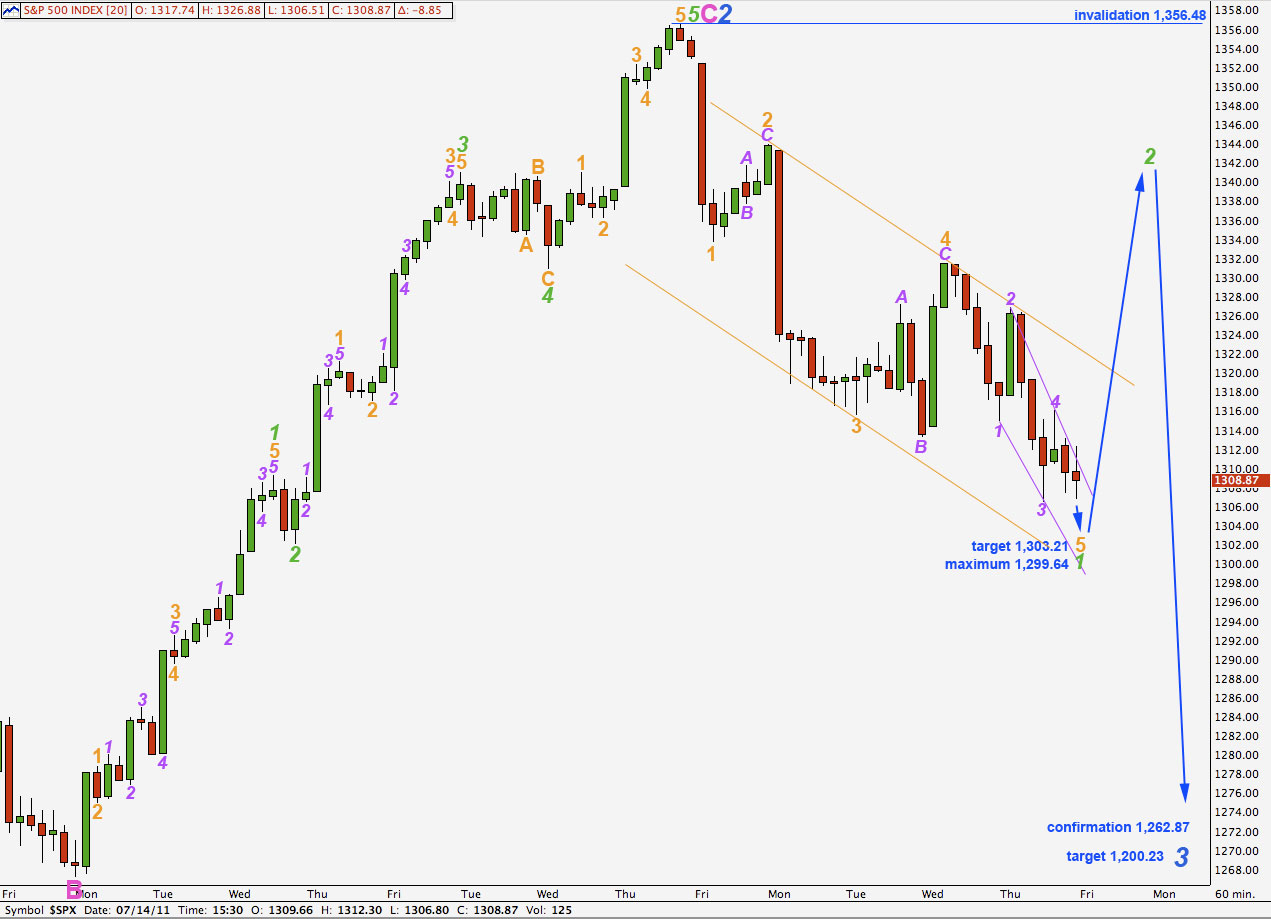
Wave 5 orange downwards is unfolding as an ending contracting diagonal, albeit with a third wave which is the longest. When this movement is viewed on a 15 minute chart each of these waves 1,2,3,and 4 purple can be subdivided into zigzags. Therefore, the main rule for an ending diagonal is met.
Wave 4 purple is shorter than wave 2 purple so the diagonal is contracting. This gives us a maximum level for wave 5 purple at equality with wave 1 purple at 1,299.64.
At 1,303.21 wave 5 orange will reach equality with wave 3 orange.
When we have a little further downwards movement to end wave 1 green we should expect a short term trend change for a correction for wave 2 green.
Wave 2 green should breach the orange parallel channel containing wave 1 downwards. This will provide confirmation that wave 1 is over and wave 2 is underway.
When we know wave 2 is underway we may draw a Fibonacci retracement along the length of wave 1 green. We may expect wave 2 green to correct most likely to the 0.618 Fibonacci ratio of wave 1 green.
Wave 2 green may not move beyond the start of wave 1 green. This wave count is invalidated with movement above 1,356.48.
Alternate Wave Count.
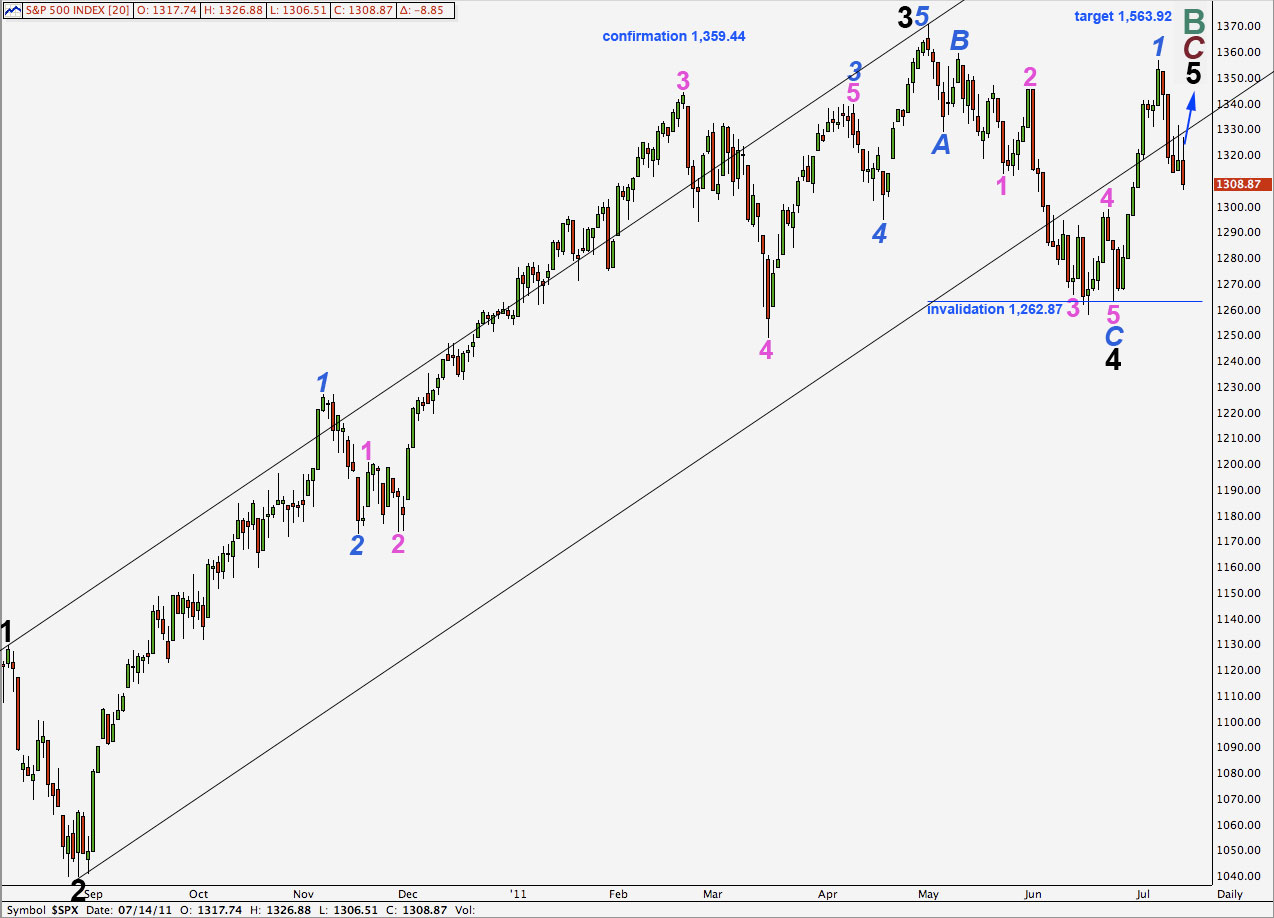
Positives for this wave count:
– recent upwards movement labeled 1 blue fits very well and has the right look on the hourly chart.
– we can see cycle wave A as a three wave structure and expect upwards movement for cycle wave B to reach at least to 1,494.15 where it will be 90% the length of cycle wave A.
– the problem of how to see the last piece of upwards movement to end black wave 3 is completely resolved.
Negatives for this wave count:
– wave 4 pink within wave 3 blue within wave 3 black is out of proportion to other corrections of a higher wave degree; it is too large.
– it does not have as good a fit within its trend channel as the main wave count does.
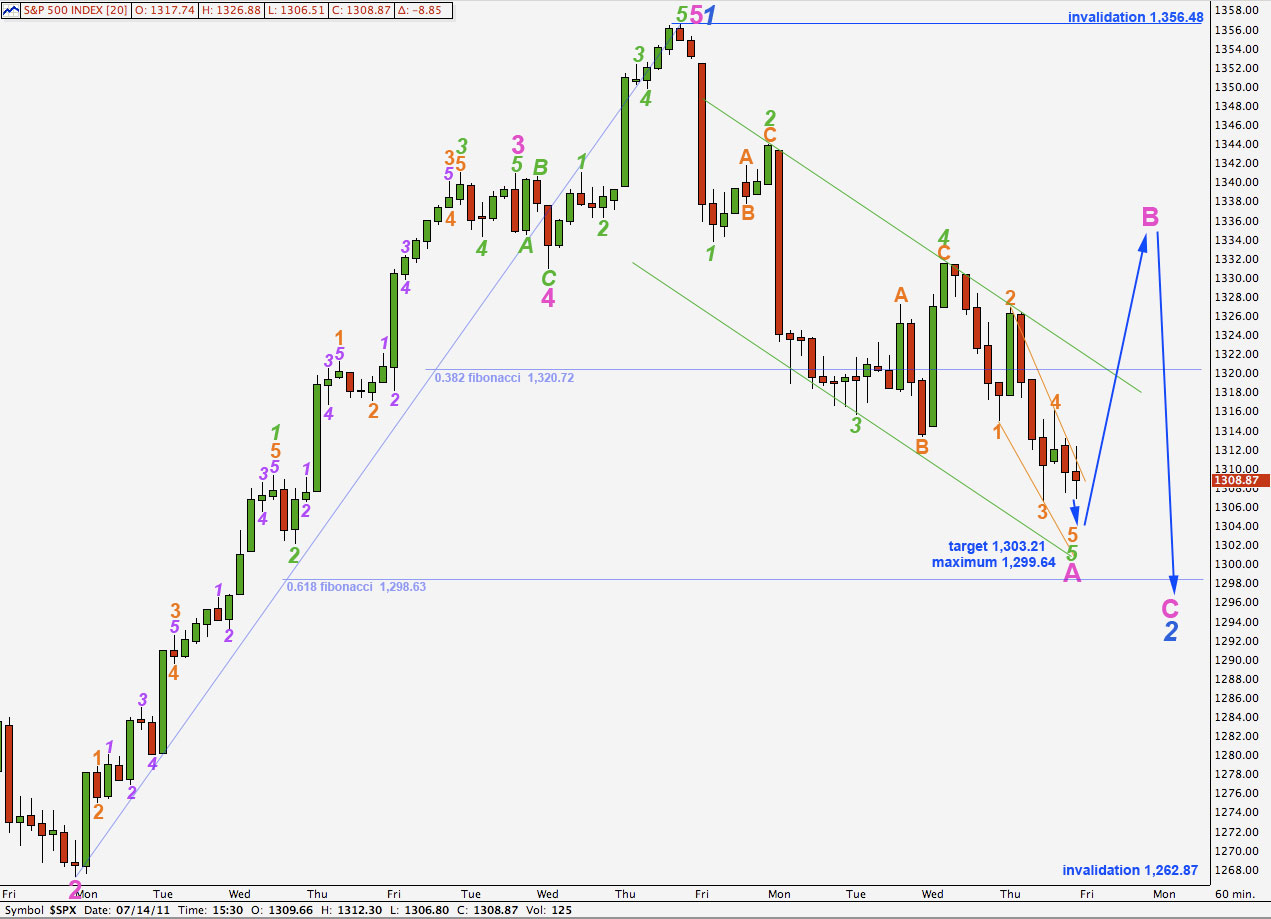
The expectation of next direction is again exactly the same for the main and alternate hourly wave counts. In the short term there is no divergence.
Wave B pink may not move beyond the start of wave A pink. This wave count is invalidated with movement above 1,356.48.
When wave B is complete this wave count expects wave C pink downwards. Wave 2 blue may not move beyond the start of wave 1 blue. This wave count is invalidated with movement below 1,262.87.