
Elliott Wave chart analysis for the S&P 500 for 12th July, 2011. Please click on the charts below to enlarge.
Main Wave Count.
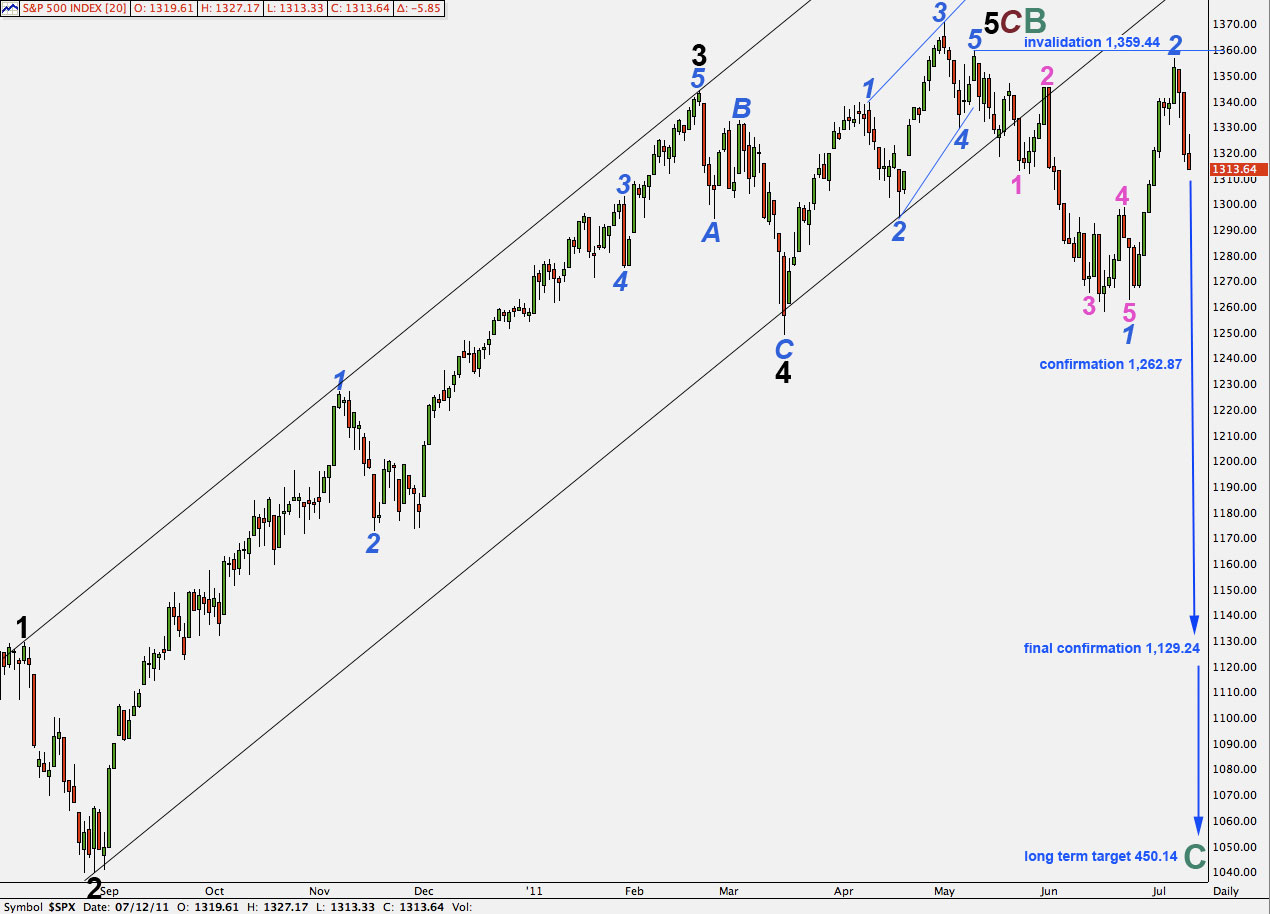
As expected from our two alternate hourly wave counts, we saw a little upwards movement followed by a downwards movement to a new low.
Wave behaviour continues to conform to expectations for this main wave count: strong downwards movement may be a third wave.
Positives for this wave count:
– it has a good fit in its trend channel.
– within primary wave C the proportions of black and blue waves look good.
– it explains the strong trend channel breach with recent downwards movement.
Negatives for this wave count:
– within the ending diagonal of wave 5 black it must see waves 1 and 3 blue as zigzags and this is stretching credulity a bit.
– wave 2 blue does not have a very clear three wave look on the daily chart and on the hourly chart this movement looks wrong as a zigzag.
– I would have expected cycle B to reach 90% of cycle A at 1,494.15 because cycle A is most easily seen as a three wave structure, so this would be a super cycle flat correction.
Wave 2 blue may not move beyond the start of wave 1 blue. This wave count is invalidated with movement above 1,359.44.
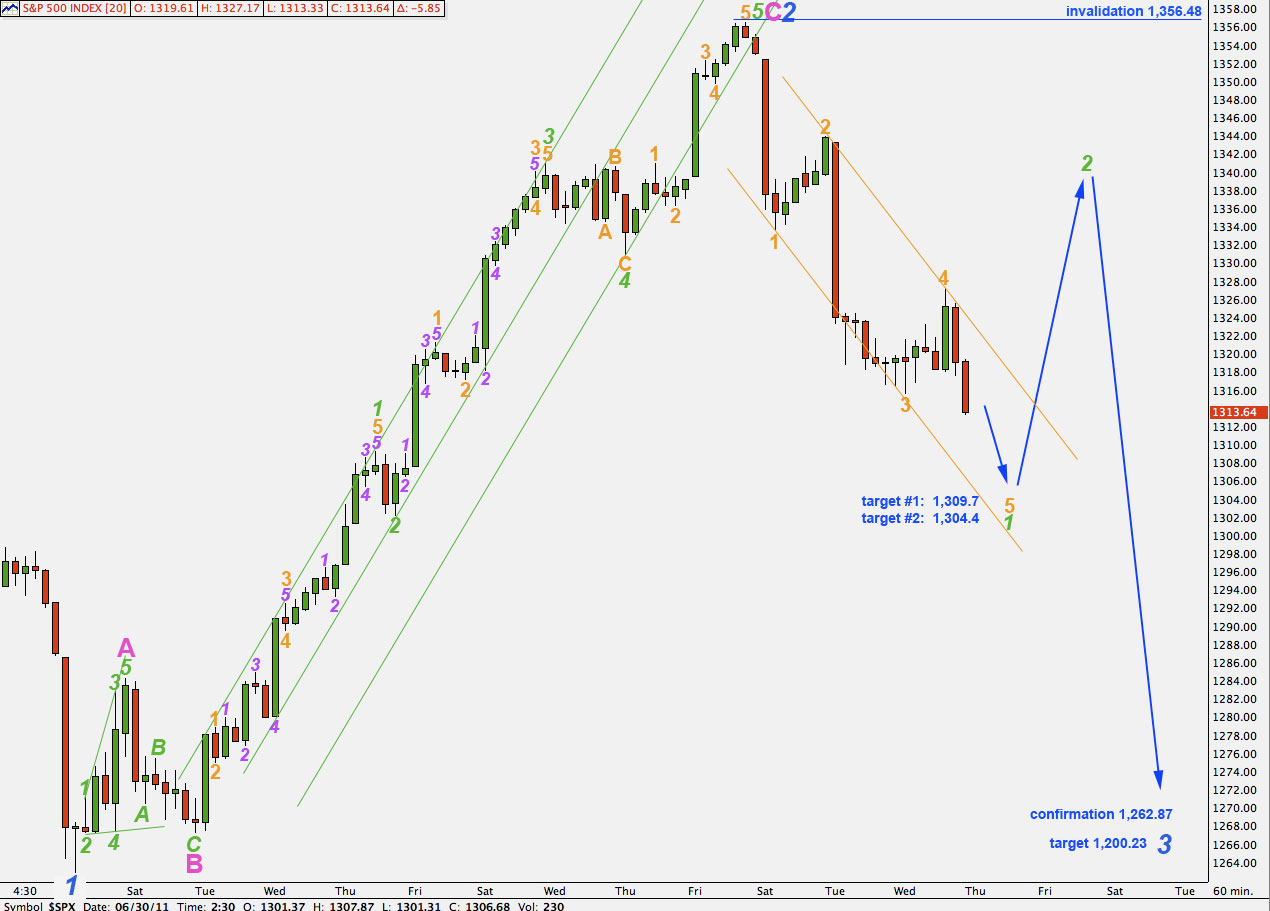
It is likely that wave 2 blue is complete as downwards movement is developing into an impulsive structure. This is what we would expect to see for a third wave.
So far wave 5 orange is unlikely to be complete. Wave 3 orange has no Fibonacci ratio to wave 1 orange and so it is more likely then that wave 5 orange will exhibit a ratio to either 1 or 3.
At 1,309.7 wave 5 orange will reach 0.618 the length of wave 3 orange. At 1,304.4 wave 5 orange will reach equality with wave 1 orange. Downwards movement may end about either one of these targets, with the lower second target being slightly more likely as this is a very common ratio between first and fifth waves.
So far this downwards movement fits perfectly into a trend channel. Wave 5 orange may end either midway in the channel or at the lower edge. When the channel is breached by upwards movement then the impulse for wave 1 green down is complete and the correction for wave 2 green up is underway.
When this fifth wave down is complete we may expect a short term trend change and a second wave correction. This second wave correction could be deep.
Wave 2 green may not move beyond the start of wave 1 green. This wave count is invalidated with movement above 1,356.48.
Alternate Wave Count.
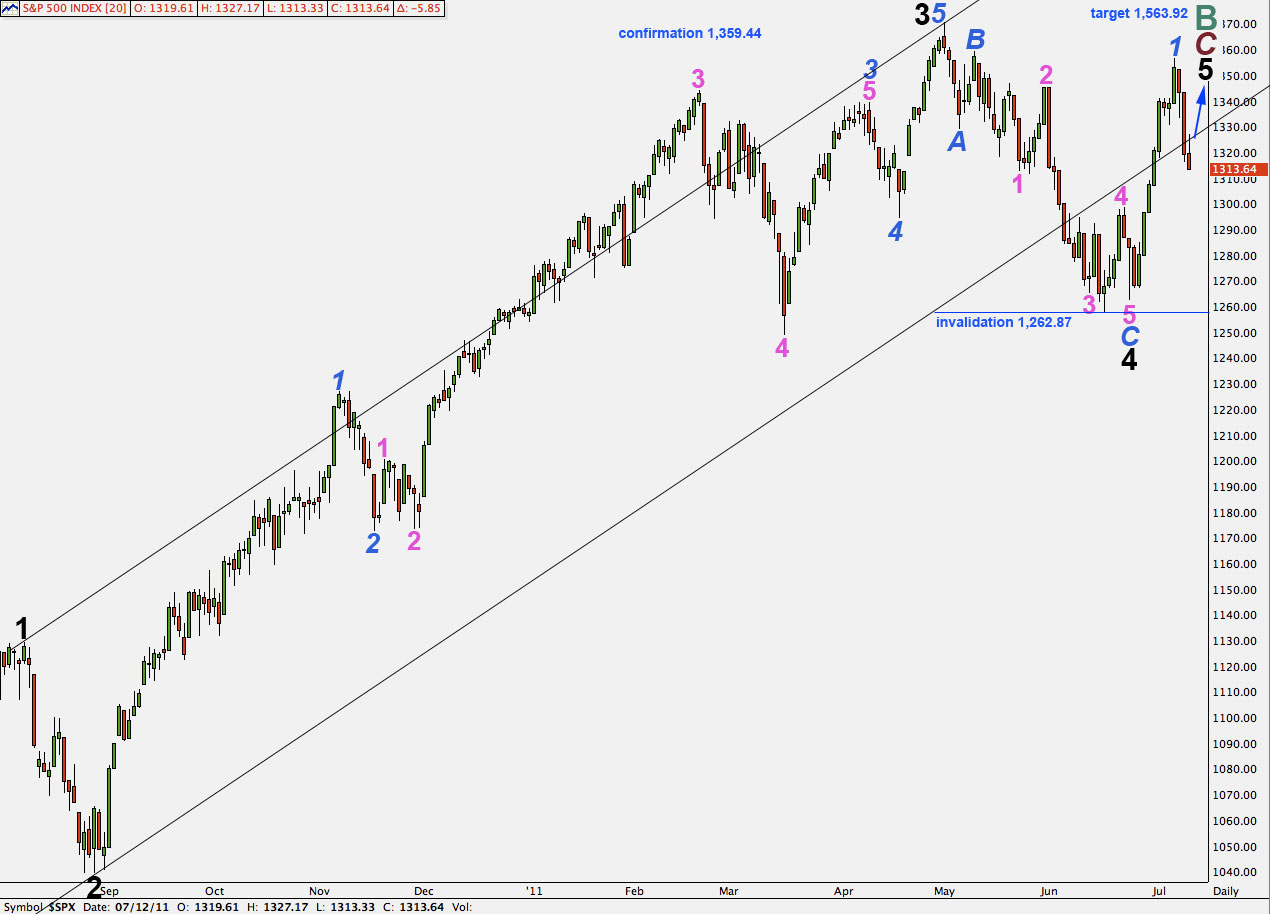
Positives for this wave count:
– upwards movement of the last couple of weeks fits very well and has the right look on the hourly chart.
– we can see cycle wave A as a three wave structure and expect upwards movement for cycle wave B to reach at least to 1,494.15 where it will be 90% the length of cycle wave A.
– the problem of how to see the last piece of upwards movement to end black wave 3 is completely resolved.
Negatives for this wave count:
– wave 4 pink within wave 3 blue within wave 3 black is out of proportion to other corrections of a higher wave degree; it is too large.
– it does not have as good a fit within its trend channel as the main wave count does.
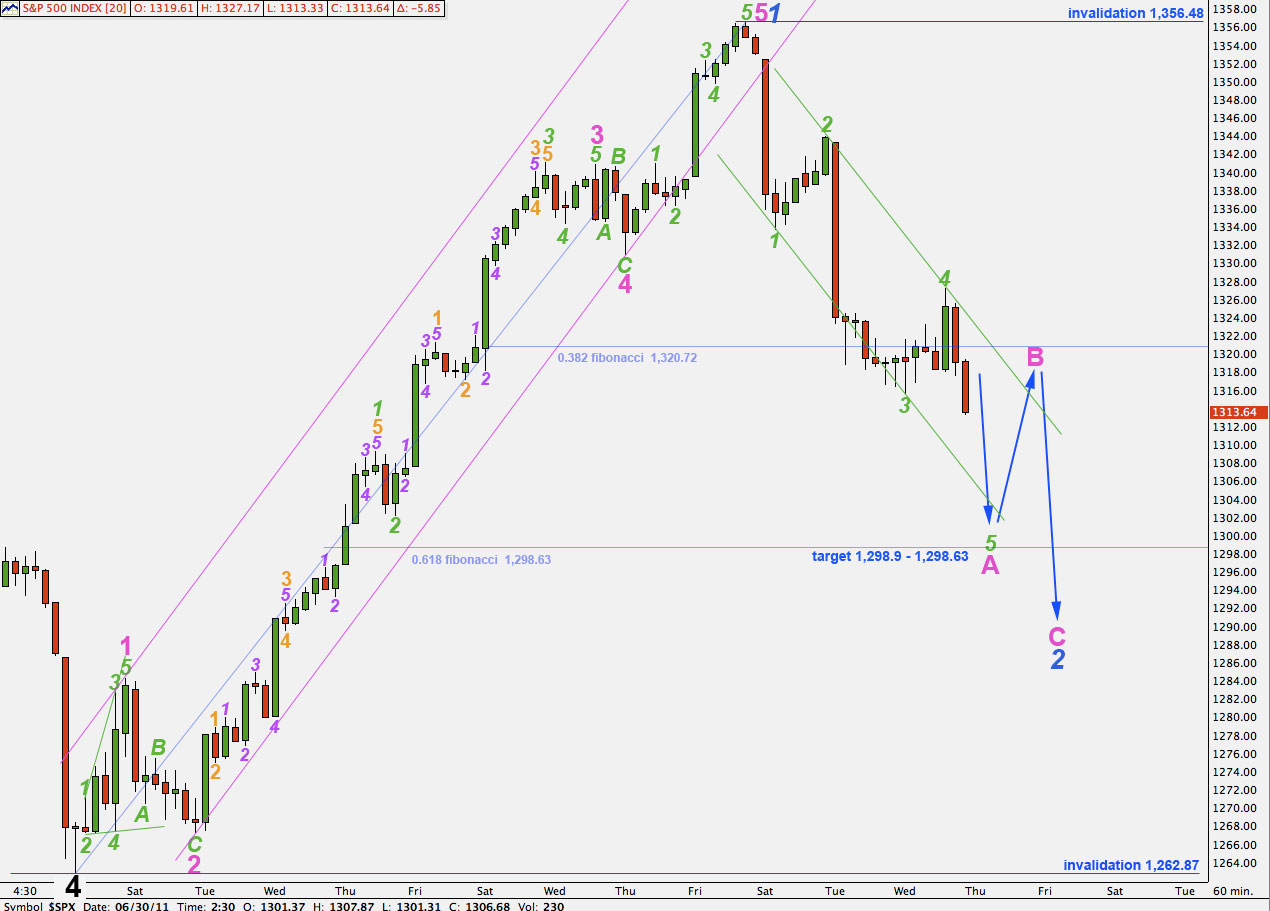
Within wave 2 blue wave A pink is incomplete and requires wave 5 green to complete it.
At 1,298.9 wave 5 green would reach equality with wave 3 green. This is almost at the 0.618 Fibonacci ratio of wave 1 blue at 1,298.63. Downwards movement may end here.
Wave 5 green may end about the lower edge of the trend channel.
When the channel is breached by upwards movement then the impulse for wave A pink is complete and the corrective structure for wave B pink would be underway.
Wave B pink may not move beyond the start of wave A pink. This wave count is invalidated with movement above 1,356.48.
Wave 2 blue may not move beyond the start of wave 1 blue. This wave count is invalidated with movement below 1,262.87.