
Elliott Wave chart analysis for the S&P 500 for 11th July, 2011. Please click on the charts below to enlarge.
Main Wave Count.
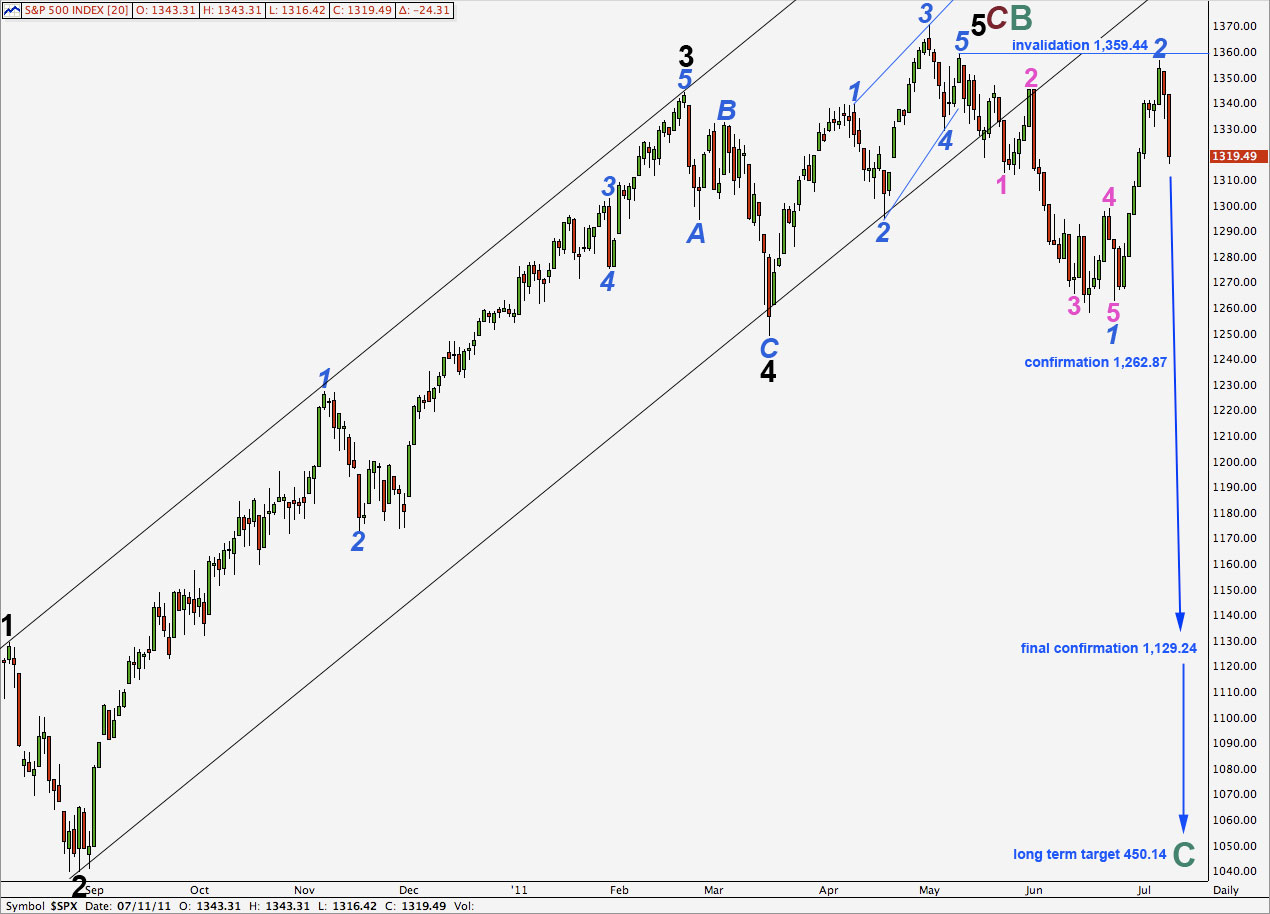
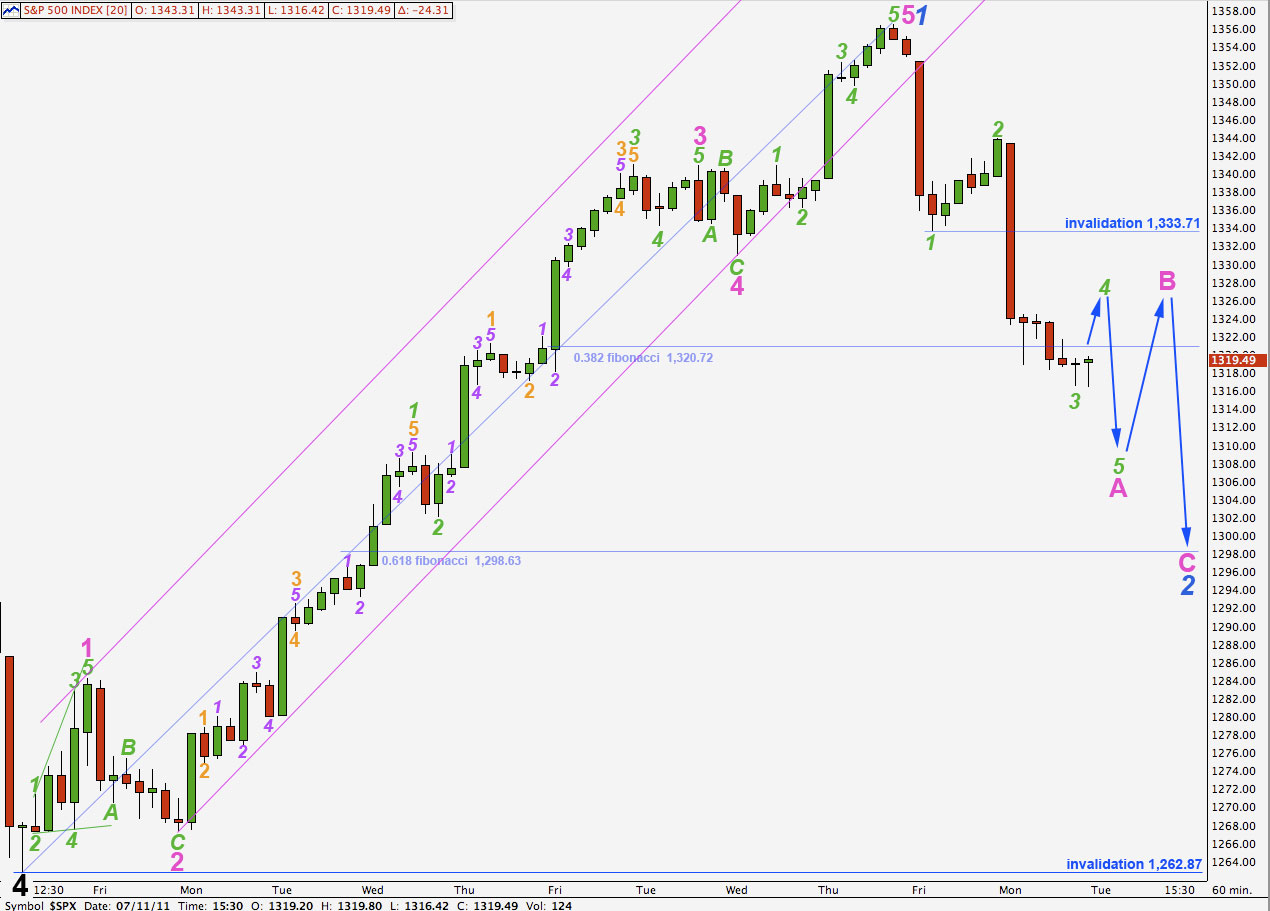
As expected price continued to move lower for Monday’s session. We still have a main and alternate count and, for each of these, there is more than one possibility for the short term. So far wave behaviour conforms to expectations for this wave count: we are seeing strong downwards movement which could be a third wave.
Positives for this wave count:
– it has a good fit in its trend channel.
– within primary wave C the proportions of black and blue waves look good.
– it explains the strong trend channel breach with recent downwards movement.
Negatives for this wave count:
– within the ending diagonal of wave 5 black it must see waves 1 and 3 blue as zigzags and this is stretching credulity a bit.
– wave 2 blue does not have a very clear three wave look on the daily chart and on the hourly chart this movement looks wrong as a zigzag.
– I would have expected cycle B to reach 90% of cycle A at 1,494.15 because cycle A is most easily seen as a three wave structure, so this would be a super cycle flat correction.
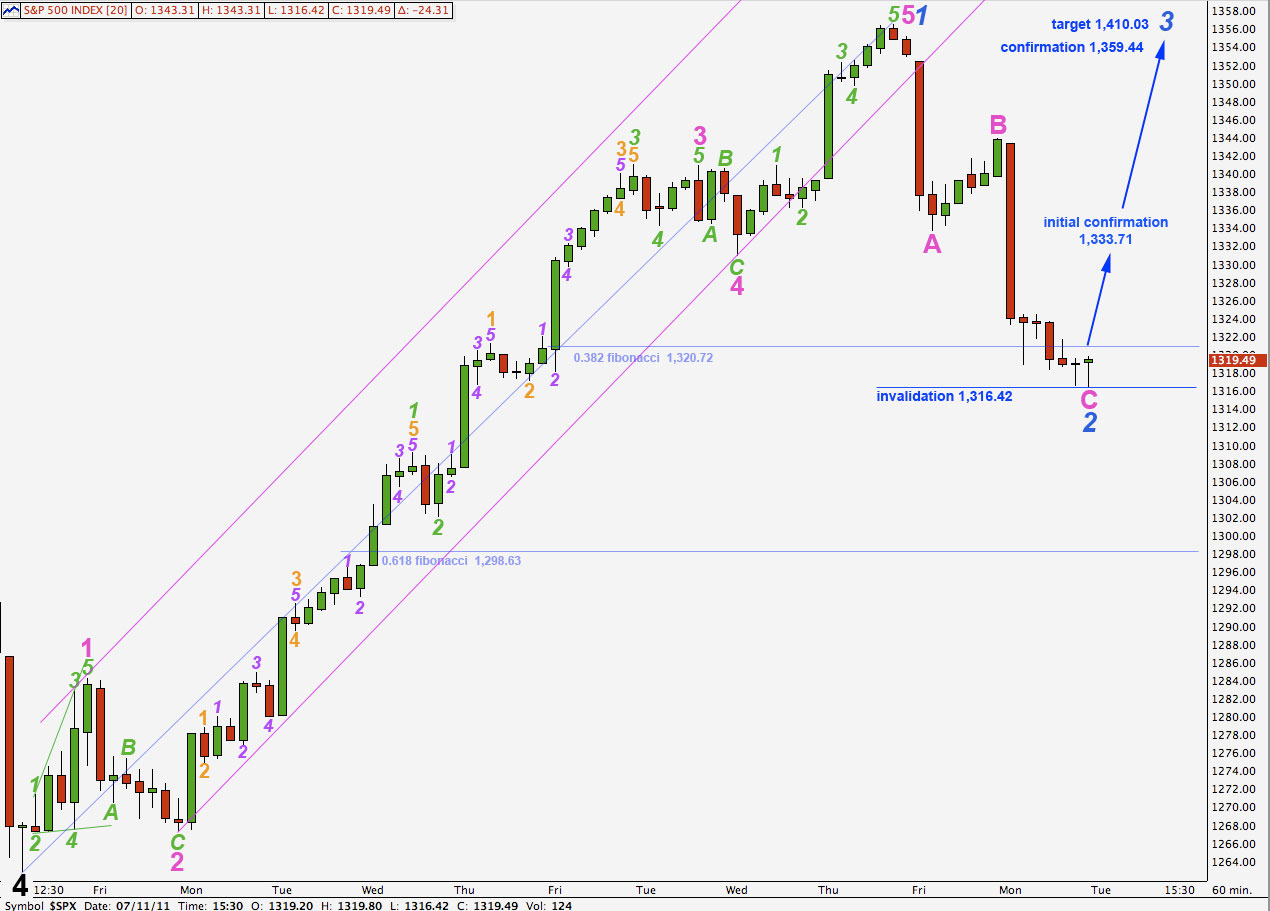
Wave 2 blue may not move beyond the start of wave 1 blue. This wave count is invalidated with movement above 1,359.44.
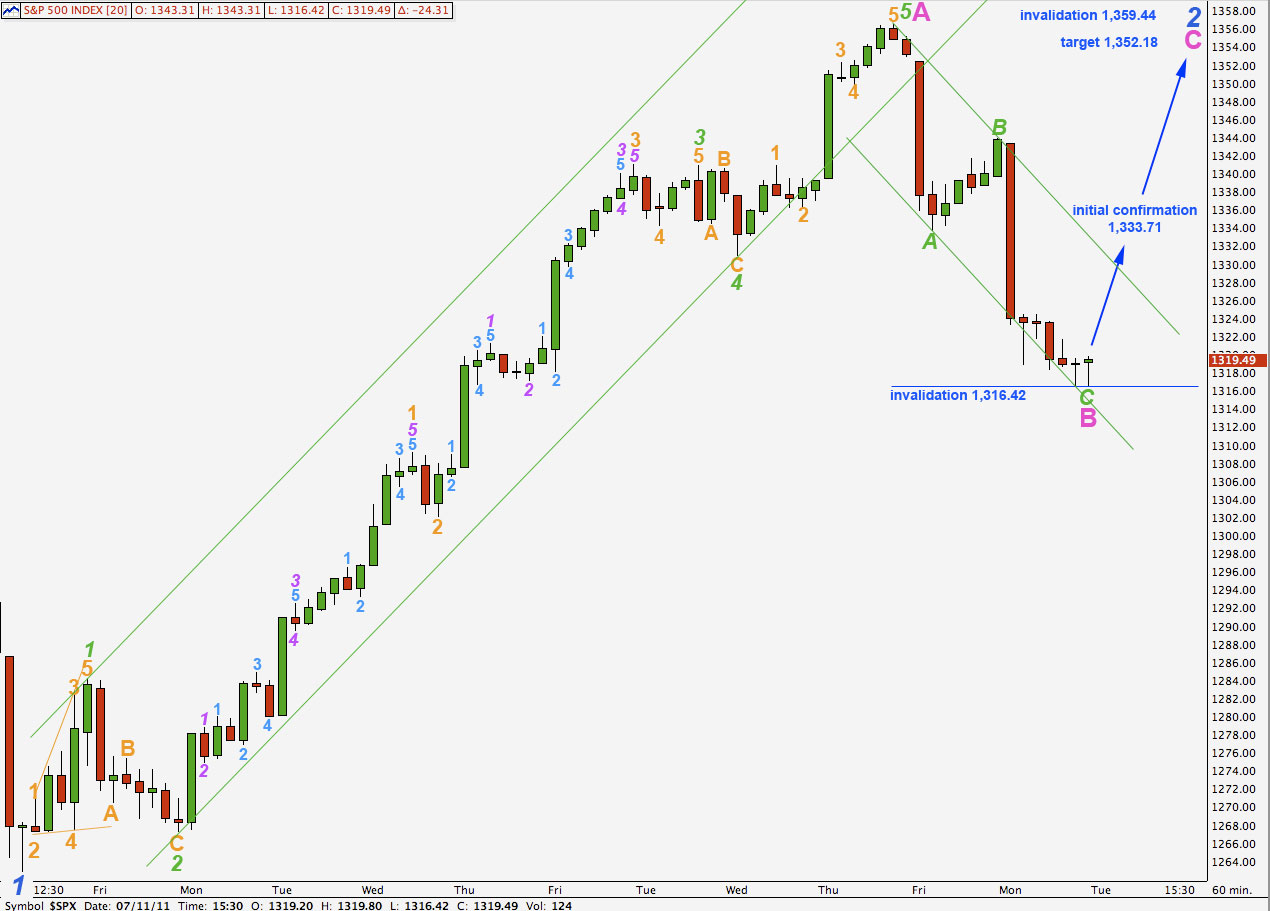
This wave count has a better fit on the hourly chart than how I have previously labeled it as in the chart below. Wave 3 orange has a stronger MACD reading than wave 1 orange, which is what we would expect for a third wave.
We may have seen waves A and B within a zigzag for wave 2 blue only so far. Movement above 1,333.71 would provide some initial confirmation for this wave count.
At 1,352.18 wave C pink will reach 0.382 the length of wave A pink. This would see wave C slightly truncated; it may actually end slightly above the high of wave A pink at 1,356.48 to avoid this and still have an adequate fibonacci ratio.
Wave 2 blue may not move beyond the start of wave 1 blue. This wave count is invalidated with movement above 1,359.44.
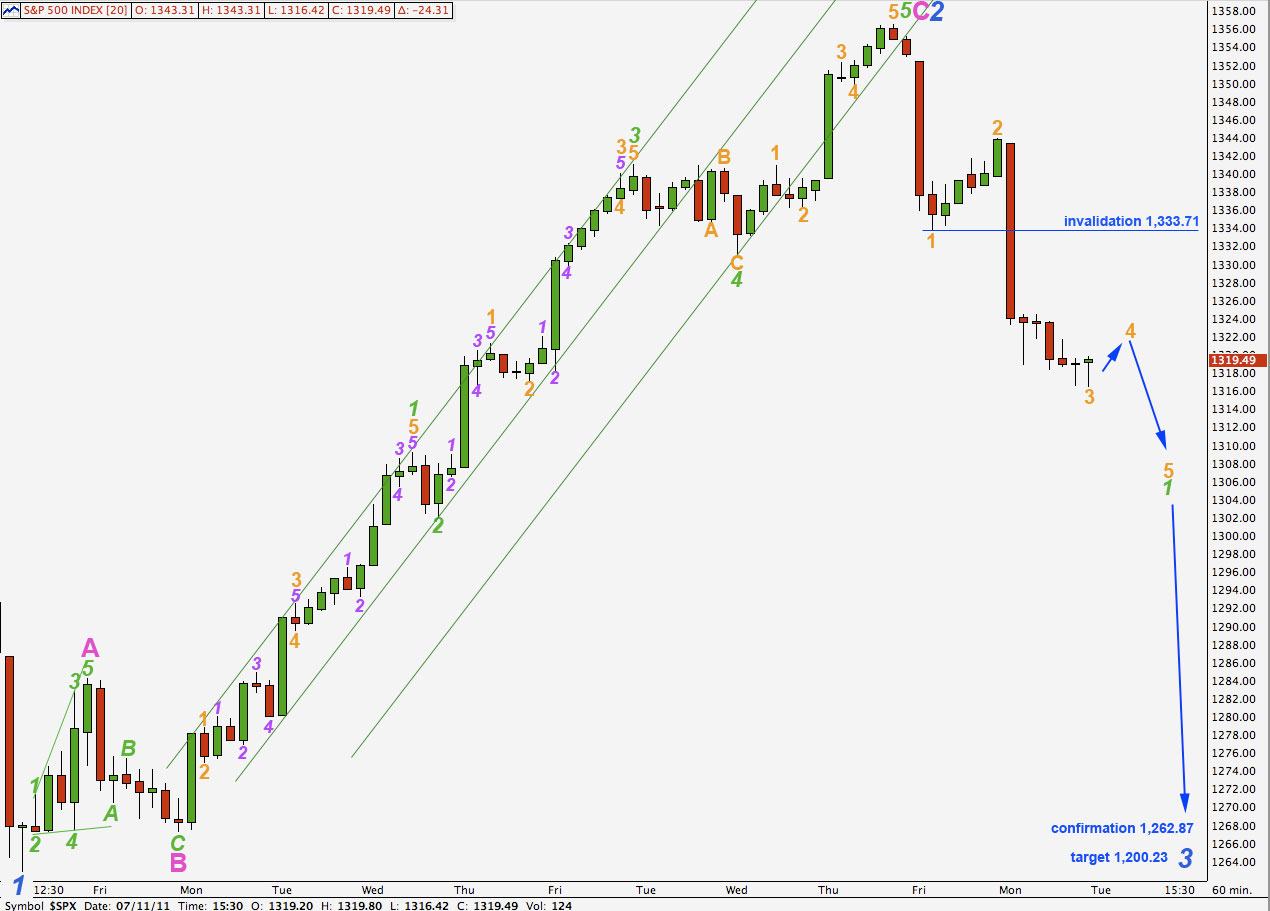
This wave count follows on directly from the last published main hourly wave count.
It is possible to see wave 2 blue as a complete corrective structure. However, on the hourly chart this does not have the right look because it does not fit well into a trend channel.
Movement below 1,262.87 from this point will confirm this wave count. At that stage we may be confident that downwards movement is a third wave.
Wave 4 orange may not move into wave 1 orange price territory. This wave count is invalidated with movement above 1,333.71.
Wave 3 blue will reach 1.618 the length of wave 1 blue at 1,200.23.
Alternate Wave Count.
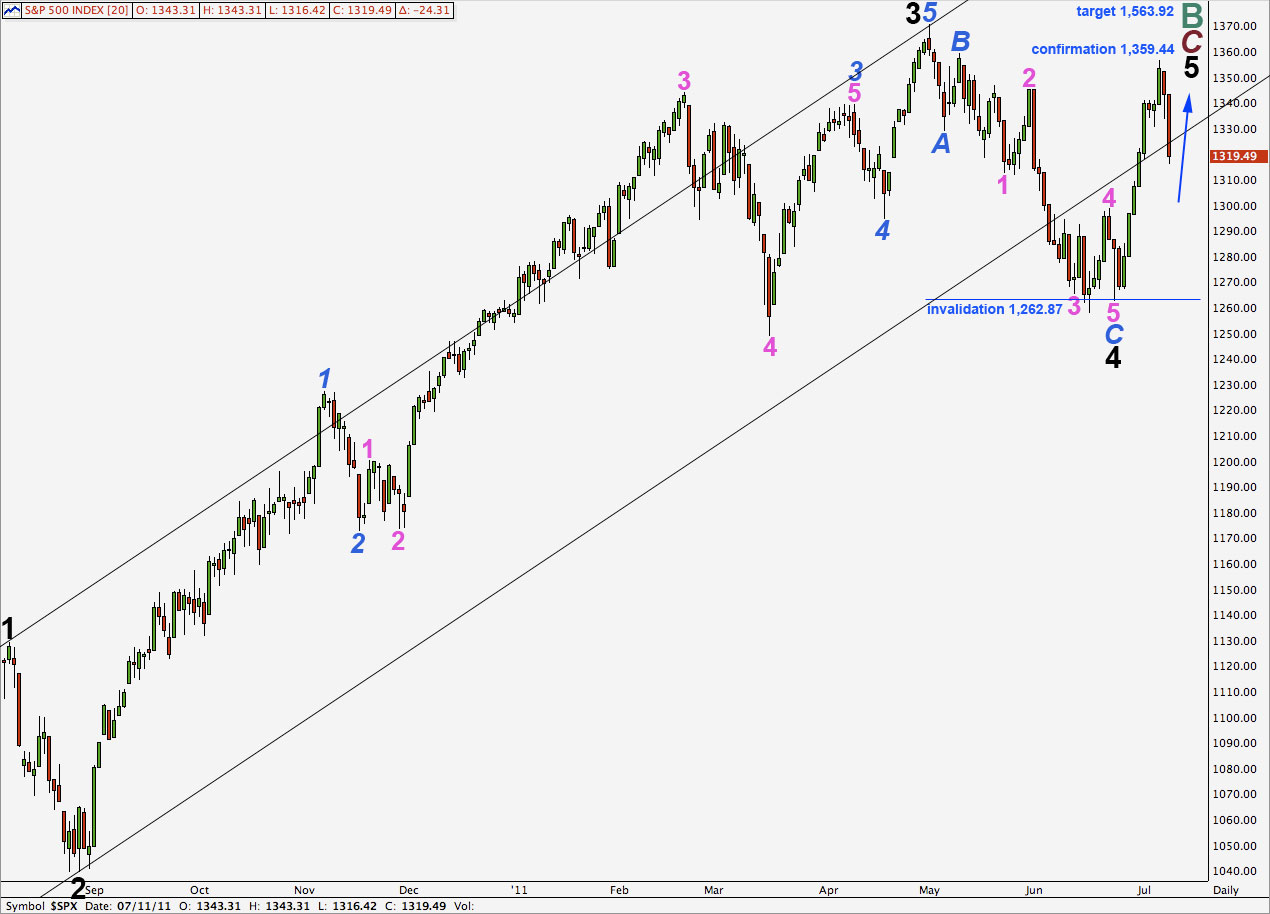
Positives for this wave count:
– upwards movement of the last couple of weeks fits very well and has the right look on the hourly chart.
– we can see cycle wave A as a three wave structure and expect upwards movement for cycle wave B to reach at least to 1,494.15 where it will be 90% the length of cycle wave A.
– the problem of how to see the last piece of upwards movement to end black wave 3 is completely resolved.
Negatives for this wave count:
– wave 4 pink within wave 3 blue within wave 3 black is out of proportion to other corrections of a higher wave degree; it is too large.
– it does not have as good a fit within its trend channel as the main wave count does.
So far downwards movement has a clear three wave structure. If price moves above 1,333.71 then this three wave structure will be confirmed.
Further movement above 1,359.44 would invalidate the main wave count and confirm this alternate. At that stage we may be confident that the S&P 500 is within a third wave upwards.
Wave 3 blue will reach equality with wave 1 blue at 1,410.03.
Wave C pink on a 15 minute chart is a complete five wave structure, and the final fifth wave within it can be seen subdivided also into a clear five. So if this downwards movement is a three then it is highly likely to be over here.
Movement to a new low below 1,316.42 would invalidate this wave count.
If downwards movement develops further into a five from here then it may be wave A pink within a zigzag for wave 2 blue.
Wave 4 green may not move into wave 1 green price territory. This wave count is invalidated with movement above 1,333.71.
When wave A pink is a complete five wave structure then the invalidation point must move up to it’s start at 1,356.48 and we would expect a three upwards for wave B pink.
This may see wave 2 blue ending at our originally expected point about the 0.618 fibonacci ratio of wave 1 blue.
Wave 2 blue may not move beyond the start of wave 1 blue. This wave count is invalidated with movement below 1,262.87.