
Elliott Wave chart analysis for the S&P 500 for 8th July, 2011. Please click on the charts below to enlarge.
Main Wave Count.
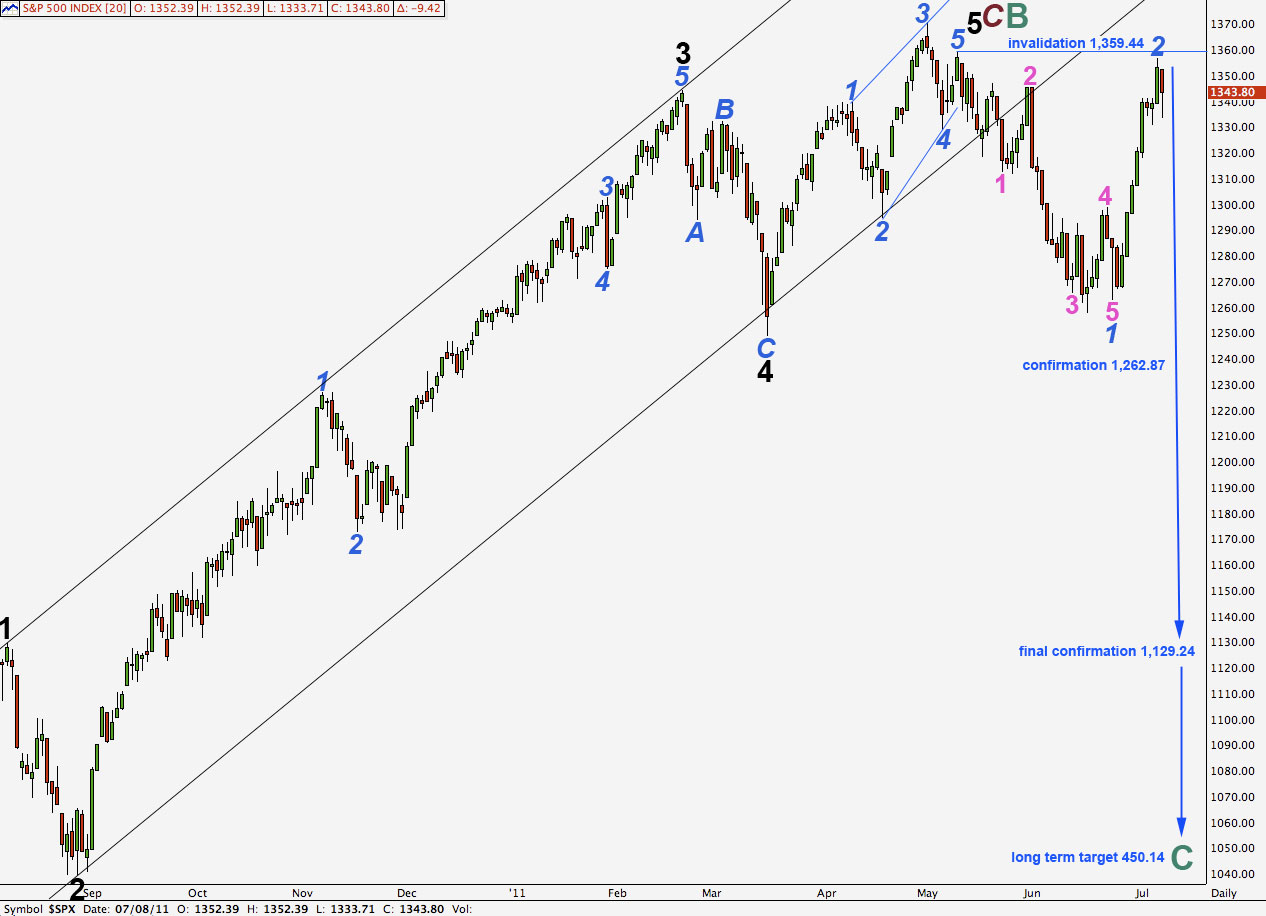
As expected the S&P 500 turned downwards on Friday. Unfortunately, both of our wave counts remain valid and we do not have clarity for the bigger picture, yet.
Positives for this wave count:
– it has a good fit in its trend channel.
– within primary wave C the proportions of black and blue waves look good.
– it explains the strong trend channel breach with recent downwards movement.
Negatives for this wave count:
– within the ending diagonal of wave 5 black it must see waves 1 and 3 blue as zigzags and this is stretching credulity a bit.
– wave 2 blue does not have a very clear three wave look on the daily chart and on the hourly chart this movement looks wrong as a zigzag.
– I would have expected cycle B to reach 90% of cycle A at 1,494.15 because cycle A is most easily seen as a three wave structure, so this would be a super cycle flat correction.
Wave 2 blue may not move beyond the start of wave 1 blue. This wave count is invalidated with movement above 1,359.44.
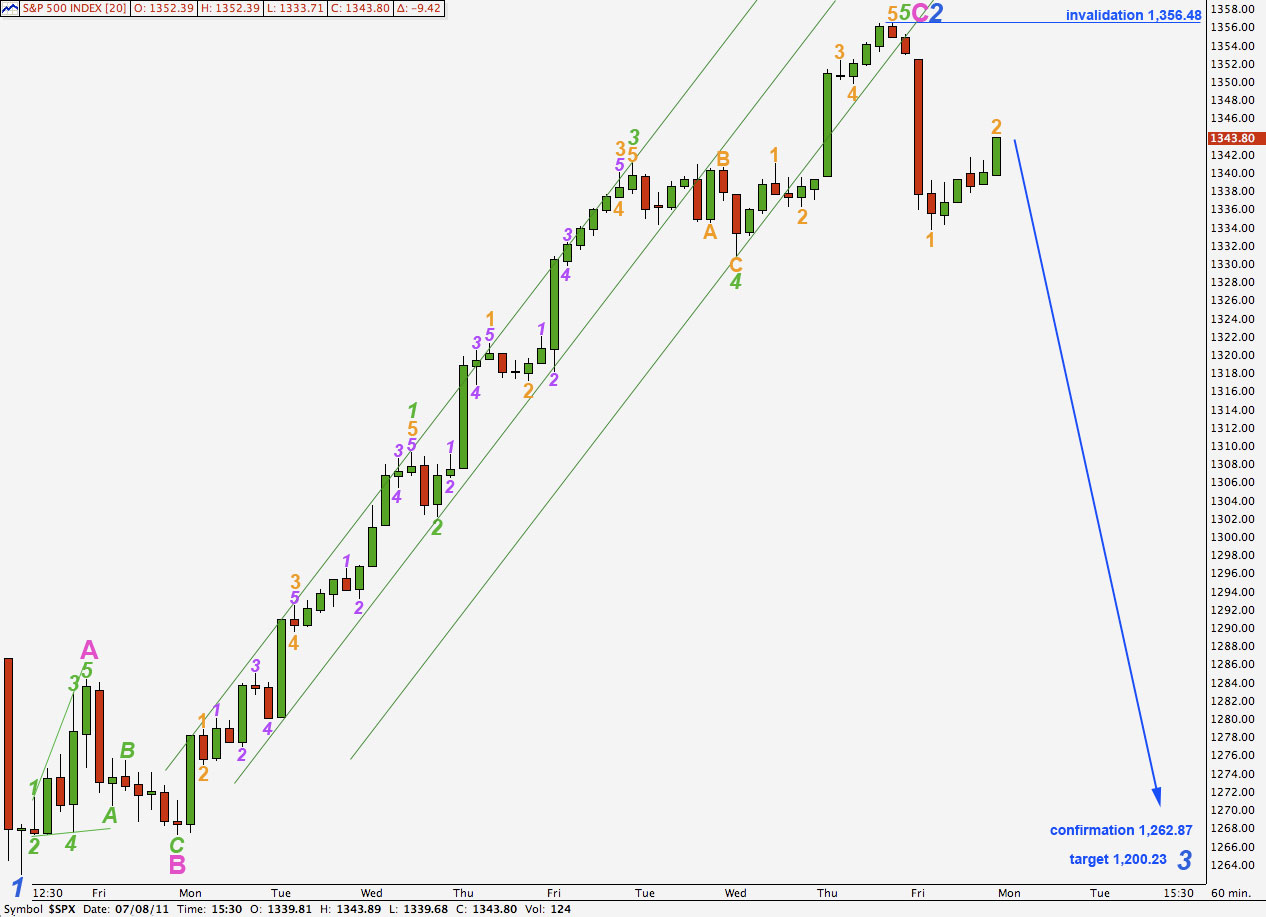
This wave count looks wrong on the hourly chart because 2 and 4 green are out of proportion and it does not fit well into a trend channel.
If this wave count is correct then we should be seeing strong impulsive downwards movement for a third wave.
At 1,200.23 wave 3 blue would reach 1.618 the length of wave 1 blue. This target is a mid term target which may be a few weeks away.
Wave 2 orange may not move beyond the start of wave 1 orange. This wave count is invalidated with movement above 1,356.48.
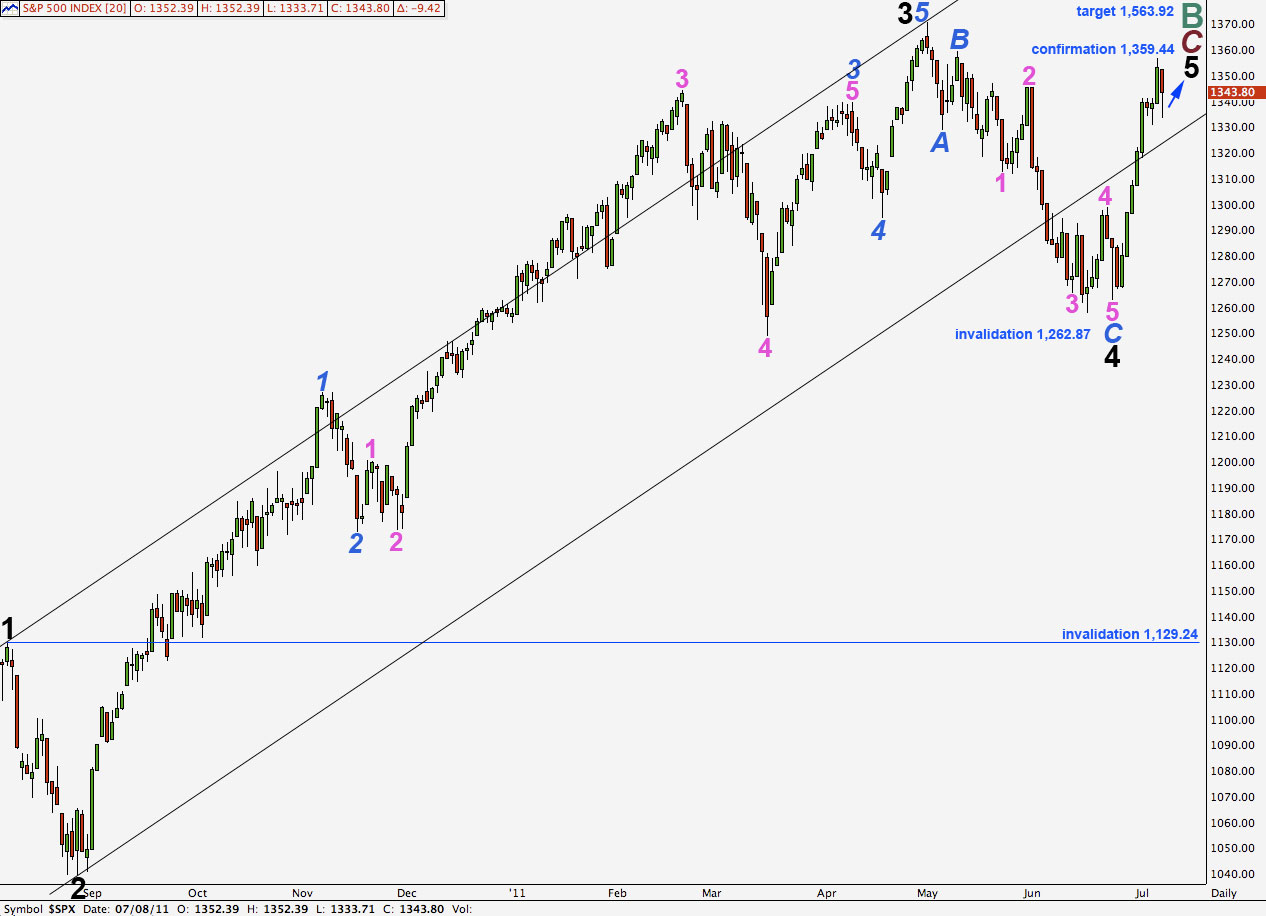
Alternate Wave Count.
Positives for this wave count:
– upwards movement of the last couple of weeks fits very well and has the right look on the hourly chart.
– we can see cycle wave A as a three wave structure and expect upwards movement for cycle wave B to reach at least to 1,494.15 where it will be 90% the length of cycle wave A.
– the problem of how to see the last piece of upwards movement to end black wave 3 is completely resolved.
Negatives for this wave count:
– wave 4 pink within wave 3 blue within wave 3 black is out of proportion to other corrections of a higher wave degree; it is too large.
– it does not have as good a fit within its trend channel as the main wave count does.
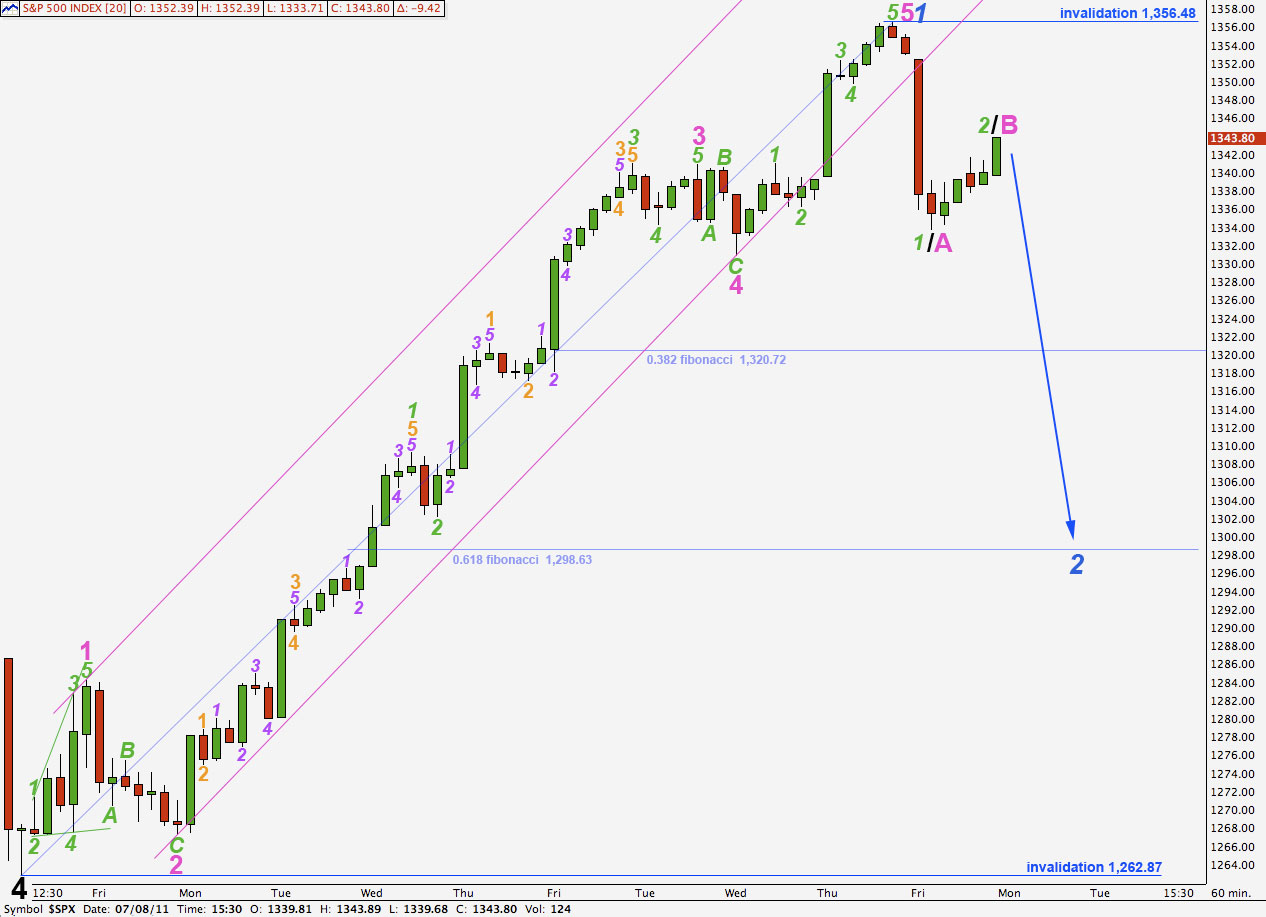
Wave 1 blue looks perfectly typical and fits a trend channel very well. The channel has a clear breach and so wave 2 blue is underway.
Downwards movement for Friday’s session may have been either wave 1 green within wave A pink, or it may be wave A pink in its entirety (if wave 2 blue is a zigzag).
Wave 2 green or wave B pink may not move beyond the start of wave 1 green or wave A pink. This wave count is invalidated with movement above 1,356.48.
The most likely structure for wave 2 blue is a zigzag which requires wave A pink to subdivide into a five wave structure.
At this stage we would still expect wave 2 blue to most likely be a deep 0.618 correction ending about 1,298.63.