
Elliott Wave chart analysis for the S&P 500 for 7th July, 2011. Please click on the charts below to enlarge.
Main Wave Count.
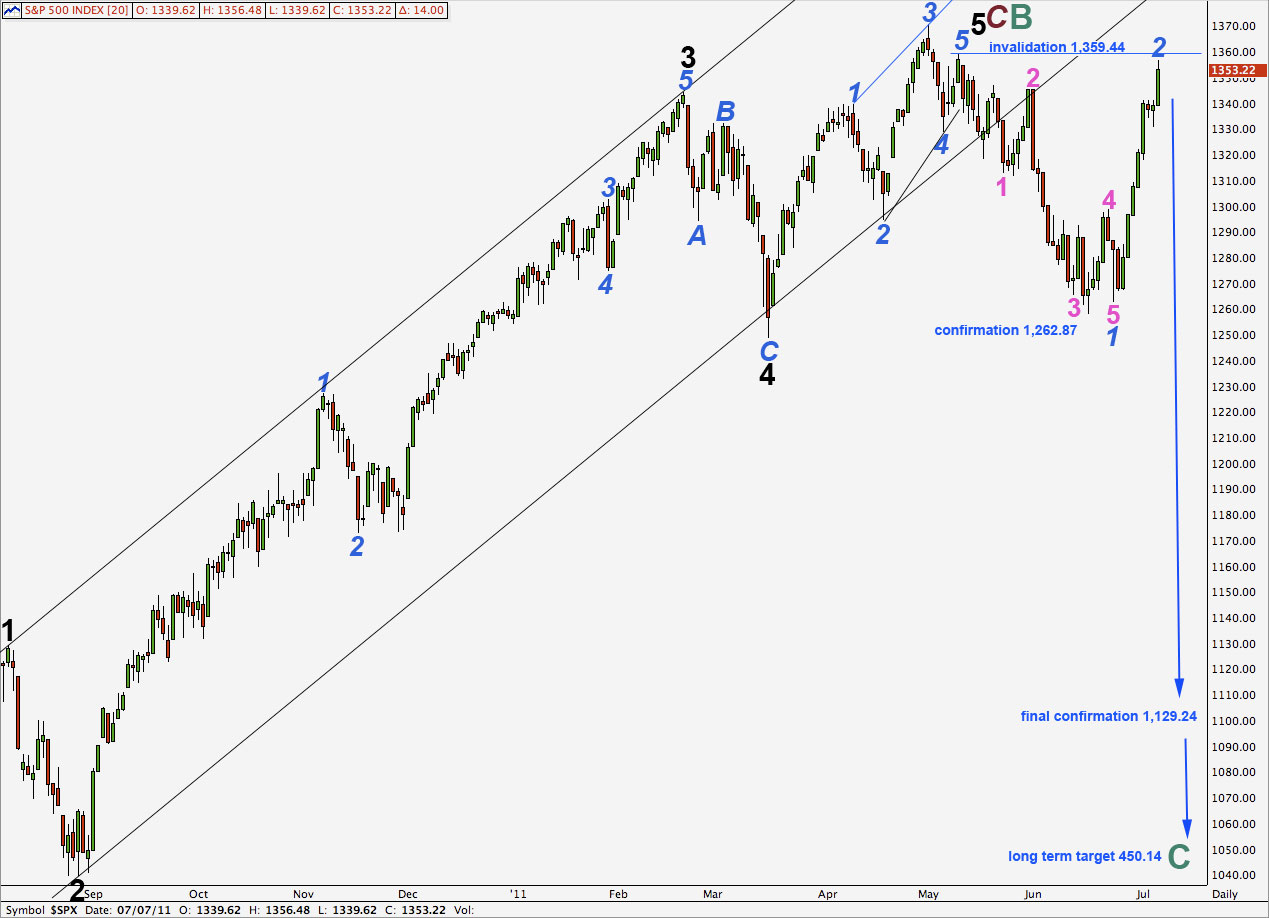
As expected from both of our hourly wave counts the S&P moved higher during Thursday’s session to end 4.19 points above our target.
For this main wave count wave 2 blue must be over and the next movement should be a third wave down. Momentum should be strong and clear.
Wave 2 blue does not look like a typical correction on the daily or hourly charts. It has a very strong impulsive look. To label this only wave A pink within wave 2 blue would be a possibility, but then this second wave would look very out of proportion to the first wave it is correcting.
On the daily chart this wave count has a better fit in its trend channel than the alternate. Within primary wave C here the proportions of black and blue waves have a good look.
There has been an extremely strong and clear trend channel breach indicating that the trend has changed to down.
The biggest problem with this wave count is the structures within the ending contracting diagonal for wave 5 black. This requires subwaves 1 and 3 blue to be seen as zigzags and they both look much better as impulses.
Wave 2 blue may not move beyond the start of wave 1 blue. This wave count is invalidated with movement above 1,359.44.
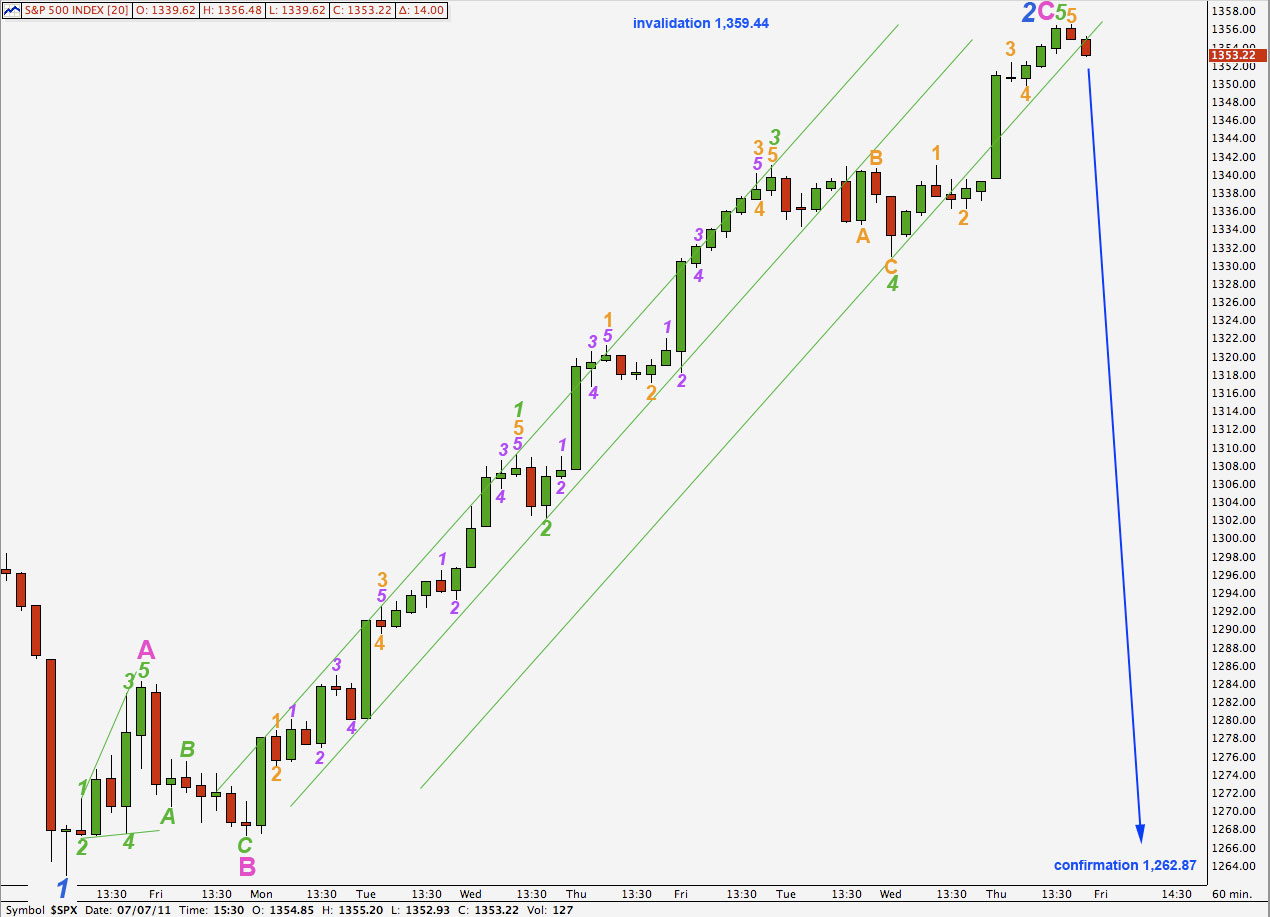
On the hourly chart this wave count looks wrong. Wave C pink is too long in relation to wave A pink, but there is a nice fibonacci ratio between the two. Wave C pink is just 1.28 points short of 4.236 the length of wave A pink.
Ratios within wave C pink are: wave 3 green is 3.11 points short of equality with wave 1 green and wave 5 green is just 0.38 points short of 0.618 the length of wave 1 green.
If wave 5 green of wave C pink extends any higher it may not move above 1,359.44.
If price moves above 1,359.44 this wave count will be invalidated and at that stage the alternate will be our preferred wave count.
Alternate Wave Count.
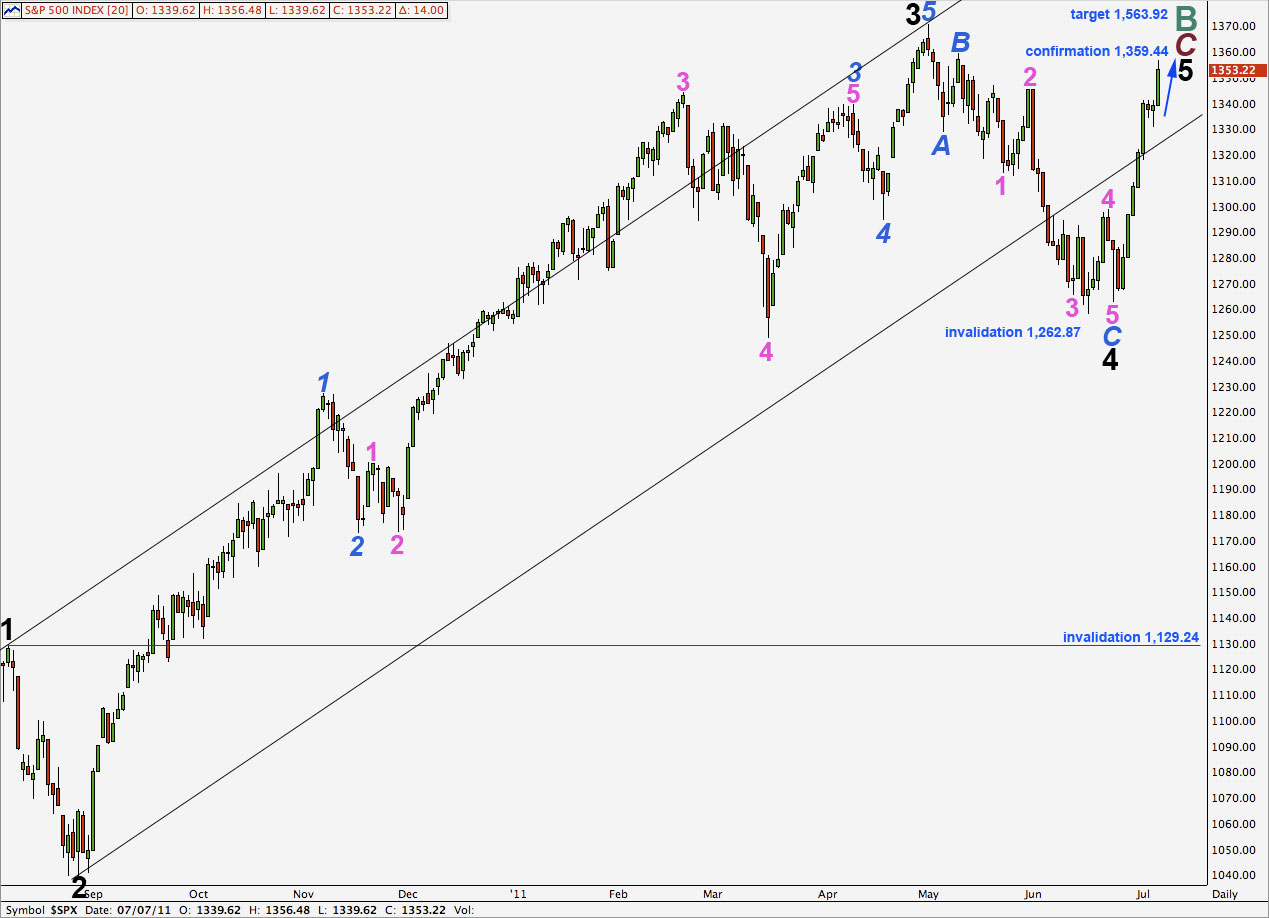
This wave count fits with most recent movement very well indeed. It resolves the problem the main wave count has of the last piece of upwards movement from 4 pink to the high of 3 black; here waves 5 pink to end 3 blue and 5 blue are both seen as impulses and not zigzags.
It does not have as good a fit into its trend channel as the main wave count does. The proportions of blue and pink waves within wave 3 black upwards are not very good.
At this stage we have a clear five wave structure up on the hourly chart and would be expecting a correction downwards for this wave count. This correction for a second wave may not move beyond the start of the first wave at 1,262.87.
Movement above 1,359.44 would confirm this wave count and invalidate the main wave count.
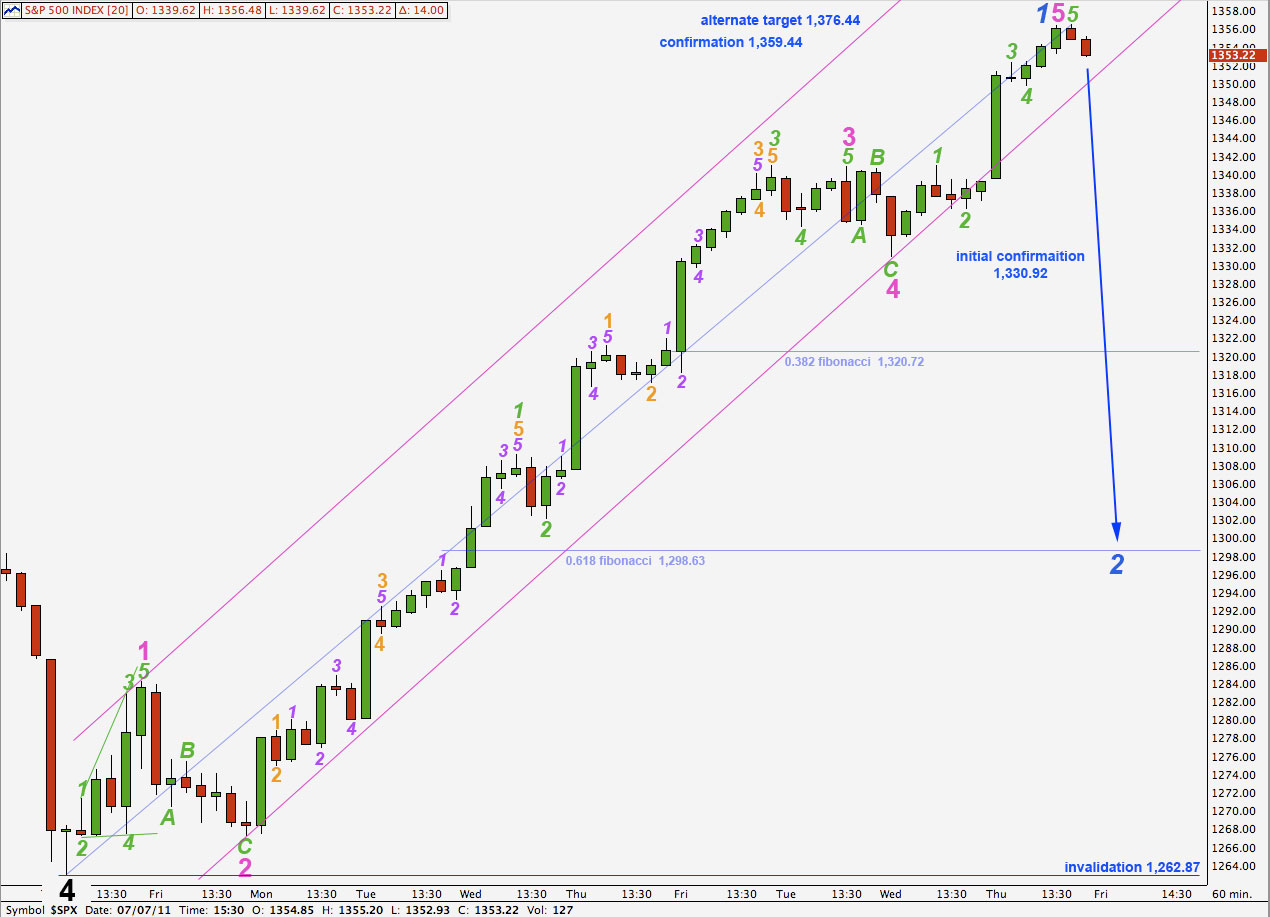
This wave count has a very good look on the hourly chart. It looks like a typical impulse.
Ratios within wave 1 blue are: wave 3 pink has no fibonacci ratio to wave 1 pink and wave 5 pink is 2.57 points short of 0.382 the length of wave 3 pink.
Ratios within wave 5 pink of wave 1 blue are: wave 3 green is just 0.17 points short of 1.618 the length of wave 1 green and wave 5 green is just 0.51 points longer than 0.618 the length of wave 1 green.
This upwards movement fits perfectly into a parallel channel drawn here using Elliott’s technique.
If we moved the degree of labeling from the low labeled 4 pink all down one degree then we may have only seen wave 1 green within wave 5 pink. If price moves above 1,356.48 to a new high then this is how we would label this chart. At that stage we may expect price to continue to rise to about 1,376.44 where wave 5 pink would reach 0.618 the length of wave 3 pink. This is our alternate target if price moves higher.
Movement above 1,359.44 would invalidate the main wave count and so confirm this alternate.
It is likely that wave 1 blue is complete. We would expect the following second wave correction to be a deep correction and at this early stage the 0.618 fibonacci ratio at 1,298.63 would be most likely.
Movement to a new low below 1,330.92 would confirm wave 2 blue to be underway. At that stage downwards movement may not be a second wave correction within wave 5 pink and so wave 5 pink and wave 1 blue would have to be over.
We would need to see movement below this parallel channel to confirm an end to wave 1 blue upwards and the start of wave 2 blue downwards.
Wave 2 blue may not move beyond the start of wave 1 blue. This wave count is invalidated with movement below 1,262.87.