
Elliott Wave chart analysis for the S&P 500 for 6th July, 2011. Please click on the charts below to enlarge.
Sideways and slightly lower movement invalidated the hourly wave count. This may have been an extension of a fourth wave.
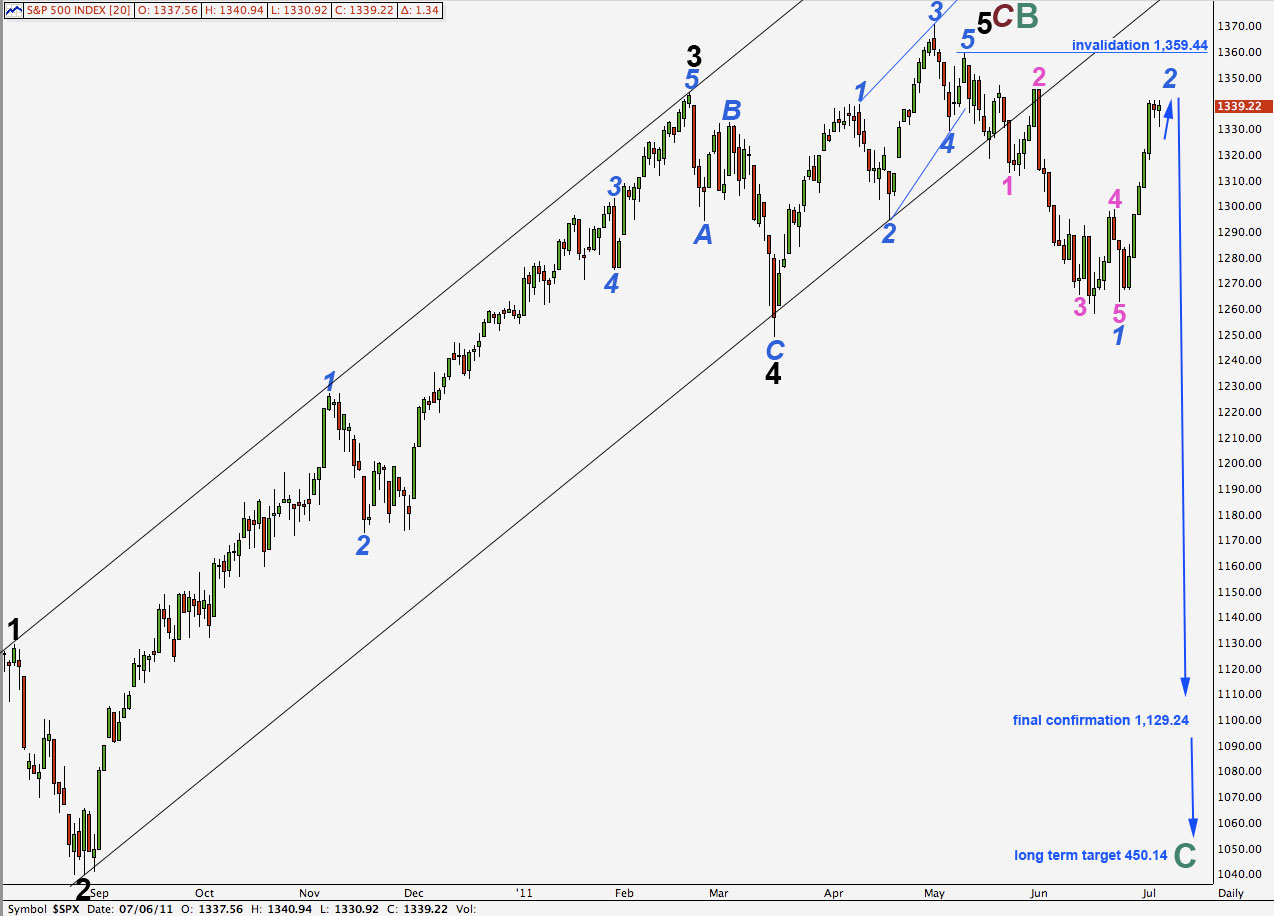
Wave 2 blue is not looking like a typical zigzag on the daily chart. On the hourly chart it looks like an impulse. Also, if this were only wave A pink within a zigzag for 2 blue it would be out of proportion to wave 1 blue.
Wave 2 blue is very close to being over. When it is over, for this wave count the next wave should be a strong third wave down, if this wave count is correct, and at that stage movement below 1,284.24 would increase the probability of this wave count as this is the high of wave A pink within 2 blue. Movement below this point would eliminate the alternate possibility that a new impulse upwards is developing, as downwards movement could not then be a fourth wave correction.
Wave 2 blue may not move beyond the start of wave 1 blue. This wave count is invalidated with movement above 1,359.44. At that stage we would use our alternate wave count.
Movement below 1,129.24 would confirm this wave count at cycle degree and would invalidate our alternate wave count.
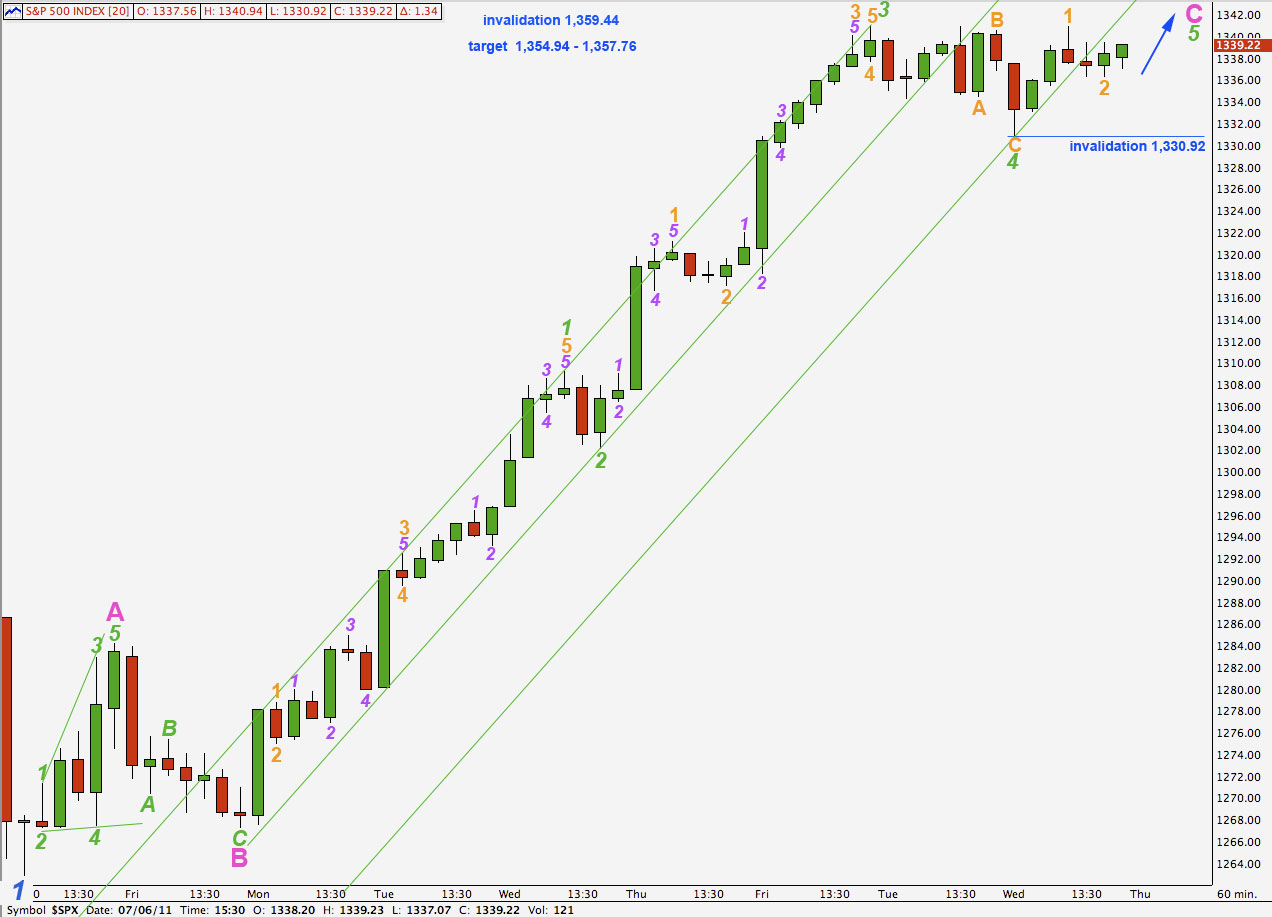
With yesterday’s sideways movement this upwards wave is looking very much like an impulse. Wave C pink is too long in relation to wave A pink and wave 4 green is out of proportion to wave 2 green.
At 1,357.76 wave C pink will reach 4.236 the length of wave A pink.
At 1,354.94 wave 5 green within wave C pink will reach 0.618 the length of wave 3 green.
Wave 2 blue may end within this target zone.
Movement above 1,359.44 would invalidate this wave count.
Wave 2 orange may not move beyond the start of wave 1 orange. This wave count is invalidated with movement below 1,330.92
Alternate Wave Count.
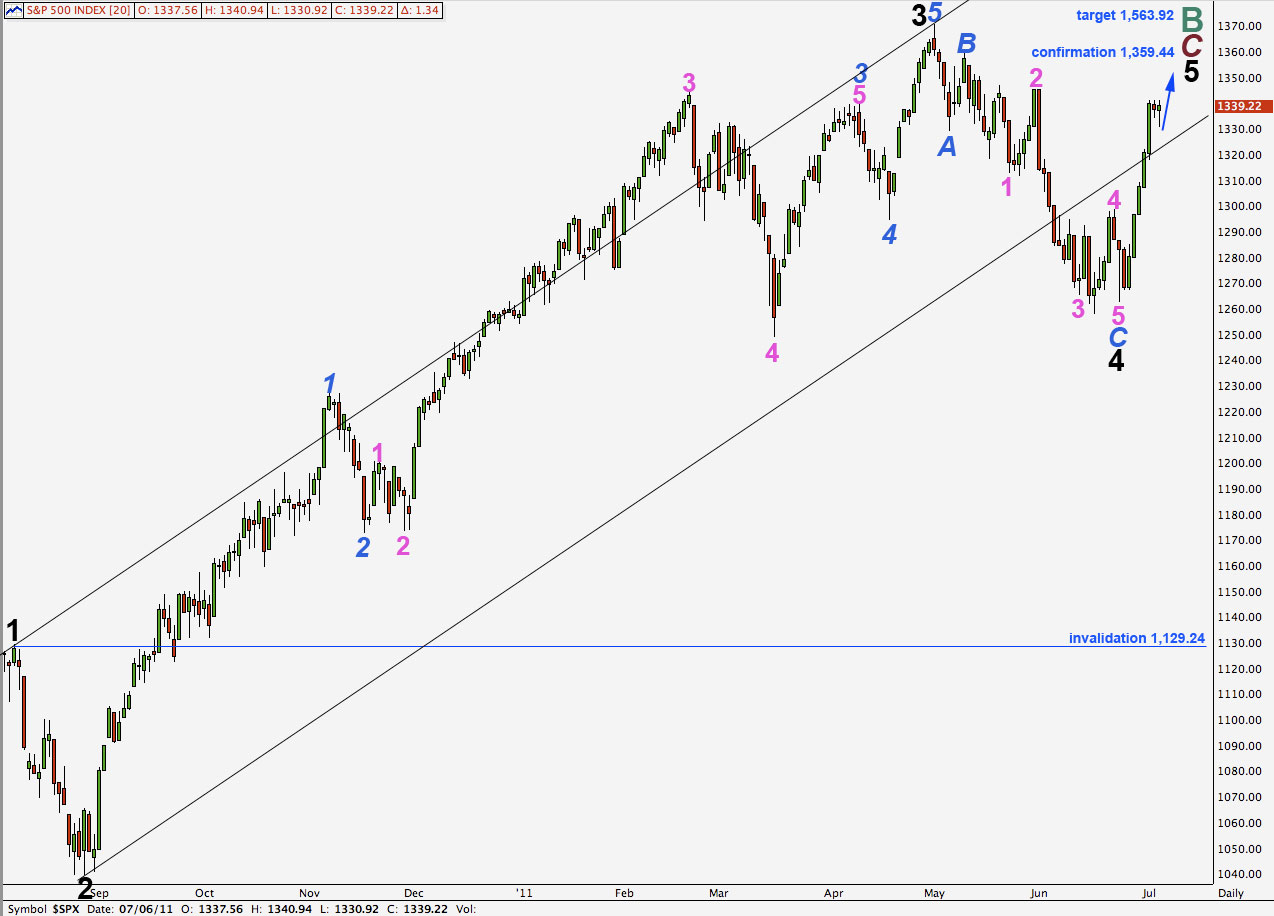
This alternate wave count does not have as good a fit within its trend channel as the main wave count does. However, the middle of third waves sometimes overshoot the channel, as do fourth waves, so this is possible.
The proportions of pink (minute) and blue (minor) waves are not a good fit for this wave count.
This wave count has a more satisfactory labeling for the rise from 4 pink to 5 blue within 3 black than the main wave count which sees this movement as an ending diagonal. Here the problem of how to see this movement is resolved.
Overall at this stage I would judge the main and hourly wave counts to be of about equal probability. Mostly because on the hourly chart this upwards movement looks so much like a clean impulse.
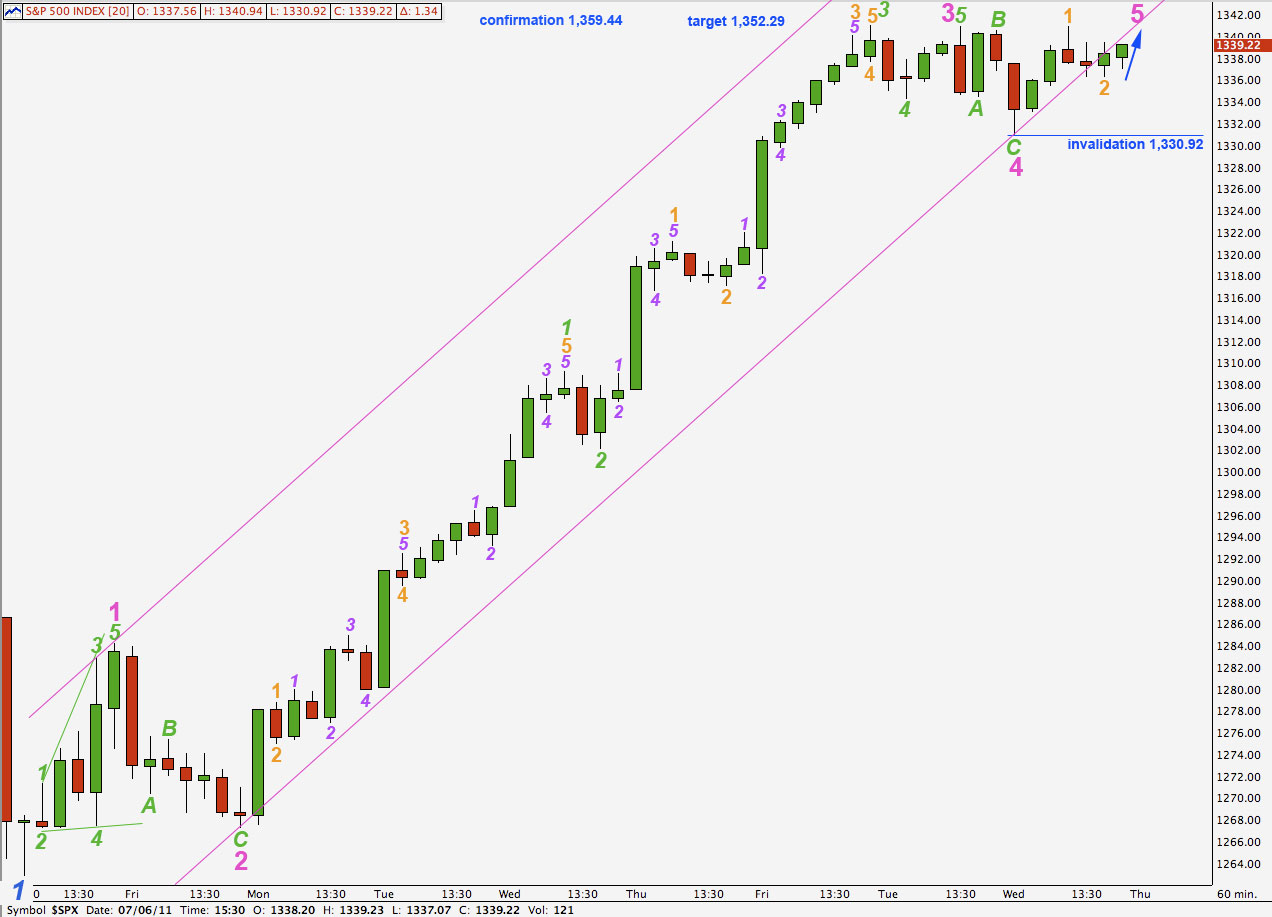
When we use Elliott’s second technique to draw a trend channel about upwards movement it is a very good fit, so far.
Wave 3 pink has no fibonacci ratio to wave 1 pink. We would expect then for wave 5 pink to exhibit a ratio to either of 3 or 1. At 1,352.29 wave 5 pink will reach equality with wave 1 pink.
Ratios within wave 3 pink are: wave 3 green is 3.11 points short of equality with wave 1 green and wave 5 green is just 0.40 points longer than 0.146 the length of wave 1 green.
Wave 2 orange may not move beyond the start of wave 1 orange. This wave count is invalidated with movement below 1,330.92.
If this wave count is invalidated with downwards movement tomorrow then we may expect that wave 5 pink ended at the high labeled 1 orange, and downwards movement may be a second wave correction.