
Elliott Wave chart analysis for the S&P 500 for 5th July, 2011. Please click on the charts below to enlarge.
We were expecting a fourth wave correction when markets reopened after the holiday and this is what we have got.
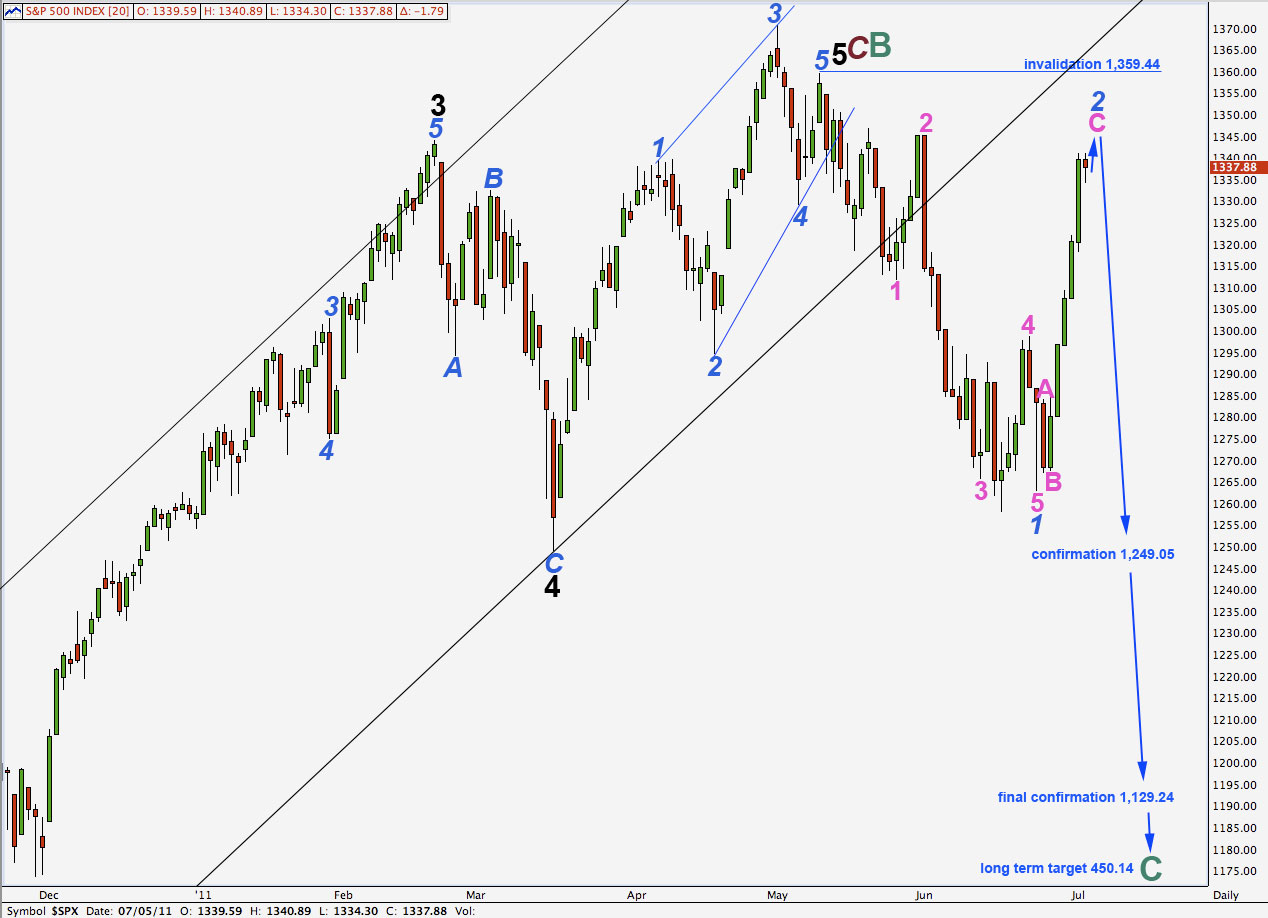
Wave 2 blue is very close to being over. When it is over, the next wave should be a strong third wave down, if this wave count is correct, and at that stage movement below 1,284.24 would increase the probability of this wave count as this is the high of wave A pink within 2 blue. Movement below this point would eliminate the alternate possibility that a new impulse upwards is developing, as downwards movement could not then be a fourth wave correction.
Wave 2 blue may not move beyond the start of wave 1 blue. This wave count is invalidated with movement above 1,359.44.
Movement below 1,129.24 would confirm this wave count at cycle degree and would invalidate our alternate daily wave count.
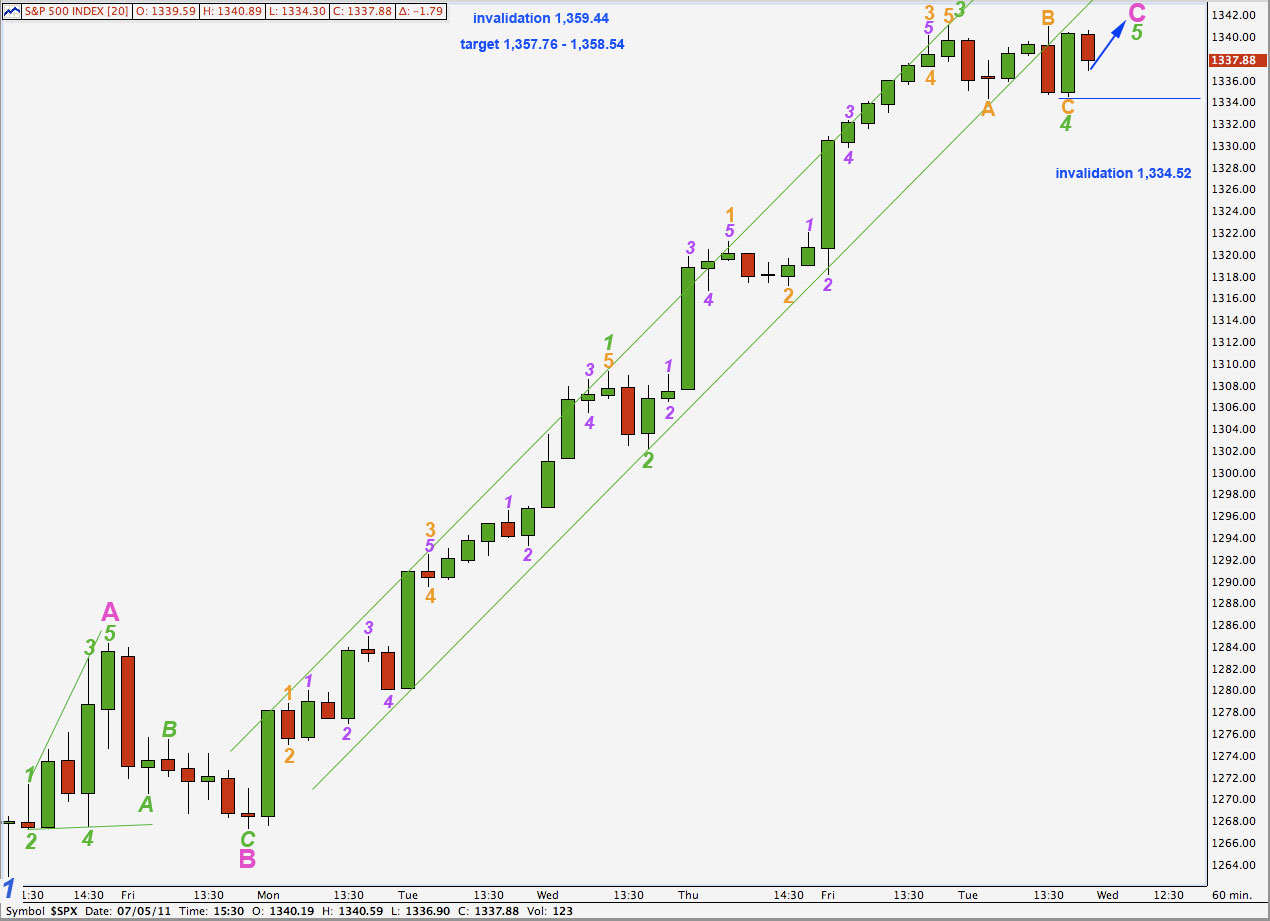
Wave 4 green moved price sideways as expected.
Wave 4 green has overshot the parallel channel containing the impulse for wave C pink. This may indicate an overshoot to come for wave 5 green upwards on the opposite side of this channel.
Within wave 5 green no second wave correction may move beyond the start of the first wave. This wave count is invalidated with movement below 1,334.52.
At 1,358.54 wave 5 green will reach 0.618 the length of wave 3 green.
At 1,357.76 wave C pink will reach 4.236 the length of wave A pink.
This gives us a 0.78 target zone for upwards movement to end.
When we have movement below 1,334.52 and further significant movement below this small parallel channel then we may have our first indication that wave 2 blue is complete and wave 3 blue downwards has begun.
Alternate Daily Chart.
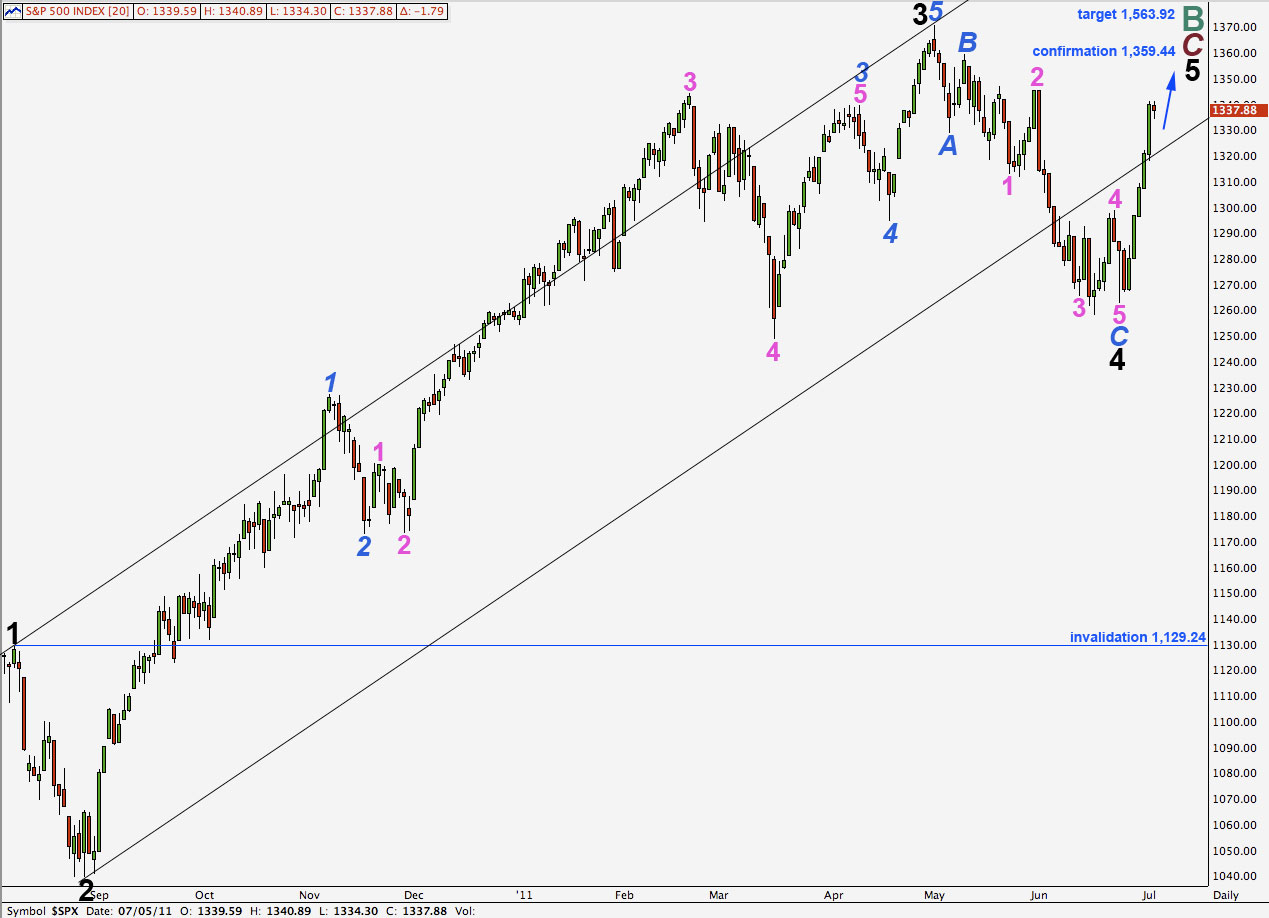
Movement above 1,359.44 would confirm this wave count. At that stage we should expect a continuation of steady upwards movement for weeks if not another month or two towards the target 1,563.92, where primary wave C will reach equality with primary wave A.
Importantly, this wave count allows for new all time highs for the S&P 500, and indeed this would be fairly likely.
Eventually cycle wave C would follow to take price to new lows.
On the hourly chart the subdivisions are the same as for the main daily wave count with the following difference: instead of pink A-B-C we would label upwards movement pink 1-2-3. When 3 pink (C pink) is complete the following downwards movement for this wave count would be a fourth wave correction which should not move into wave 1 pink price territory. Movement below 1,284.24 would at that stage invalidate this wave count at the hourly chart level and reduce the probability of this wave count significantly.