
Elliott Wave chart analysis for the S&P 500 for 30th June, 2011. Please click on the charts below to enlarge.
As expected from last analysis we have seen further upwards movement from the S&P 500 and price is now just 2.33 points short of our target.
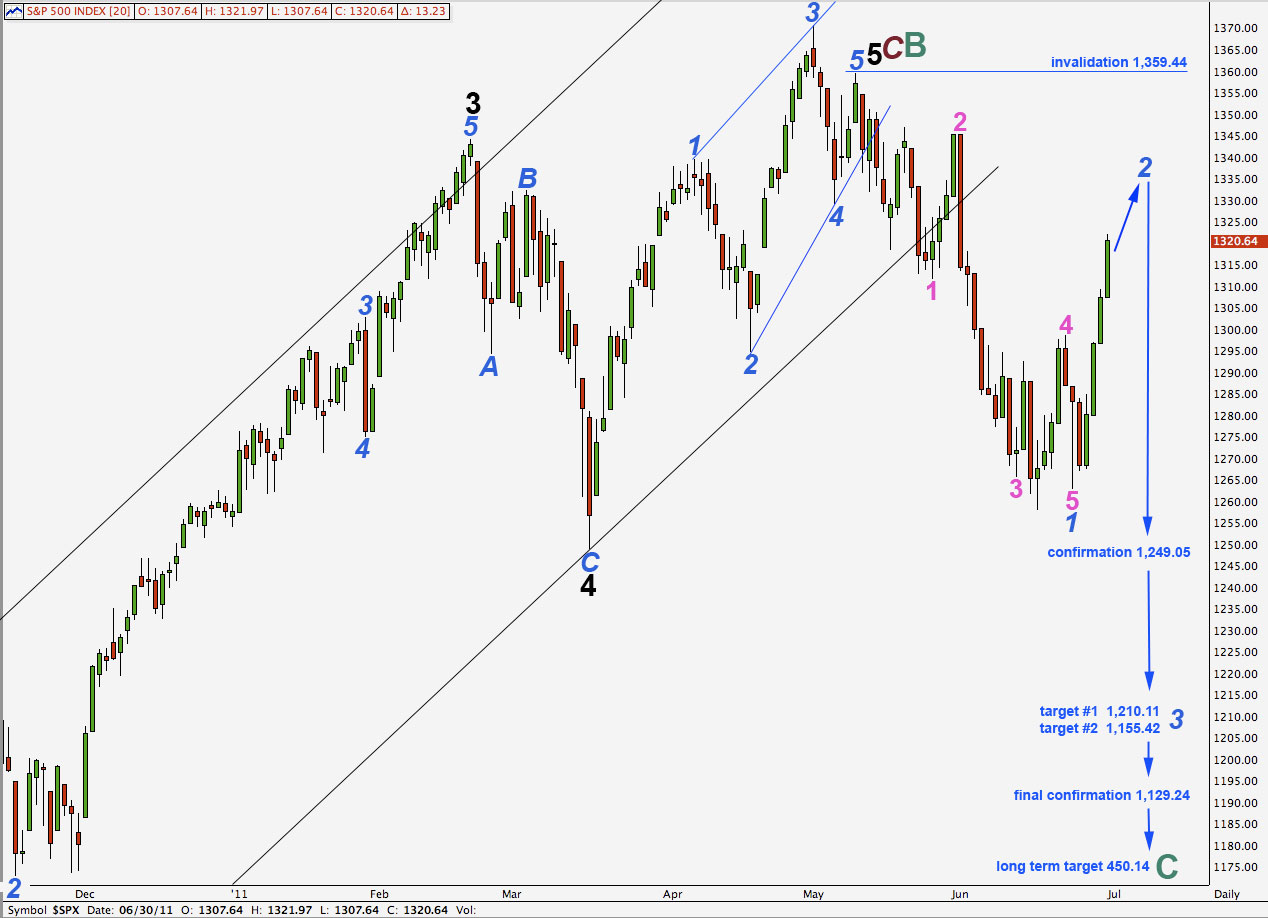
If this wave count is correct we should expect wave 2 blue to have clear subdivisions on the daily chart. It is extremely unlikely then to be over here. Within wave 2 blue we are likely to see an overlapping three wave movement downwards for wave B.
Wave 2 blue may not move beyond the start of wave 1 blue. This wave count is invalidated with movement above 1,359.44.
We would expect wave 2 blue to be most likely a zigzag and most likely a deep correction.
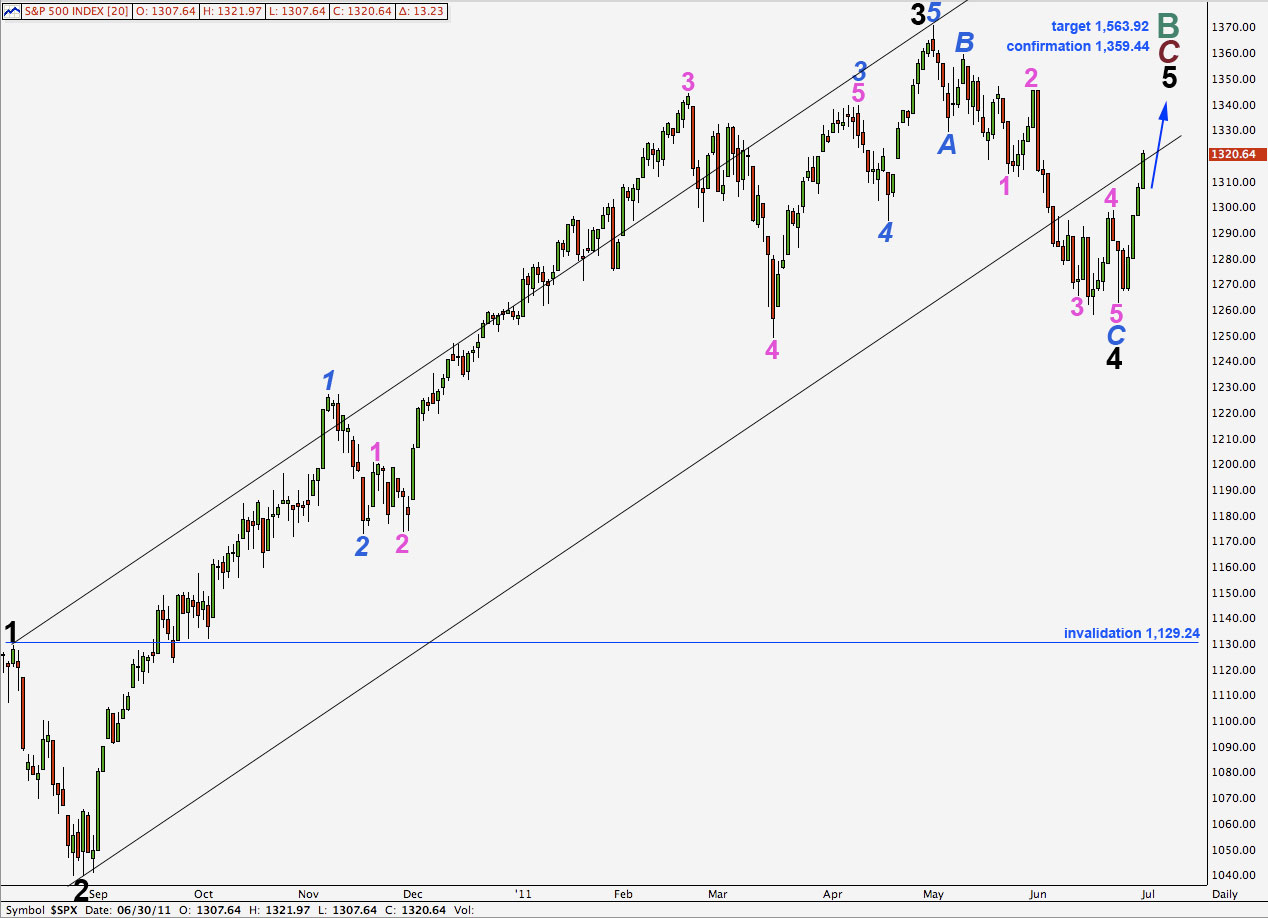
The bigger picture for this wave count sees the all time high at 1,576.09 in October 2007 as the start of a larger correction. We have seen cycle wave A down (the “credit crunch”), followed by cycle wave B zigzag upwards (the end is seen here on the daily chart) and now we may be in the very early stages of cycle wave C downwards. We would expect cycle wave C to last at least a year, if not several, and it is highly likely to reach equality with cycle wave A at 450.15.
Main Hourly Wave Count.
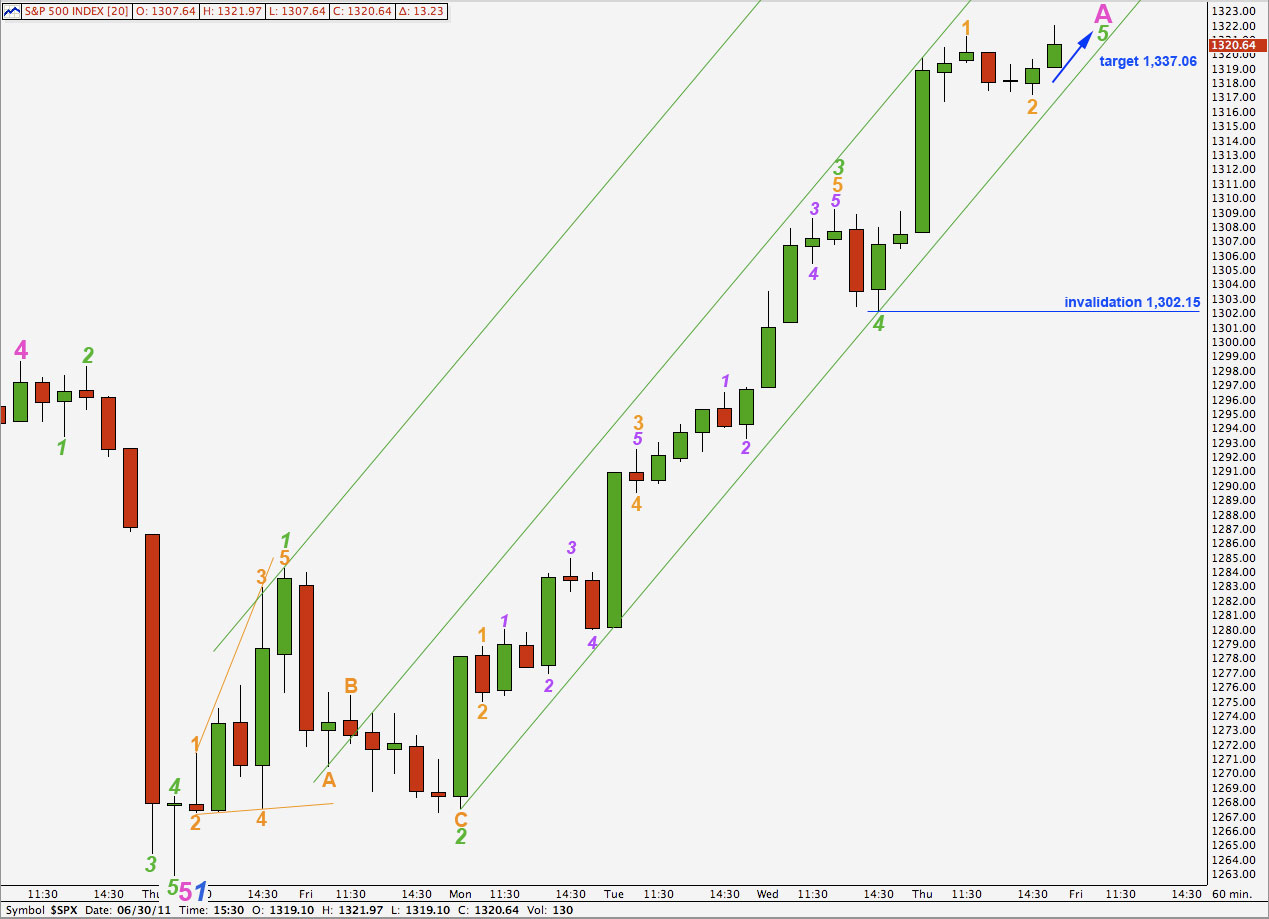
This wave count is the main wave count today only because we should always assume that the trend remains the same, until proven otherwise. At this stage price is still contained within the parallel channel drawn here and so we should assume that the trend remains up. When this channel is breached to the downside we may expect that pink wave A is complete and pink wave B downwards would be unfolding.
Green wave 3 was just 0.33 points longer than 1.618 the length of green wave 1 and so we may not see a fibonacci ratio between green wave 5 and either of 1 or 3. However, green wave 5 would reach equality with green wave 3 at 1,337.06.
The final upwards wave for Thursday’s session may have only been orange wave 1 within green wave 5.
So far orange wave 2 is a clear three wave structure (see 1 minute chart below the alternate hourly count) and so it would most likely be over here for this wave count.
Any further movement downwards of wave 2 orange may not move beyond the start of wave 1. This wave count is invalidated with movement below 1,302.15.
If price moves below this parallel channel, and particularly if it moves below 1,302.15 thereby invalidating this wave count, we shall use the alternate wave count below.
Alternate Hourly Wave Count.
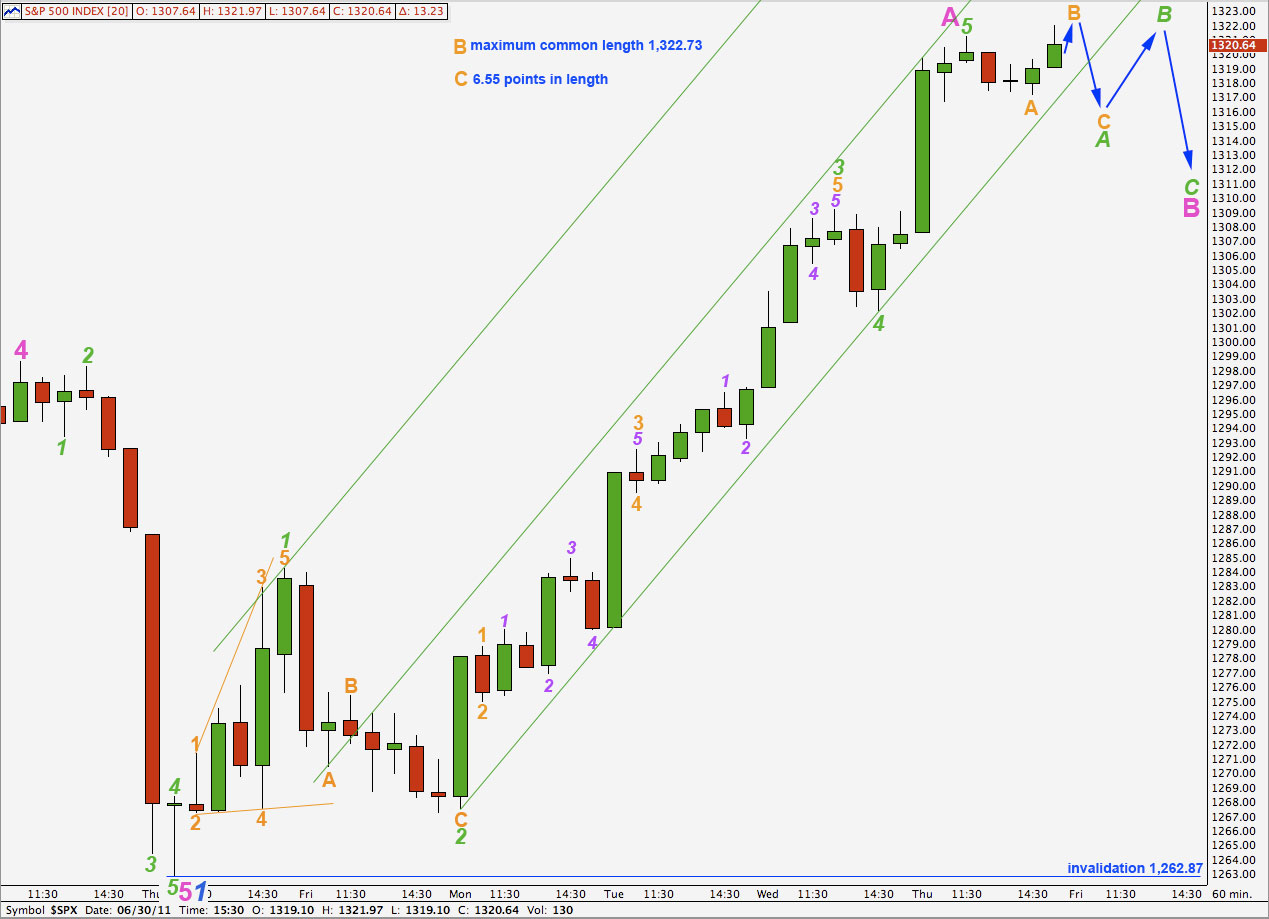
Pink wave A is now a complete impulsive structure. It is possible that sideways movement, which ended Thursday’s session, is the start of pink wave B.
Wave B pink may subdivide into a three or a triangle. The structure of green wave A within it will indicate what is the most likely structure for pink wave B. At this stage there are several options open to it.
Within green wave A orange wave A subdivides into a three wave structure which indicates that green wave A will also subdivide into a three. This rules out a zigzag for pink wave B and leaves a triangle or a flat correction (or a combination beginning with a flat). This structure can be seen on the 1 minute chart below.
When wave A subdivides into a three (within an A wave) the structure is most likely a flat. This requires wave B to be at least 90% the length of wave A and this condition is already met. The maximum common length within a flat of wave B in relation to wave A is up to 138%. This would be achieved at 1,322.73.
If price continues past 1,322.73 and keeps rising then the probability of this alternate hourly wave count will significantly reduce and we should use the main hourly wave count.
Wave A green is most likely an expanded flat. The most common length of wave C in relation to wave A within an expanded flat is 1.618 its length, which would see wave C orange downwards being about 6.55 points in length.
Thereafter, wave B green should unfold to take price higher, and possibly to a new high.
We would expect wave B pink to last a few days if not a week or so.
Wave B pink may not move beyond the start of wave A pink. This wave count is invalidated with movement below 1,262.87.
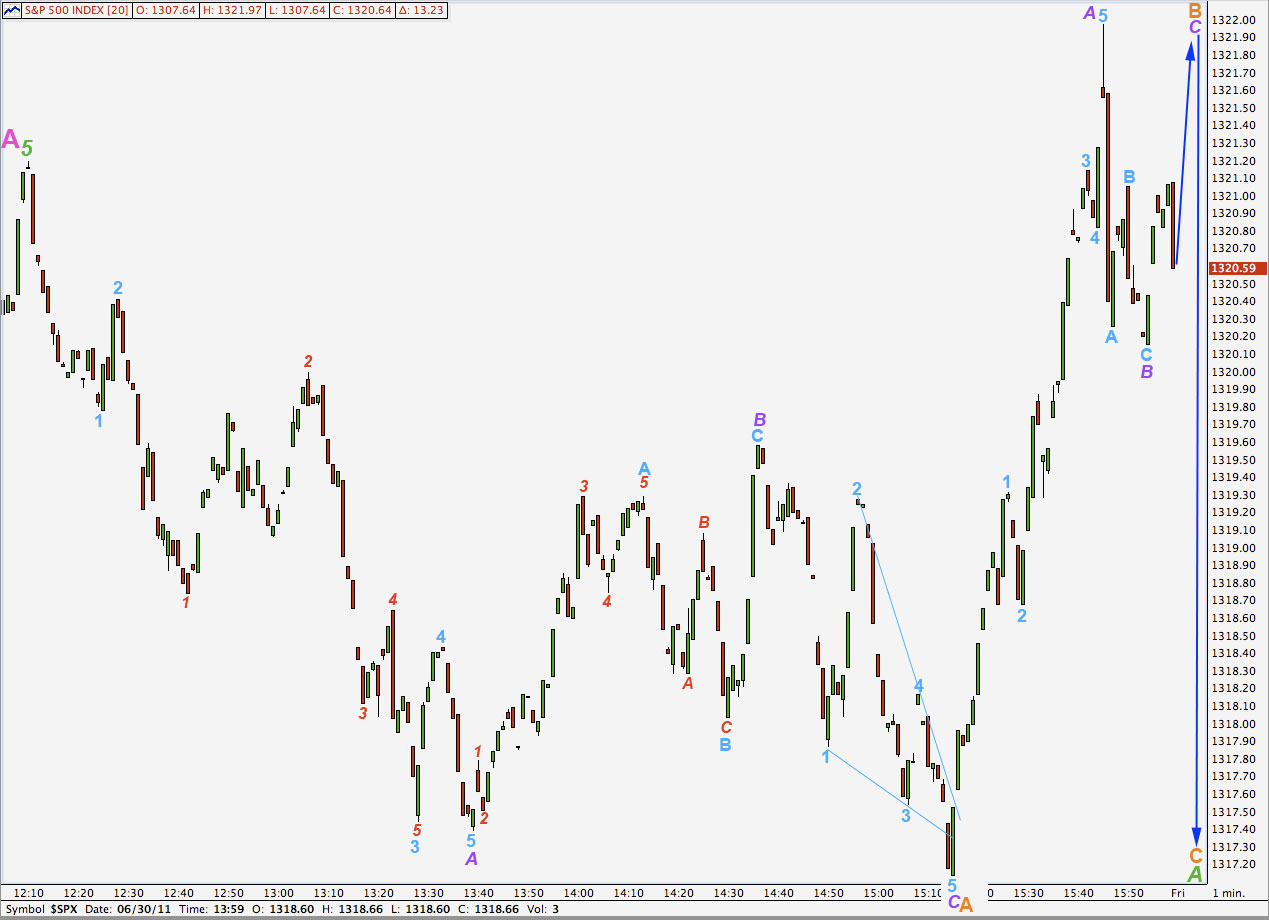
The 1 minute chart above is published today simply to show how I have decided upon today’s wave count, and how I have checked the subdivisions.
Within wave B orange zigzag wave C purple would reach 0.382 the length of wave A purple at 1,322. If this wave count is correct it may end there.
This 1 minute chart also shows subdivisions that are similar to that of the main hourly wave count, but instead of a zigzag for wave A orange this may have been wave 2 orange downwards, and upwards movement may be a third wave at orange degree.
Alternate Daily Wave Count.
This wave count remains valid. It does not fit the trend channel nearly as well as the main wave count does for upwards movement. But the middle of third waves do sometimes overshoot the channel and fourth waves also may overshoot the channel, and therefore this wave count could be correct.
If price moves strongly back into this parallel channel then this wave count will increase in probability.
Movement above 1,359.44 would invalidate our main wave count and confirm this alternate. At that stage we should expect continuing upwards movement towards 1,563.92 where primary wave C (maroon) would reach equality with primary wave A within this cycle wave B zigzag.
Importantly, this wave count allows for new all time highs for the S&P 500, and indeed this would be fairly likely.
Eventually cycle wave C would follow to take price to new lows.