
Elliott Wave chart analysis for the S&P 500 for 24th June, 2011. Please click on the charts below to enlarge.
Friday’s session saw further downwards movement as expected.
However, if this is the beginning of a third wave down we would expect to see stronger downwards movement. I have an alternate hourly wave count for us to end the trading week which may explain the lack of downwards momentum.
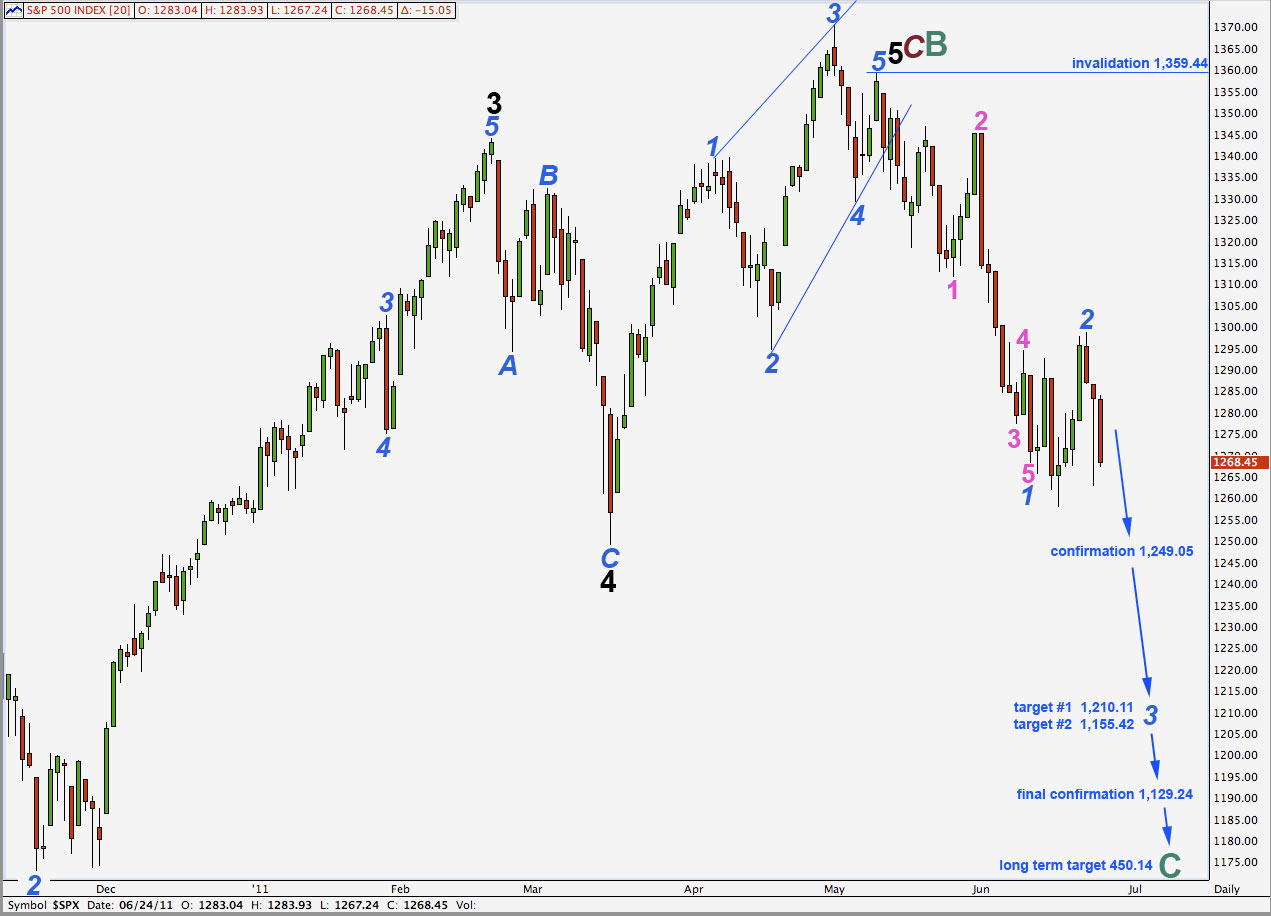
At 1,210.11 wave 3 blue will reach equality in length with wave 1 blue. At 1,155.42 wave 3 blue would reach 1.618 the length of wave 1 blue. This would be a more likely target.
We may need to move the degree of labeling for downwards movement up one degree. I will keep this in mind over the next couple of weeks.
Movement below 1,129.24 will provide strong confirmation that the S&P 500 is in a bear market which should last at least a year, if not several. At that stage the alternate daily chart presented at the end of this analysis will be invalidated.
The long term target at 450.14 is where cycle wave C will reach equality with cycle wave A within a super cycle zigzag. This target is probably over a year away.
Main Hourly Wave Count.
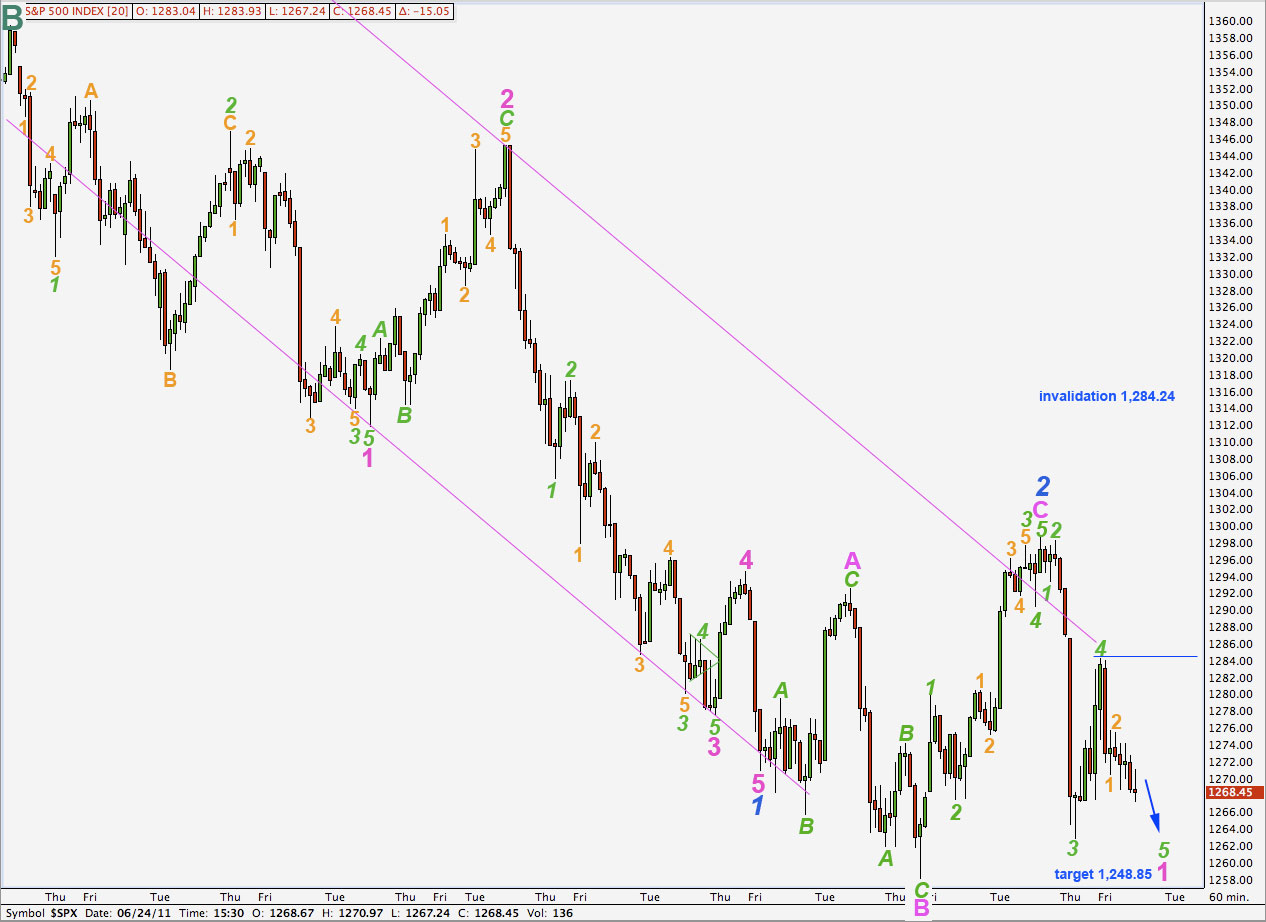
To compare the main and alternate I am showing all downwards movement from the end of cycle wave B high.
All the subdivisions work very well for this wave count.
Ratios within wave 1 blue are: wave 3 pink has no fibonacci ratio to wave 1 pink and wave 5 pink is 2.29 points short of 0.382 the length of wave 3 pink.
Within wave 2 blue there is no fibonacci ratio between waves A and C pink.
Wave 5 green within wave 1 pink of wave 3 blue downwards will reach equality with wave 3 green at 1,248.85. This is our target for the current downwards wave to end. This target may be reached within a week.
Wave 2 orange, if it extends higher, may not move beyond the start of wave 1 orange. This wave count is invalidated with movement above 1,284.24.
Alternate Hourly Wave Count.
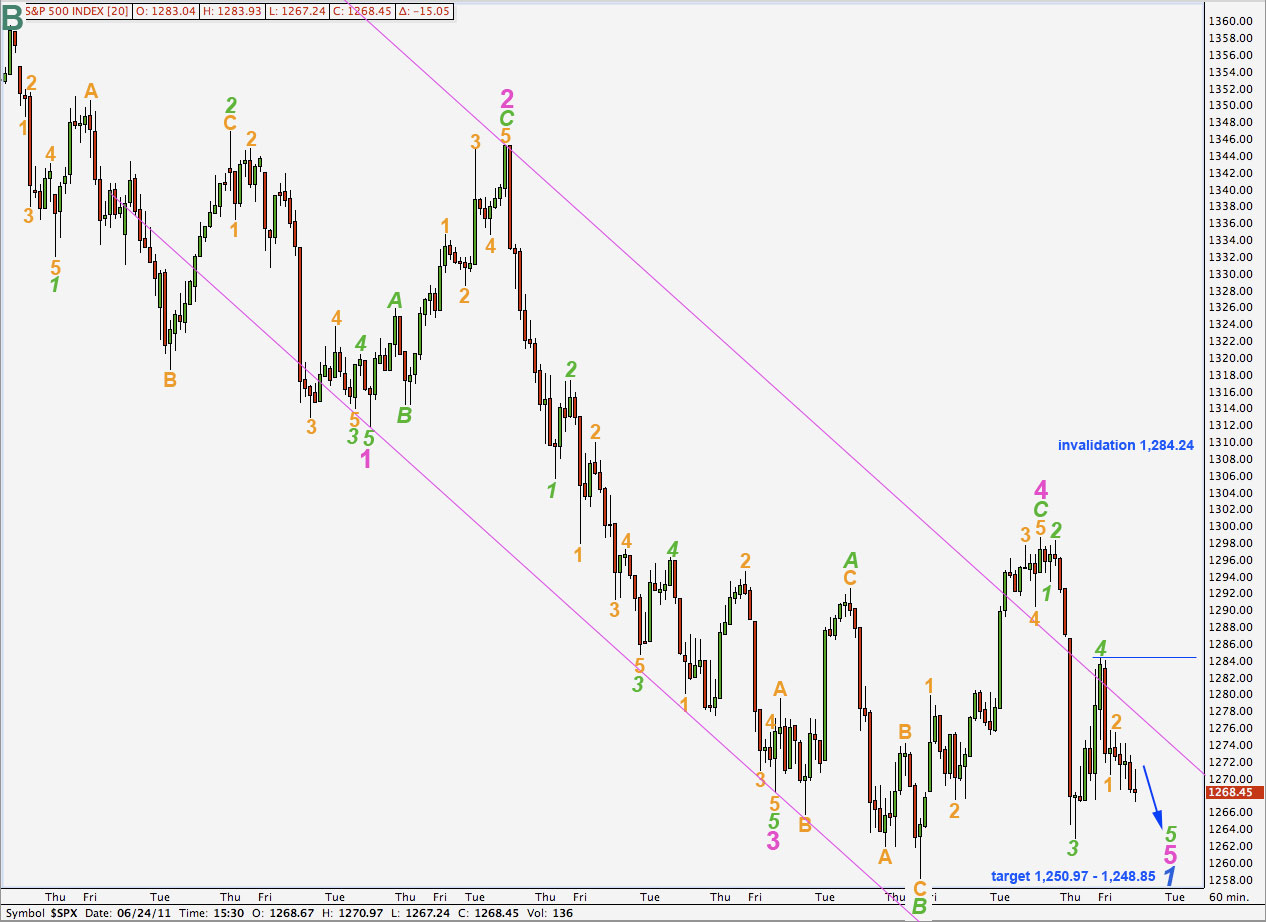
It may be possible that we are only nearing the end of wave 1 blue downwards and wave 2 blue is yet to unfold.
The subdivisions within this wave count do not all fit correctly, specifically the following two areas:
Within wave 2 orange of wave 5 green of wave 3 pink this wave count ignores a fairly obvious triangle structure. This wave count must see this movement as a flat with a truncated C wave.
Within wave 3 green of wave 3 pink of wave 1 blue the subdivisions do not work as well on a 15 minute chart for this wave count as it does for the main wave count.
Ratios within wave 1 blue are: wave 3 pink is just 0.16 points short of 1.618 the length of wave 1 pink. This is an excellent fibonacci ratio. Wave 5 pink may not necessarily show a good fibonacci ratio to either of 1 or 3 pink.
At 1,250.97 wave 5 pink will reach equality with wave 3 pink.
At 1,248.85 wave 5 green within wave 5 pink will reach equality with wave 3 green. This gives us a small 2.12 point target zone for this downwards movement to end. About that point we may expect a larger correction for wave 2 blue which may move right up to the start of wave 1 blue at 1,359.44 but not above.
Wave 2 orange, if it extends higher, may not move beyond the start of wave 1 orange. This wave count is invalidated with movement above 1,284.24.
Alternate Daily Wave Count.
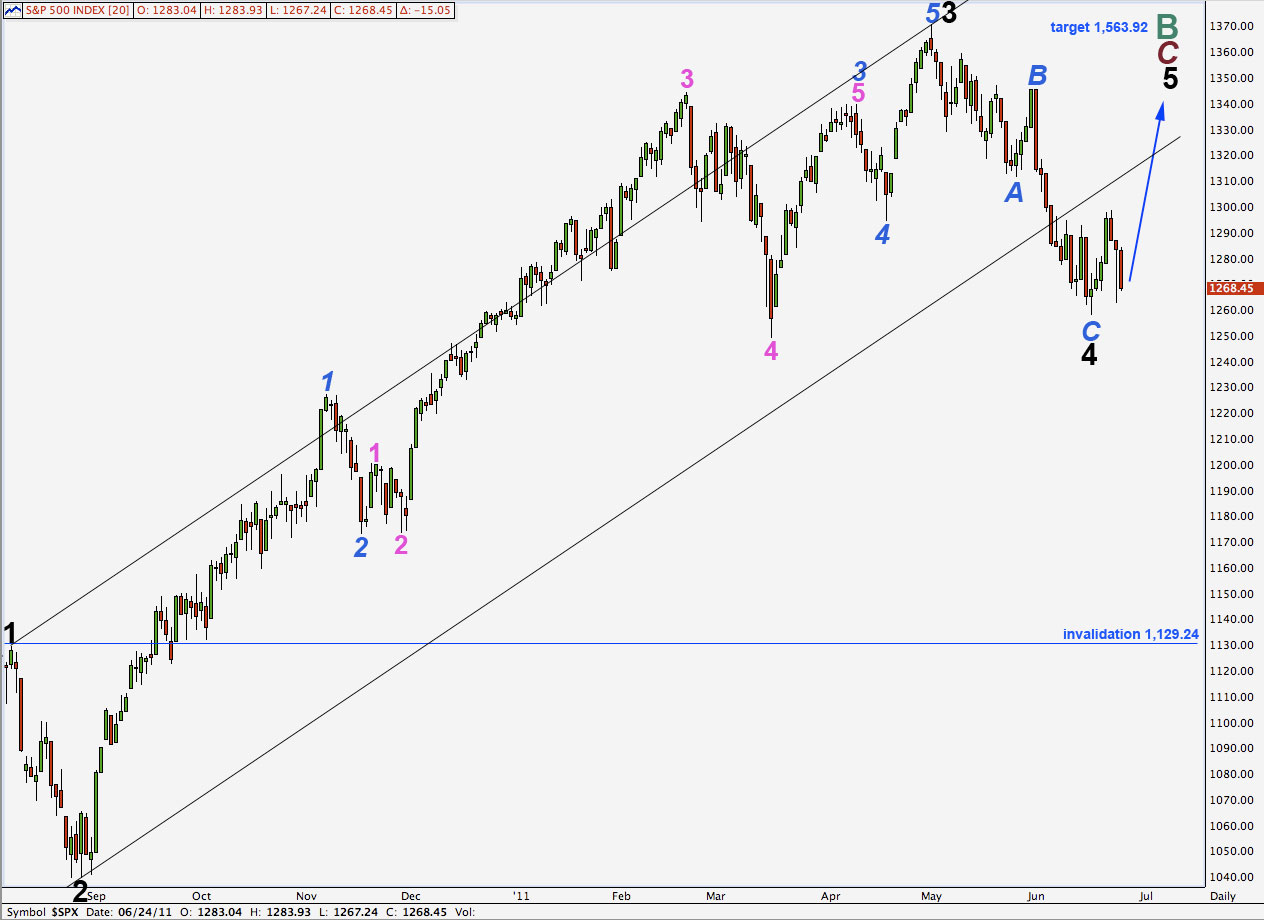
I am presenting this alternate daily wave count again to illustrate the importance of the price point 1,129.24.
Downwards movement may be wave 4 black within primary wave C impulse. We may yet see new highs with wave 5 black. At 1,563.92 primary wave C will reach equality with primary wave A within cycle wave B zigzag.
For this wave count wave 2 black lasted 15 days and wave 4 black has so far lasted 33 days. These waves are now reasonably out of proportion.
The parallel channel here drawn using Elliott’s technique shows a larger channel breach for this fourth wave, and it does not contain all upwards movement. However, fourth waves do not always end where a parallel channel shows they might (this is why Elliott had a second technique). The middle part of third waves do sometimes overshoot a parallel channel, as this one does, so this look is a bit odd but not completely unprecedented.
Wave 4 pink is very large and is larger than wave 2 black which is two degrees higher. This is a major detraction for this wave count.
If this wave count is correct we may reasonably expect to see steady upwards movement towards the target. If our main wave count is invalidated by upwards movement then we may more seriously consider this alternate.
While price remains above 1,129.24 this alternate will remain valid and we must be aware of its implications.