
Elliott Wave chart analysis for the S&P 500 for 22nd June, 2011. Please click on the charts below to enlarge.
The S&P 500 began Wednesday’s session with a little downwards movement as expected, ending 2.04 points below our short term target. Thereafter, we saw some upwards movement but it fell 3.98 points short of our next target. Downwards movement ended the session and this may be the larger fourth wave correction we were expecting to happen in another day or so.
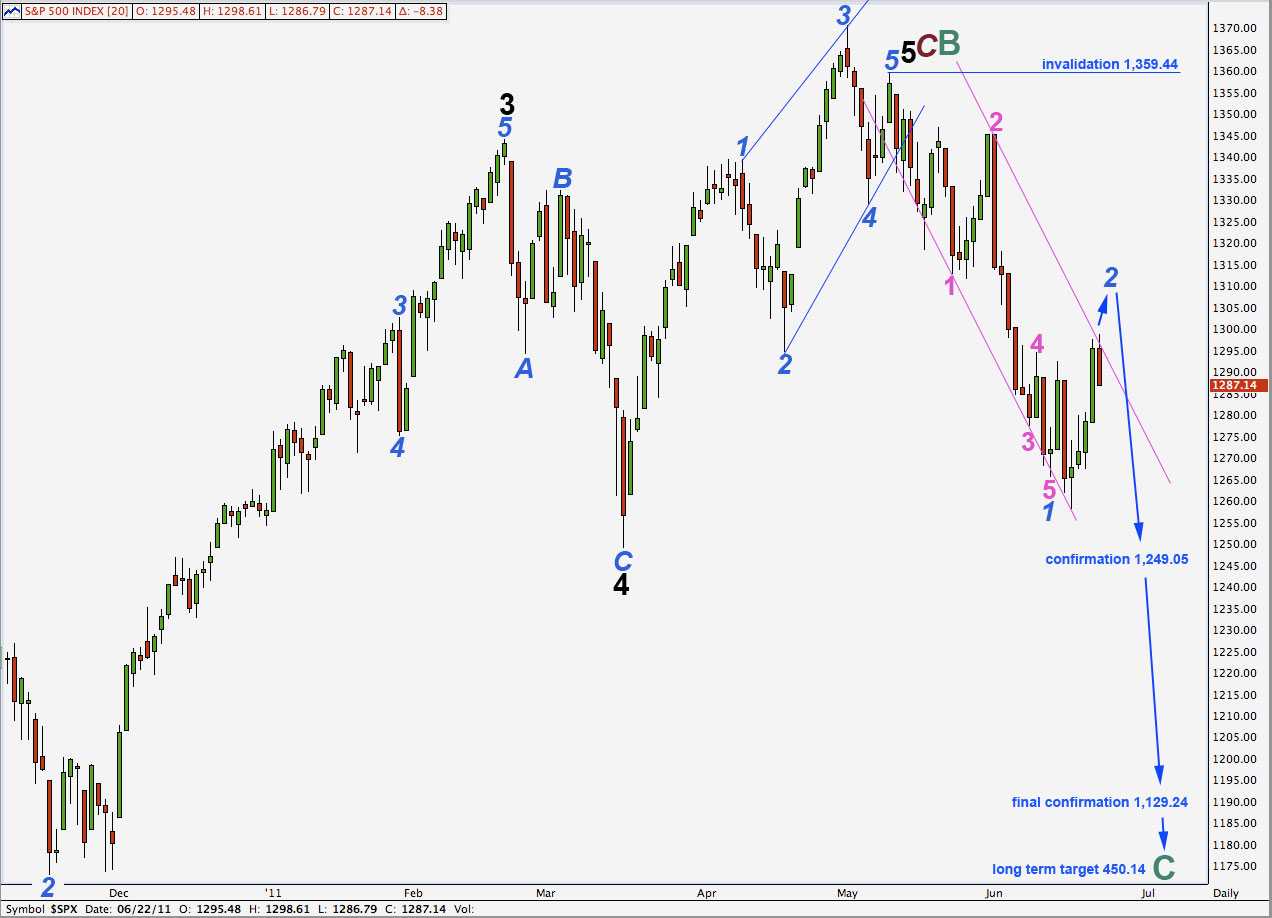
The structure of wave 2 blue is still incomplete. It is likely that we shall see further upwards movement before it is over. This should take price comfortably outside the parallel channel drawn here on the daily chart.
Wave 2 may not move beyond the start of wave 1 blue. This wave count is invalidated with movement above 1,359.44.
When wave 2 blue is complete we may expect the following wave to be a strong third wave down.
In the long term this wave count expects cycle wave C to last at least a year, if not several, and it may end at equality with cycle wave A about 450.14.
This is not the only possible wave count at this stage. We have an alternate which sees downwards movement as wave 4 black within primary wave C to end cycle wave B. Wave 4 black may not move into wave 1 black price territory. This alternate wave count would be invalidated with movement below 1,129.24. At that stage we may have full confidence that the S&P 500 is in a long term bear market.
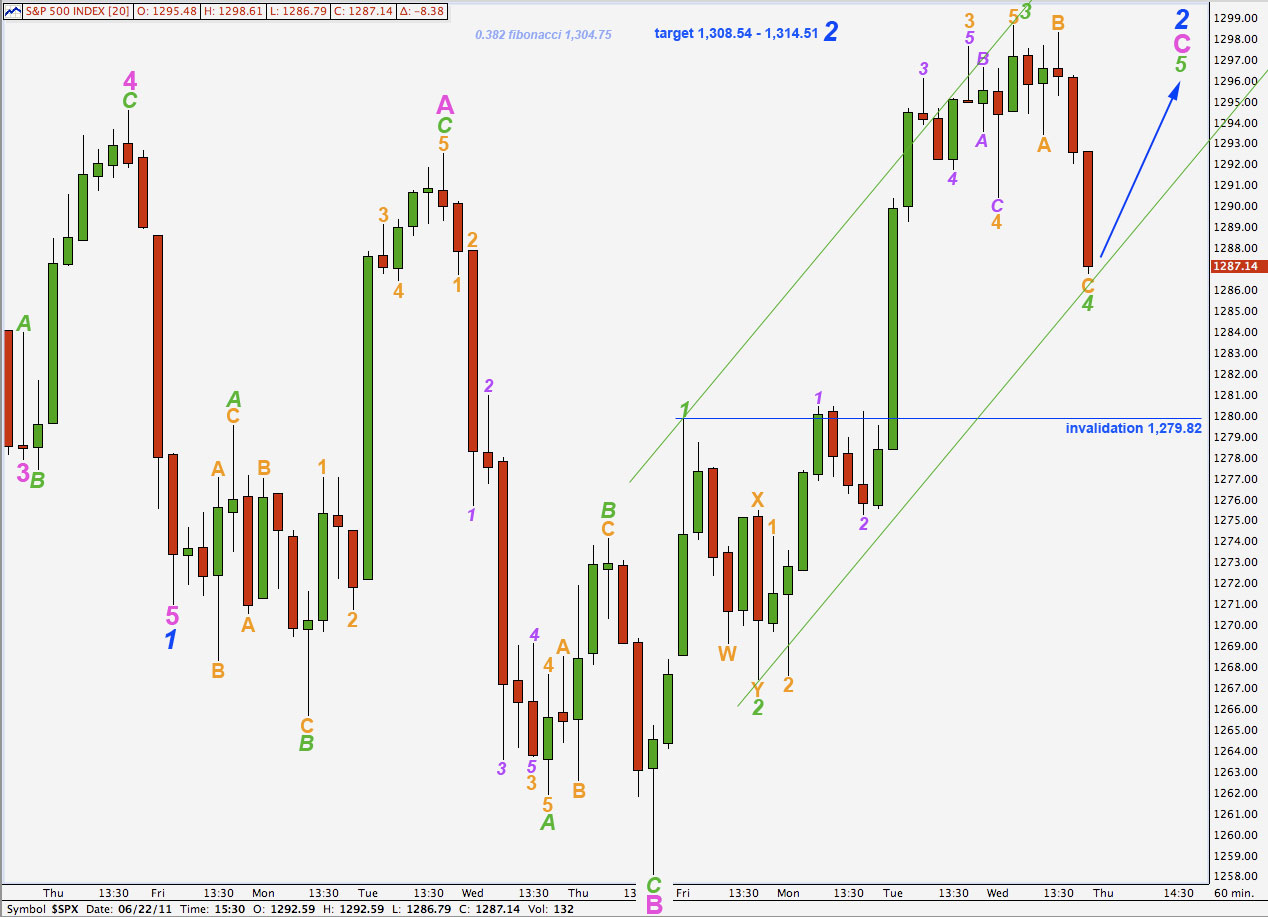
The target for wave 4 orange was at 1,292.53. Wave 4 orange ended 2.04 points below this target.
The target for the following wave 5 orange upwards to end wave 3 green was 1,302.59. This upwards movement ended 3.98 points short of the target.
Thereafter, the strong downwards movement is highly likely to be wave 4 orange within wave C pink.
Wave C pink is unfolding as a very typical looking impulse. It only requires one final upwards wave to end it.
Ratios within wave 3 green are: wave 3 orange is 1.3 points longer than 4.236 the length of wave 1 orange and wave 5 orange is 1.13 points longer than 0.236 the length of wave 3 orange.
Wave 3 green has no fibonacci ratio to wave 1 green. It is more likely then that the fifth wave will exhibit a ratio to either of 3 or 1.
Wave 4 green may have ended very close to the lower edge of the parallel channel drawn about the impulse for wave C pink. If it moves any lower it may reach to 1,284.62 where wave C orange would reach 2.618 the length of wave A orange and the fourth wave would have a slight overshoot of this trend channel. If it does that we may expect that a fifth wave overshoot on the opposite side of the channel is very likely.
If wave 4 green has ended here then wave 5 green will reach equality with wave 1 green at 1,308.54. This is the lower end of our target zone. If it is complete then there is no fibonacci ratio between waves A and C orange within 4 green.
Wave C pink of this expanded flat for wave 2 blue will reach 2.618 the length of wave A pink at 1,314.51. This is the upper end of our target zone.
Any further downwards movement of wave 4 green may not move into wave 1 green price territory. This wave count is invalidated with movement below 1,279.82.
If this wave count is invalidated with downwards movement tomorrow then it would be likely that wave 3 blue would be underway, and wave 2 blue may have been a simple zigzag from the low at 1,258.07 to the high 1,298.61.
It is difficult to see how the subdivisions of wave 1 blue could work as an impulse. Because I have not managed to chart this idea with satisfactory subdivisions I cannot present it to you. At this stage I cannot see how it could work and so the possibility that price will move below 1,279.82 before a fifth wave upwards is complete, is very low. That does not mean it is impossible, I just cannot see such a wave count at this stage.