
Elliott Wave chart analysis for the S&P 500 for 21st June, 2011. Please click on the charts below to enlarge.
As expected price has moved higher and is getting closer to our target for this second wave correction to end.
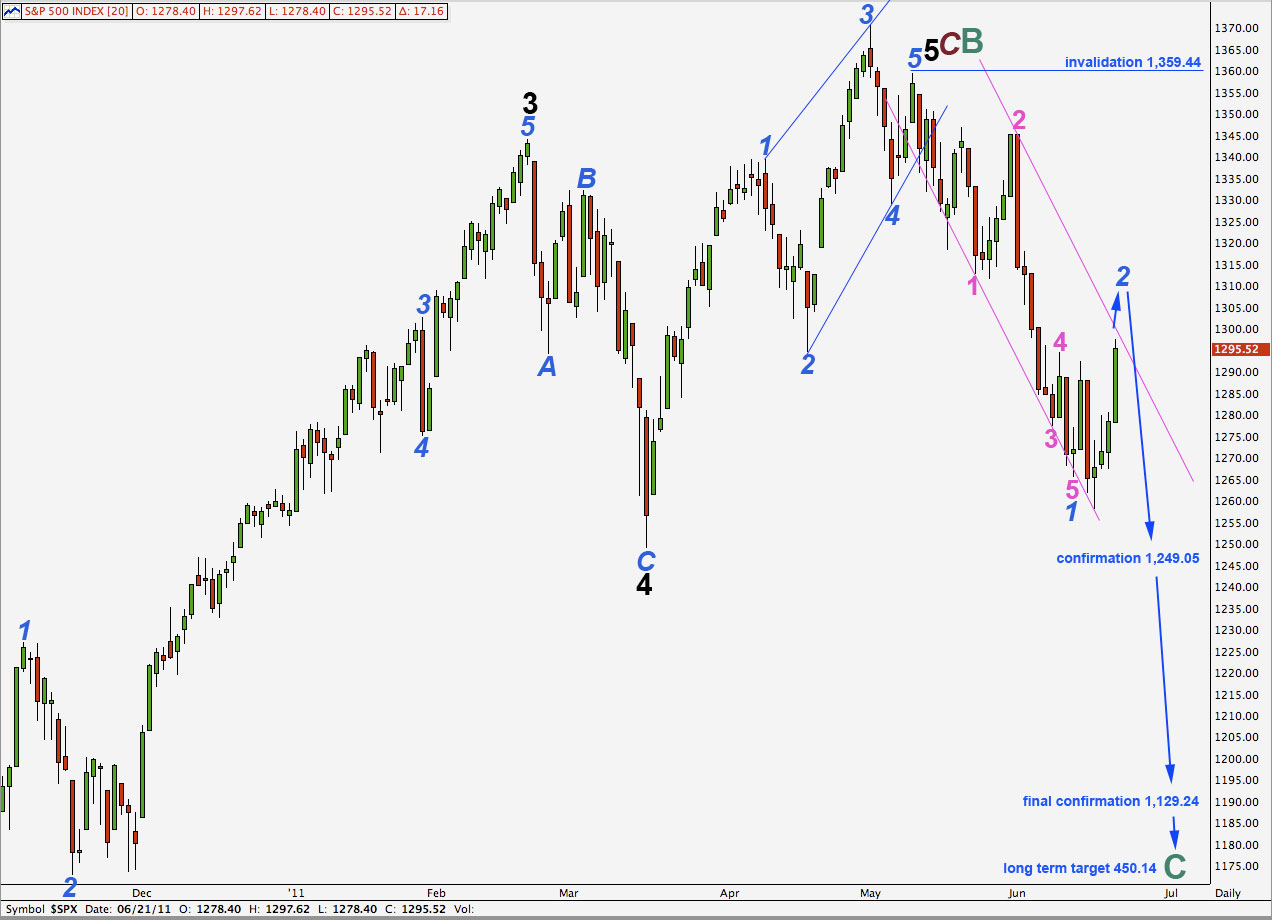
Wave 2 may not move beyond the start of wave 1 blue. This wave count is invalidated with movement above 1,359.44.
When wave 2 blue is complete we may expect the following wave to be a strong third wave down.
In the long term this wave count expects cycle wave C to last at least a year, if not several, and it may end at equality with cycle wave A about 450.14.
This is not the only possible wave count at this stage. We have an alternate which sees downwards movement as wave 4 black within primary wave C to end cycle wave B. Wave 4 black may not move into wave 1 black price territory. This alternate wave count would be invalidated with movement below 1,129.24. At that stage we may have full confidence that the S&P 500 is in a long term bear market.
Main Hourly Wave Count.
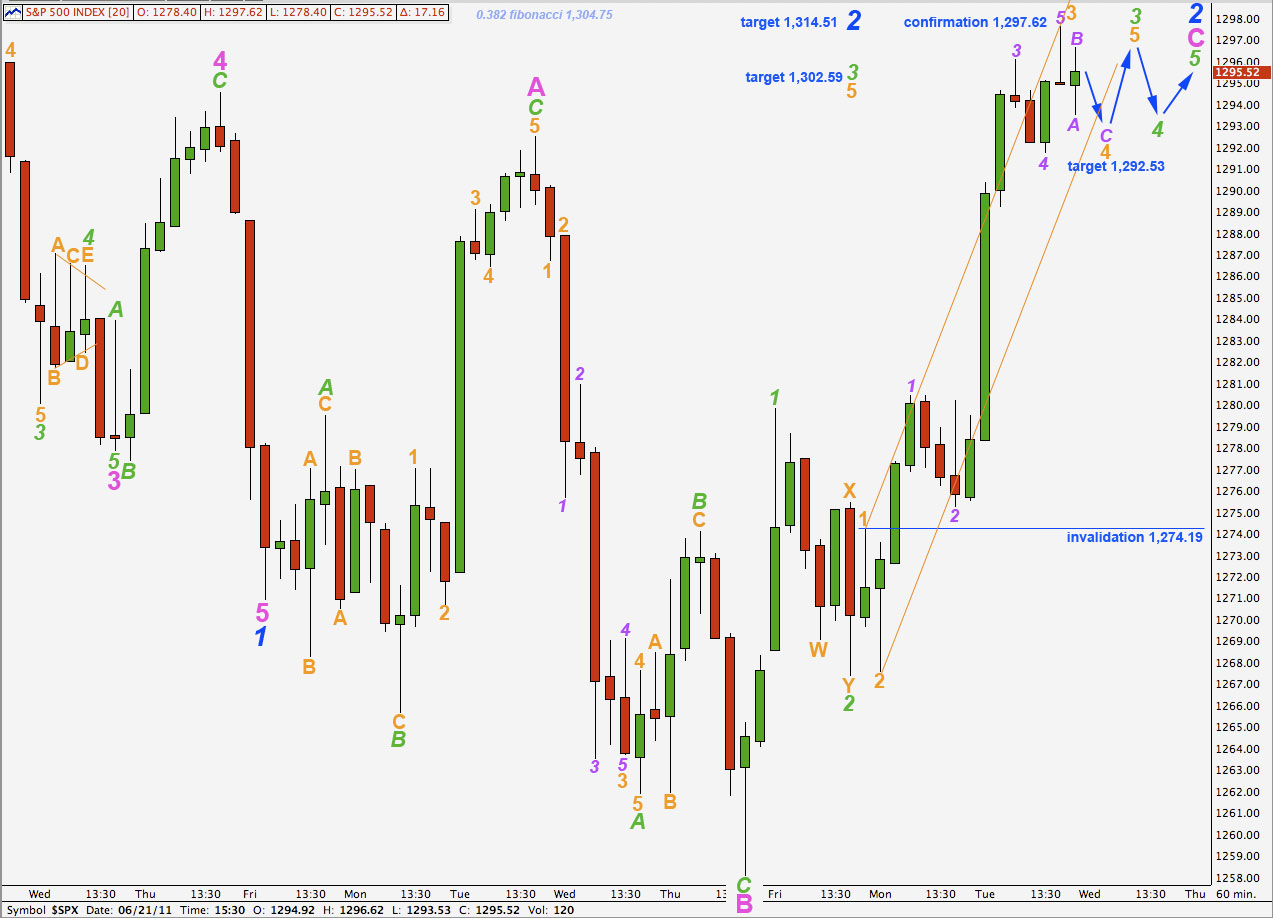
This main wave count has a higher probability than the alternate below because it has better fibonacci ratios and more common subdivisions.
Tuesday’s strong upwards movement is here labeled as the middle part of a third wave.
Within wave 3 green so far wave 3 orange is 1.3 points longer than 4.236 the length of wave 1 orange.
Ratios within wave 3 orange are: wave 3 purple is just 0.05 points longer than 1.618 the length of wave 1 purple and wave 5 purple is 0.95 points longer than 0.236 the length of wave 3 purple.
Within wave 4 orange wave A purple is a five wave structure on the 1 minute chart, and wave B purple is a completed zigzag. Wave C purple would reach equality with wave A purple at 1,292.53. Tomorrow’s session may start with a little downwards movement to end about this point.
Thereafter, this wave count requires three more waves to complete an impulse for wave C pink and so complete the expanded flat of wave 2 blue.
Wave 3 green will reach 1.618 the length of wave 1 green at 1,302.59. About this point we may see a fourth wave correction.
Wave C pink within wave 2 blue will reach 2.618 the length of wave A blue at 1,314.51.
Alternate Hourly Wave Count.
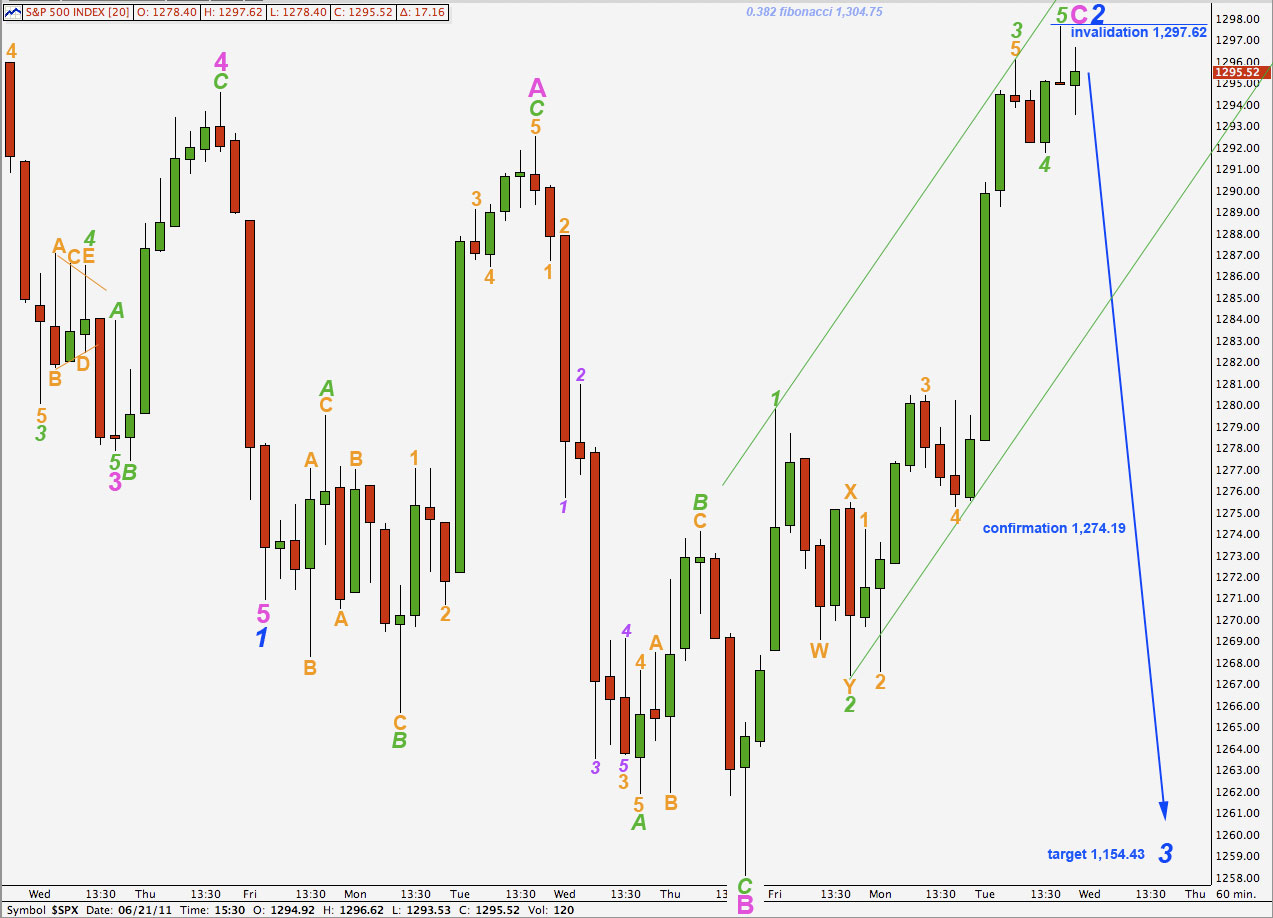
It is possible that wave 2 blue is over already.
For this wave count the extension is a fifth wave within wave 3 green. This is less common than the middle of the third wave being extended as for the main hourly wave count, and it does not fit with MACD which has the highest reading for this piece of movement suggesting it is a third wave and not a fifth. Therefore this wave count has a lower probability than the main hourly wave count.
If price moves below the lower edge of the parallel channel drawn here then this wave count must be seriously considered. It may be considered confirmed with movement below 1,274.19 as at that stage our main wave count would be invalidated.
Wave 3 blue will reach 1.618 the length of wave 1 blue at 1,154.43.
Ratios within wave 2 blue are: wave C pink has no adequate fibonacci ratio to wave A pink.
Ratios within wave C pink are: wave 3 green has no fibonacci ratio to wave 1 green and wave 5 green is 0.75 points longer than 0.236 the length of wave 1 green.
Ratios within wave 3 green of wave C pink are: wave 3 orange has no fibonacci ratio to wave 1 orange and wave 5 orange is just 0.05 points longer than 1.618 the length of wave 3 orange.
Any movement to a new high during tomorrow’s session above 1,297.62 would invalidate this alternate wave count. At that stage we should expect price to continue rising to targets on the main wave count.