
Elliott Wave chart analysis for the S&P 500 for 20th June, 2011. Please click on the charts below to enlarge.
As expected from last analysis the S&P 500 has moved higher.
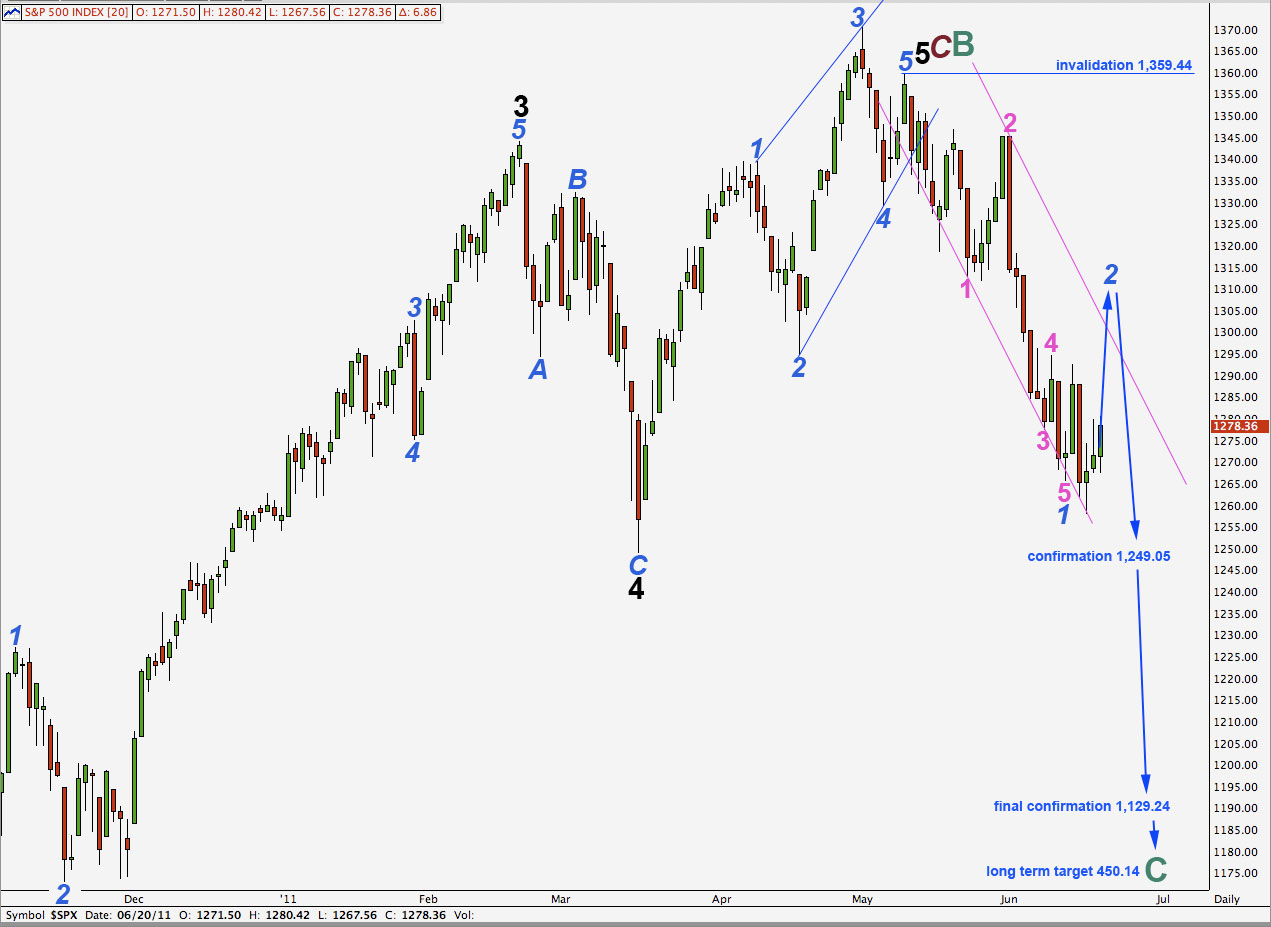
Wave 2 blue may be unfolding as an expanded flat correction. Wave 2 may not move beyond the start of wave 1 blue. This wave count is invalidated with movement above 1,359.44.
When wave 2 blue is complete we may expect the following wave to be a strong third wave down.
In the long term this wave count expects cycle wave C to last at least a year, if not several, and it may end at equality with cycle wave A about 450.14.
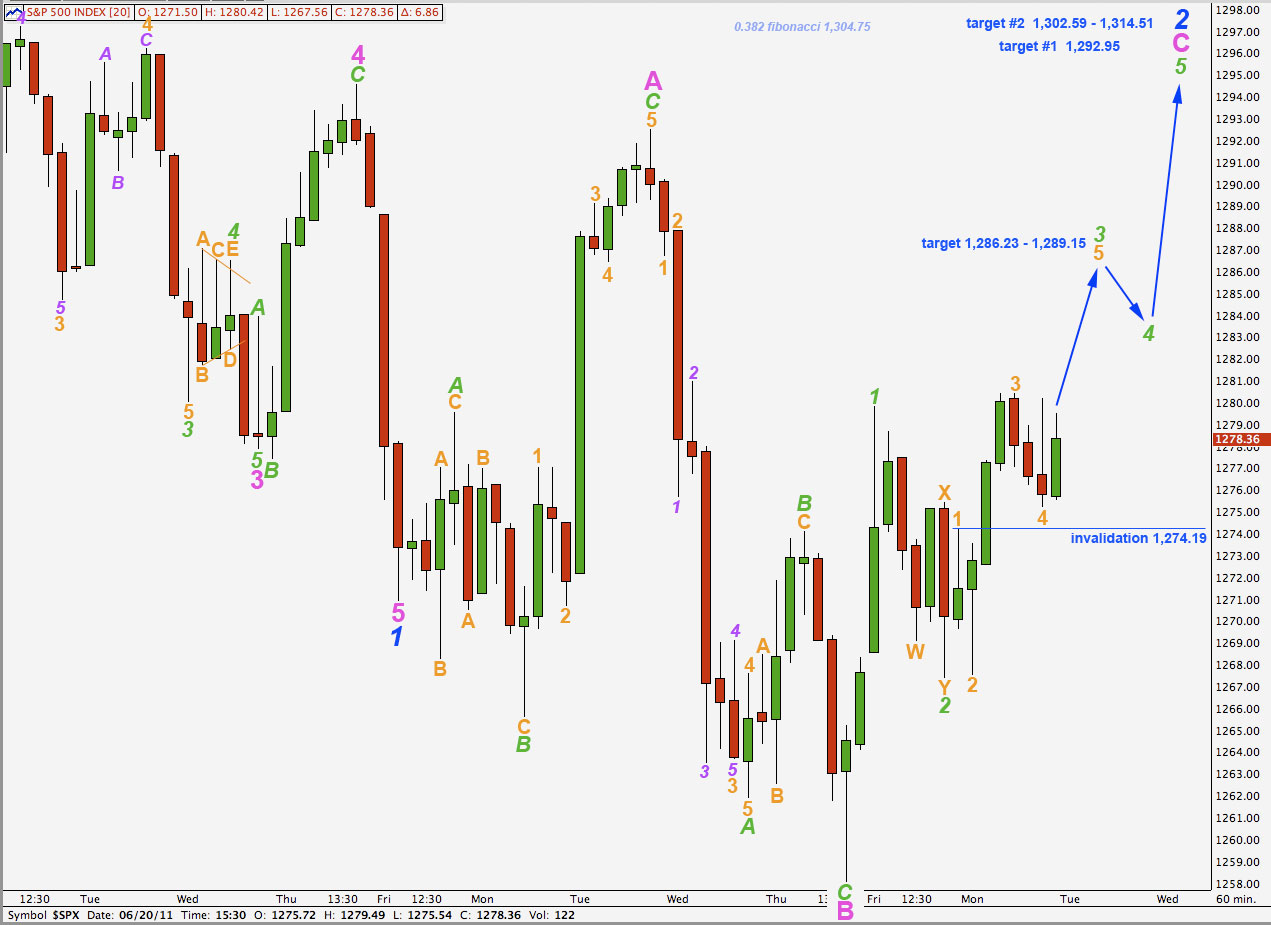
Wave C pink looks like it is unfolding as a simple impulse. The other structural option for a C wave is an ending diagonal which requires all subwaves to be zigzags, and wave 1 green is not a zigzag.
Wave 3 green requires a final fifth wave upwards to complete it. Wave 3 orange has no fibonacci ratio to wave 1 orange and so it is more likely then that wave 5 orange will exhibit a ratio to either of 3 or 1. Wave 3 green must move far enough above the end of wave 1 green to allow room for downwards movement for wave 4 green. So wave 5 orange is likely to reach equality with wave 3 orange at 1,286.23.
About this point we may see wave 4 green unfold. As wave 2 green was a relatively deep 57% correction of wave 1 green we may expect wave 4 green to be a shallow correction, less than 50% and most likely 0.382 of wave 3 green. Wave 2 green was a double zigzag and so wave 4 green is more likely to be a single structure, and probably a flat or triangle.
Targets for wave 2 blue are the same.
The first lower target 1,292.95 is where wave C pink would reach 1.618 the length of wave A pink.
At 1,314.51 wave C pink will reach 2.618 the length of wave A pink. At 1,302.59 wave 3 green would reach 1.618 the length of wave 1 orange. This second target is more likely than the first. It is also reasonably close to the 0.382 fibonacci ratio of wave 1 blue at 1,304.75.
Any further extension of wave 4 orange when markets open tomorrow may not move into wave 1 orange price territory. This wave count is invalidated with movement below 1,274.19.
If this wave count is invalidated with downwards movement then we shall use the alternate below.
Alternate Hourly Wave Count.
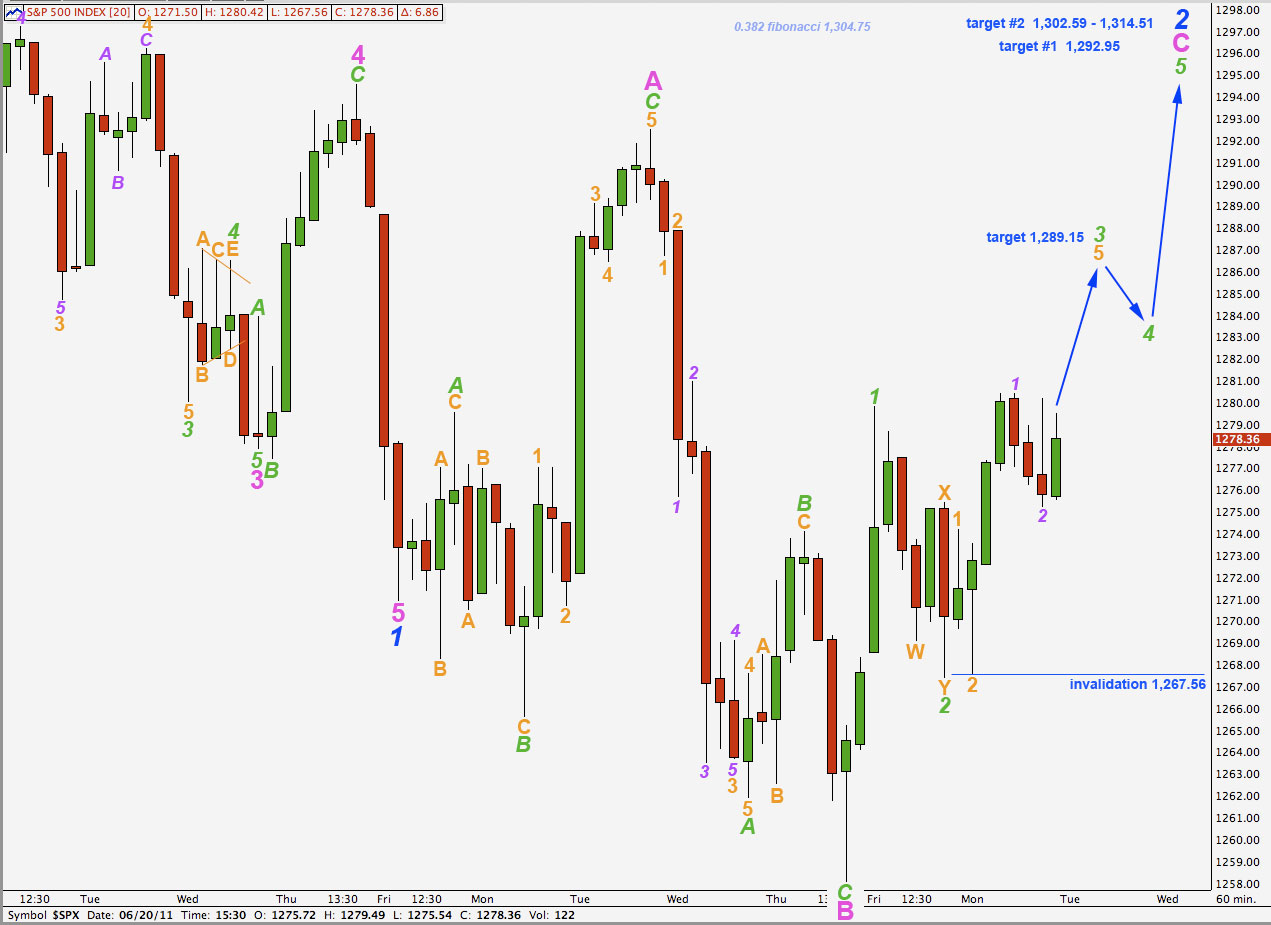
Wave 3 orange within wave 3 green may be developing as an extension.
Wave 2 purple may not move beyond the start of wave 1 purple. This wave count is invalidated with movement below 1,267.56.
Targets are exactly the same for this wave count as the main.