
Elliott Wave chart analysis for the S&P 500 for 16th June, 2011. Please click on the charts below to enlarge.
Price has moved a little lower as expected. All three of our hourly wave counts remain valid.
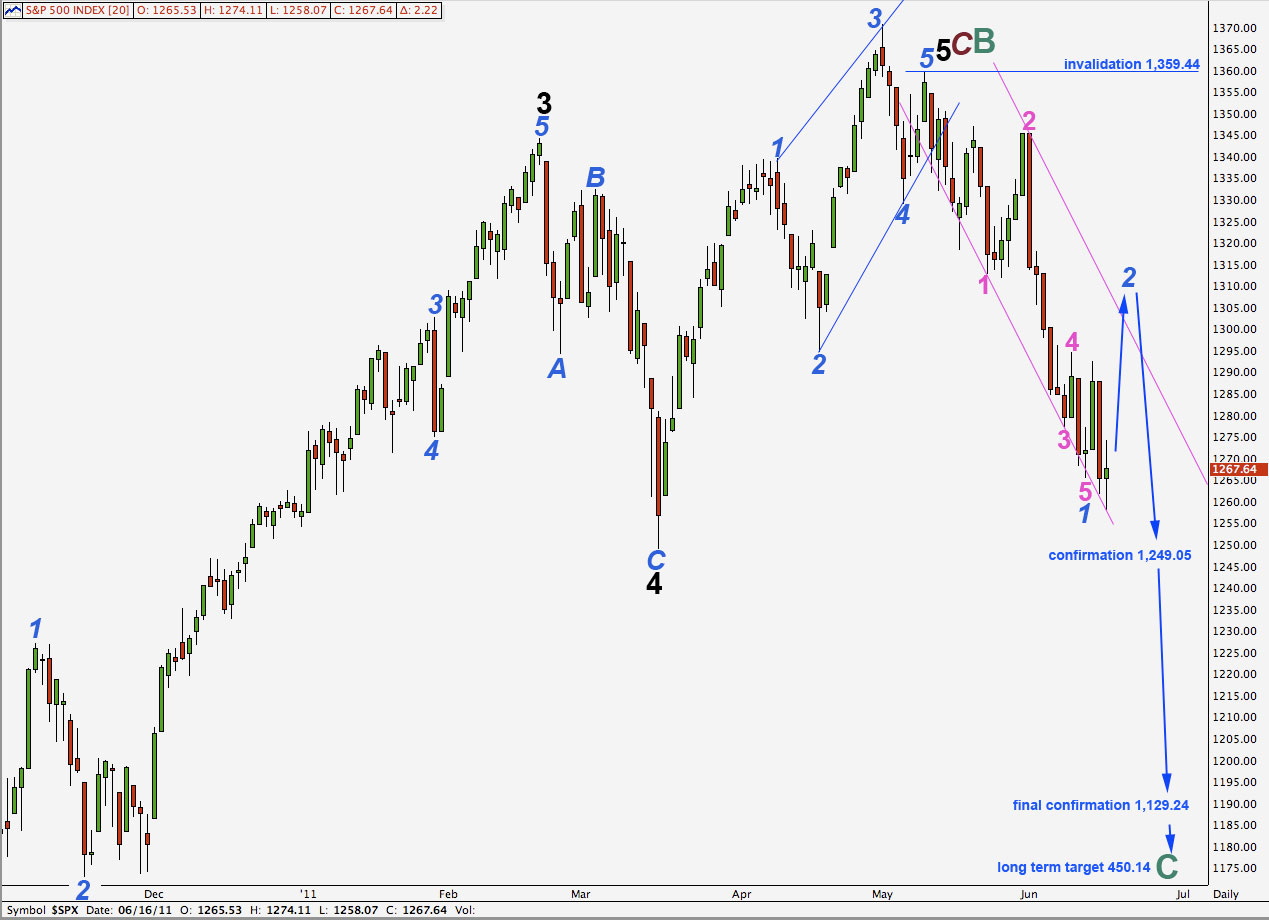
In the mid term, when this second wave correction is over, we would expect the next wave down to be a strong third wave. At that stage we will be looking closely at wave behaviour. If it matches with our expectations for this wave count then its probability will increase. If it does not match for this wave count then we must more seriously consider our alternates.
Movement below 1,249.05 will confirm that wave 5 black for this wave count must be over.
Movement below 1,129.24 will eliminate any alternate which saw this downwards movement as still a fourth wave at black degree within the impulse for primary wave C. At that stage we would be very confident that the S&P 500 is in a longer term bear market.
While price remains above these levels we must understand that the possibility that price could turn back upwards and make new highs does remain.
In the long term this wave count expects cycle wave C to last at least a year, if not several, and it may end at equality with cycle wave A about 450.14.
Hourly Wave Count 1.
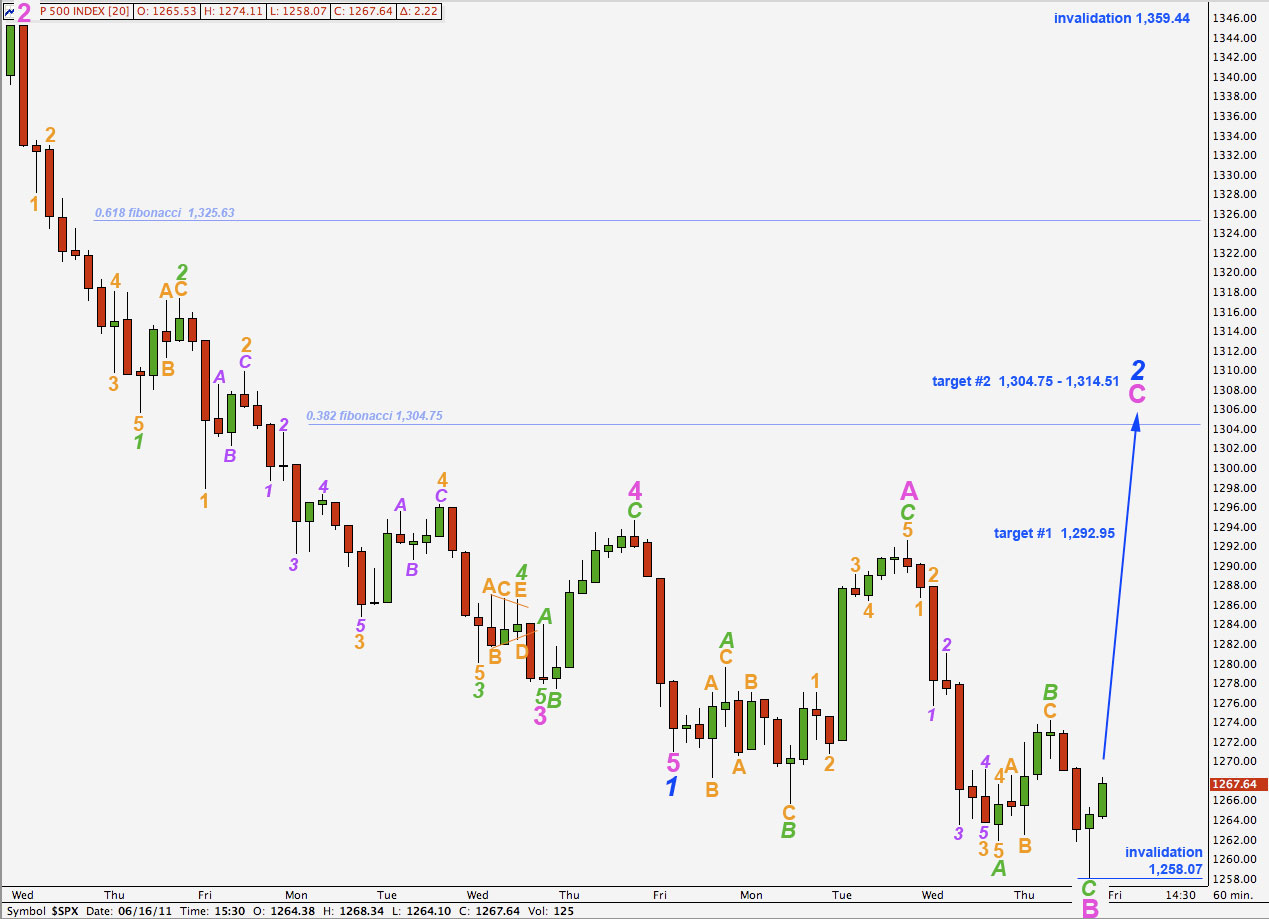
Yesterday’s target for downwards movement to end was at 1,257.62 for this wave count. Price fell just 0.45 points short of this target at 1,258.07.
This wave count remains the most likely. If wave 2 blue is unfolding as an expanded flat correction then we have most likely just begun on wave C pink upwards.
At 1,292.95 wave C pink would reach 1.618 the length of wave A pink. This is our first, less likely, target for upwards movement to end.
At 1,314.51 wave C pink would reach 2.618 the length of wave A pink. This is somewhat close to the 0.382 fibonacci ratio of wave 1 blue which is at 1,304.75 and so this gives us a target zone of 1,304.75 to 1,314.51 for the second, more likely, target.
Wave C pink is extremely likely to at least reach the end of wave A pink at 1,292.50 as failure to do so would see this structure a rare running flat. If downwards pressure remains very strong we may see a running flat again, but the rarity of this structure means the probability that upwards movement will reach 1,292.50 is high.
Wave 2 blue may not move beyond the start of wave 1 blue. This wave count is invalidated with movement above 1,359.44.
Hourly Wave Count 2.
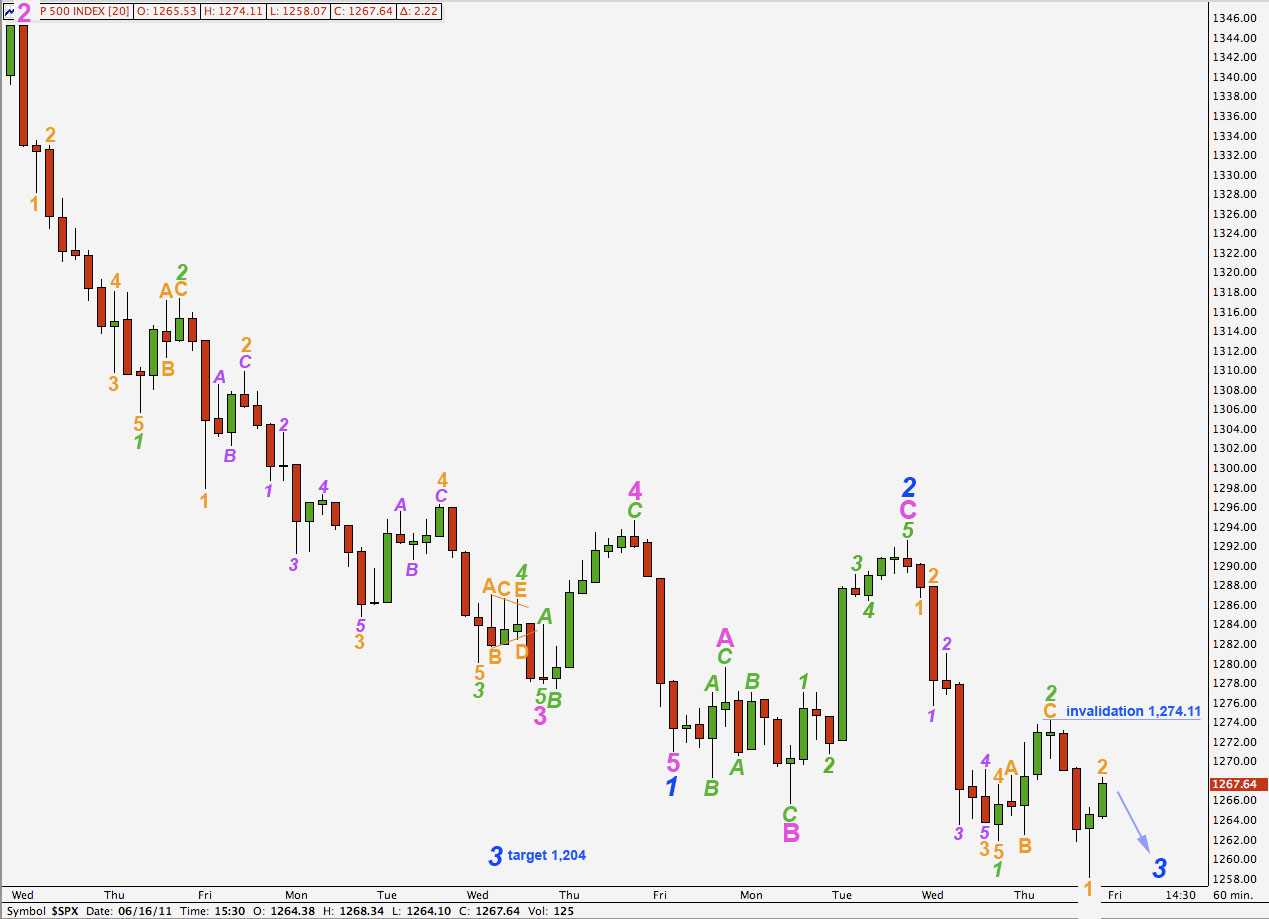
This wave count remains less likely than the first.
If this wave count is correct then we should see an increase in downwards momentum as this third wave develops. So far the momentum to the downside is waning which does not fit with this wave count and so reduces its probability.
The target for wave 3 blue remains the same. At 1,204 it would reach equality with wave 1 blue.
Wave 2 orange may not move beyond the start of wave 1 orange. This wave count is invalidated with movement above 1,274.11.
Hourly Wave Count 3.
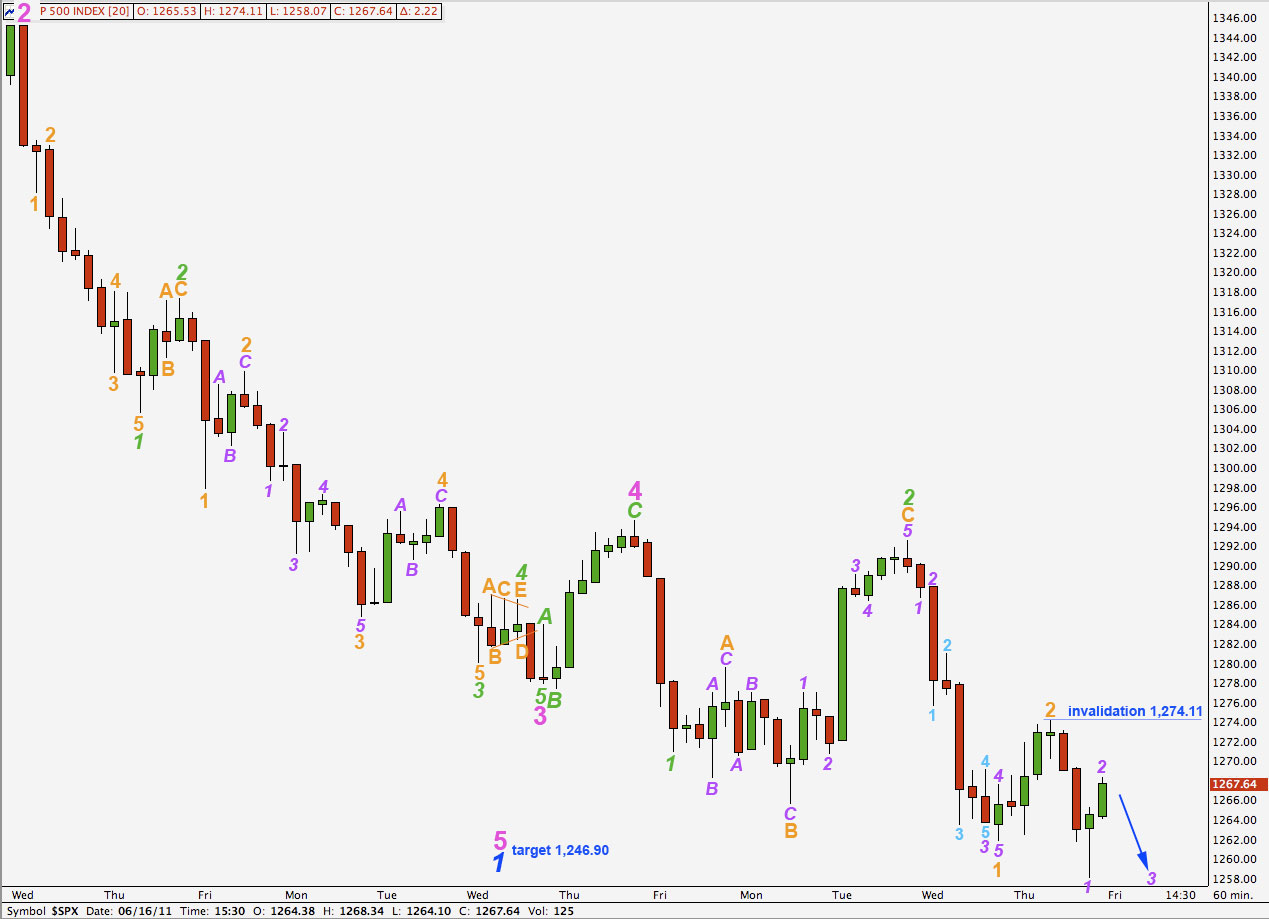
If this wave count is correct then we need to see some strong downwards movement tomorrow as a third wave within a third wave within a third wave within wave 5 blue unfolds.
With waning momentum this seems very unlikely.
The mid term target remains the same. At 1,246.90 wave 5 pink will reach equality with wave 1 pink.
For this wave count this fifth wave cannot be unfolding as an ending diagonal. That requires all subwaves to be zigzags and the problem with that is the wave labeled C orange of 2 green which may not be seen as a zigzag.
The only other structure allowable within a fifth wave is an impulse as labeled here.
Wave 2 purple may not move beyond the start of wave 1 purple. This wave count is invalidated with movement above 1,274.11.