
Elliott Wave chart analysis for the S&P 500 for 15th June, 2011. Please click on the charts below to enlarge.
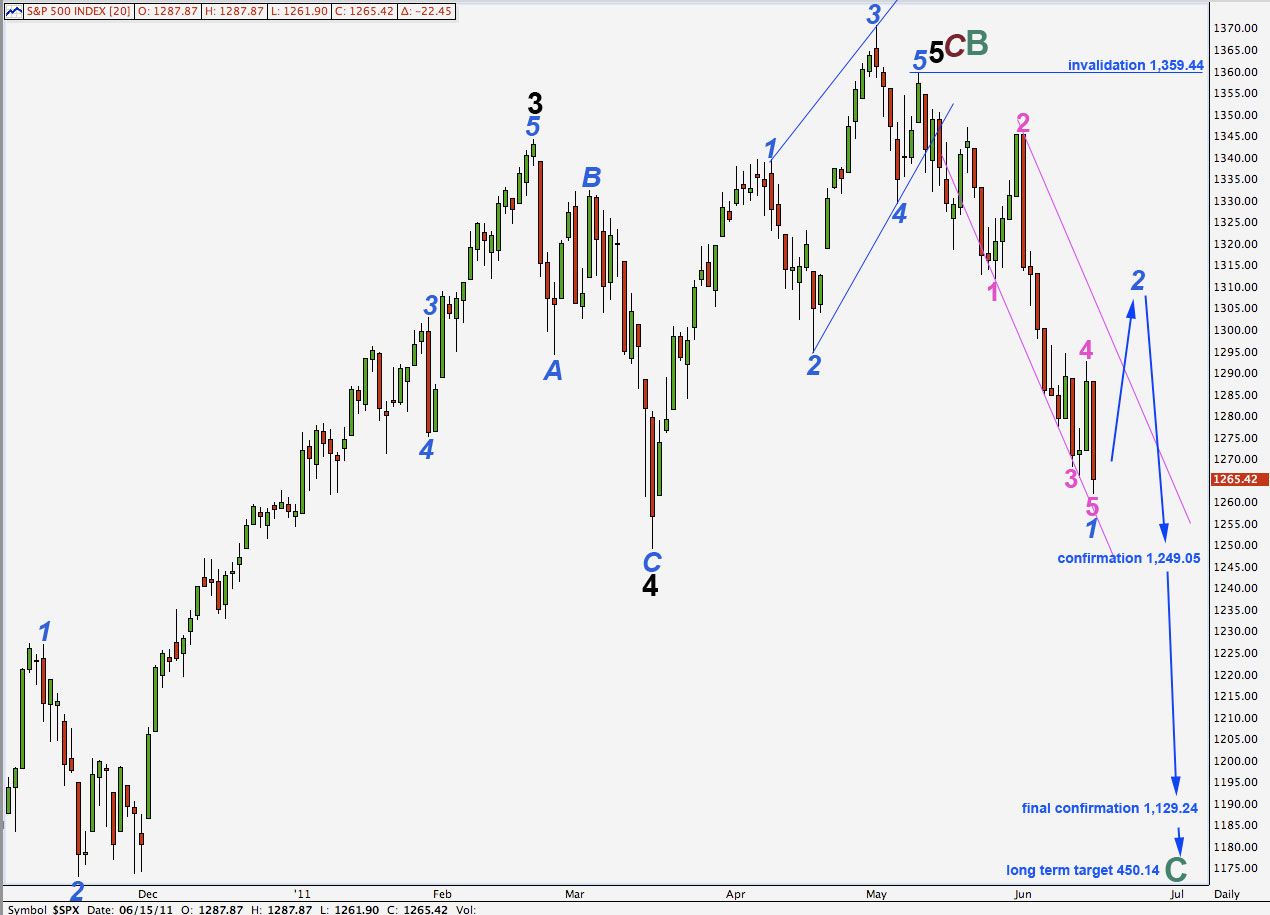
As expected after yesterday’s analysis the S&P has moved lower.
In the long term it is likely that cycle wave C will reach equality with cycle wave A at 450.14. Cycle wave C should take at least a year, if not longer, to complete.
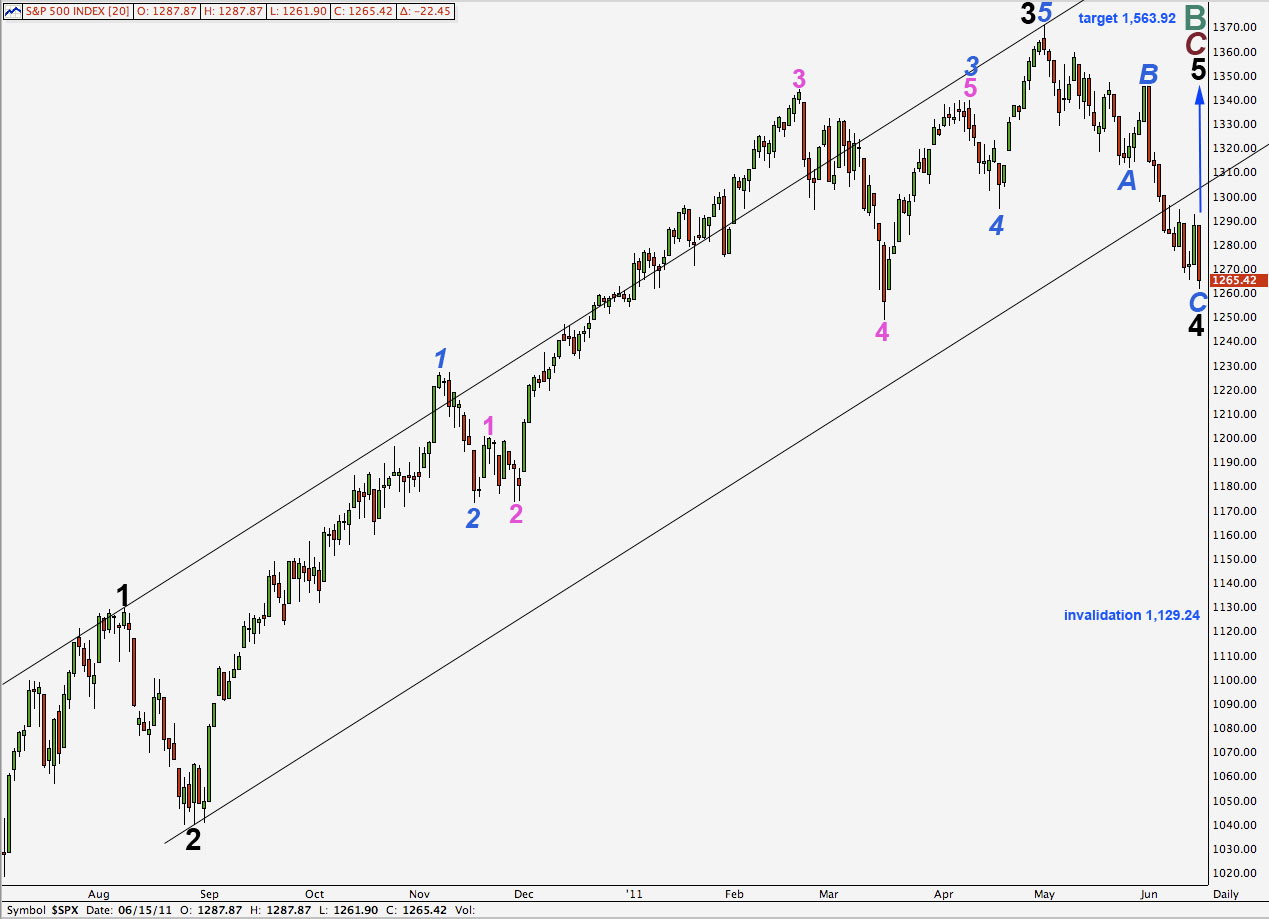
Wave 2 blue may not move beyond the start of wave 1 blue. This wave count is invalidated with movement above 1,359.44.
I have a new alternate idea to present at the end of this analysis. In order to compare fibonacci ratios for it and this main count I reproduce the main wave count fibonacci ratios below.
Cycle wave B ending with a truncation at 1,359.44 is a 76% correction of cycle wave A.
Within cycle wave B primary C is just 6.77 points short of 0.618 the length of primary wave A.
Ratios within cycle wave B are: black wave 3 is 5.42 points short of 2.618 the length of black wave 1 and black wave 5 is 7.94 points short of equality with black wave 1. Even if these black waves do not look like they have a typical look on the daily chart their ratios are very typical for an impulse.
Ratios within black wave 3 are: blue wave 3 has no fibonacci ratio to blue wave 1 and blue wave 5 is just 2.61 points short of 0.382 the length of blue wave 1.
My biggest problem with this wave count is the subdivisions of waves 1 and 3 blue within the ending contracting diagonal for wave 5 black. They should be zigzags and they look more like impulses.
Hourly Wave Count 1.
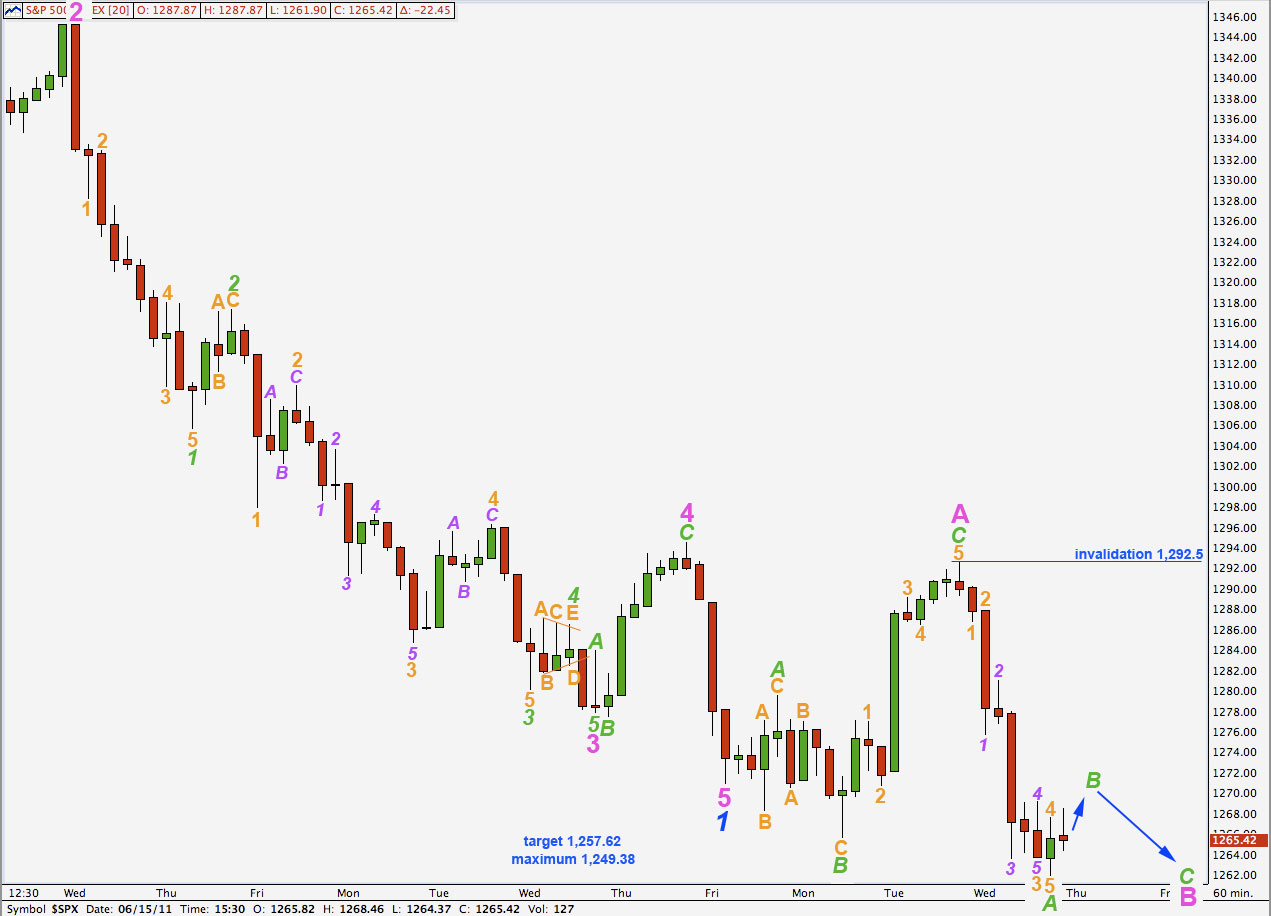
Downwards movement which we expected for Wednesday’s session has reached 0.85 points below the lower target expectation for this main wave count.
Downwards movement is a clear five wave impulse with an extended third wave. Subdivisions are very clear on a 5 minute chart and this was used for labeling this movement.
Ratios within wave A green are: wave 3 orange is just 0.15 points longer than 4.236 the length of wave 1 orange and wave 5 orange is just 0.07 points short of equality with wave 1 orange.
Ratios within wave 3 orange of wave A green are: wave 3 purple has no fibonacci ratio to wave 1 purple and wave 5 purple is 0.74 points longer than 0.382 the length of wave 1 purple.
This cannot be wave B pink complete; it can only be wave A green of wave B pink which would be unfolding as a zigzag. Wave B green may not move beyond the start of wave A green. This wave count is invalidated with movement above 1,292.5.
When wave B pink is complete it will be longer than 138% the length of wave A pink (unless it ends with a truncated C wave which is unlikely). The depth of this B wave in relation to wave A pink reduces the probability of this wave count. However, it is still the most likely of our three hourly wave counts at this stage. We would expect wave 2 blue to breach the small pink channel drawn here about wave 1 blue.
Hourly Wave Count 2.
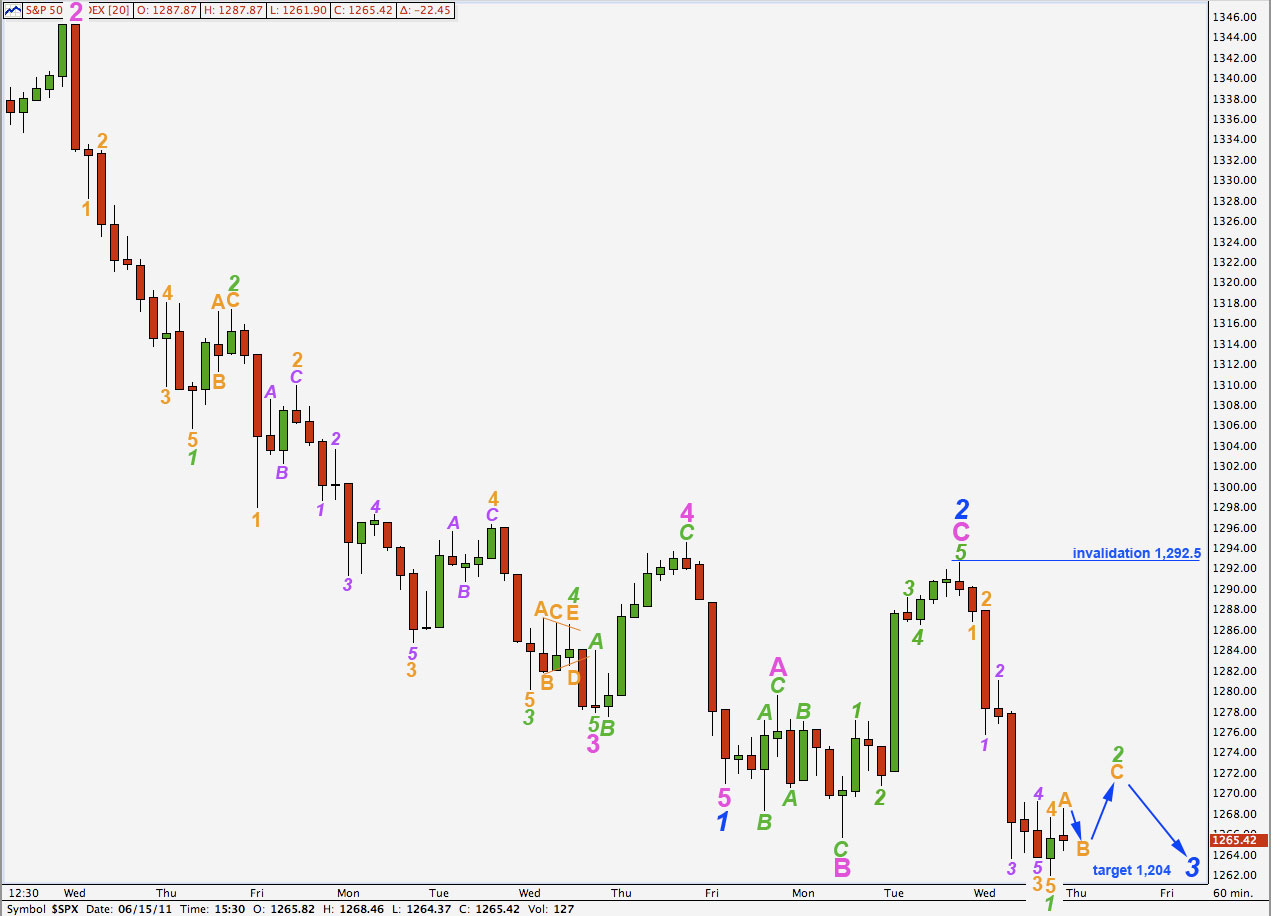
This wave count remains less likely than the first primarily because wave 2 blue has no breached a trend channel which contains wave 1 blue downwards.
Wave 2 green may not move beyond the start of wave 1 green. This wave count is invalidated with movement above 1,292.5.
It expects exactly the same movement next. A small upwards correction followed by further downwards movement.
Hourly Wave Count 3.
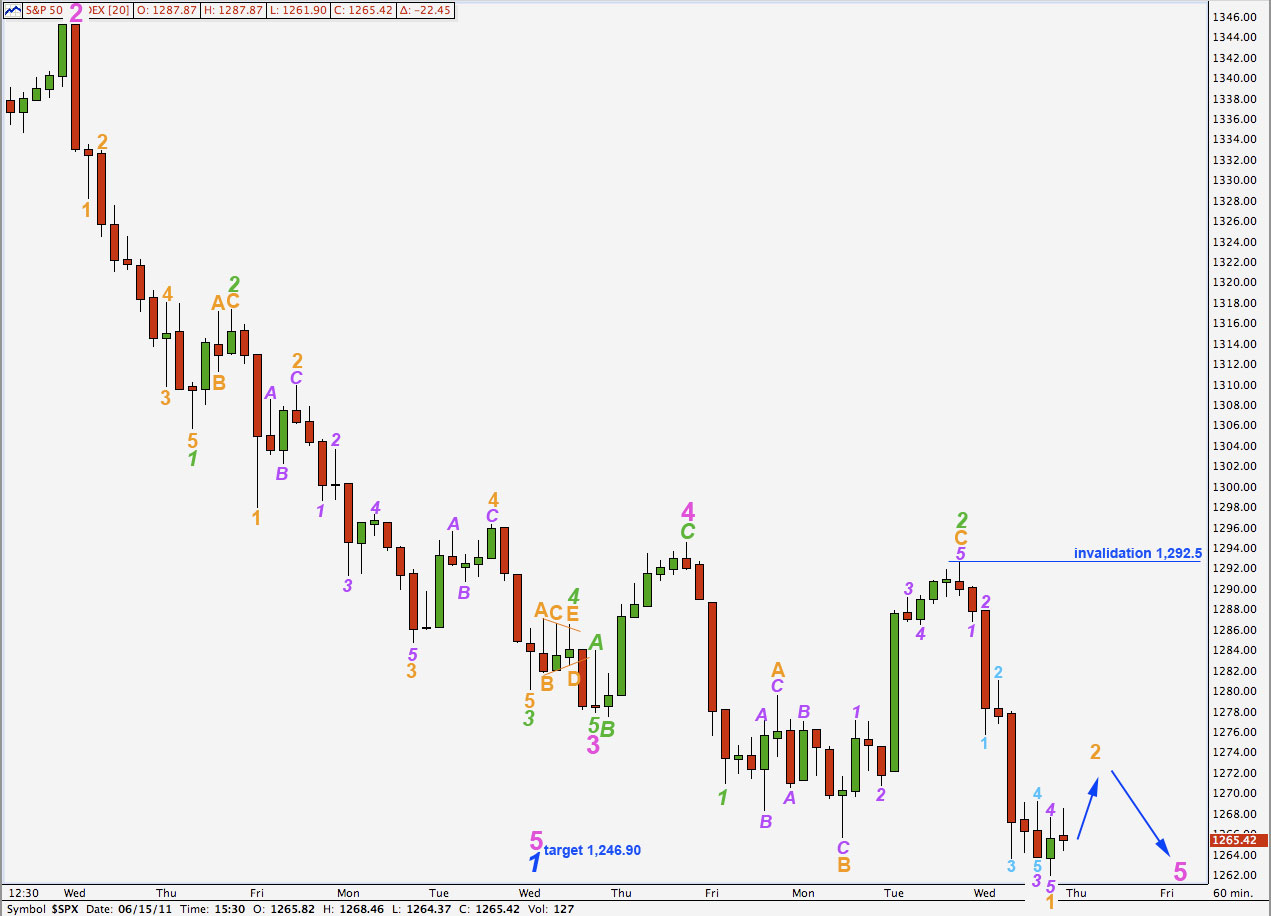
This wave count looks unlikely, it does not really have the right look.
However, at wave degrees well below minor we cannot always expect waves of the same degree to be in proportion, and so we must consider this possibility.
It expects exactly the same movement next and so there is no divergence in the expectations for our three wave counts, with the exception that the second and third are expecting more and stronger downwards movement than the first.
Alternate Daily Wave Count.
Thanks to Jack Cyrul for emailing me his chart which showed wave 3 black ending at this point.
This wave count removes the problem that the main wave count has that the ending diagonal for wave 5 black does not appear to have correct subdivisions.
However, this wave count has its own detractions.
Wave 3 black looks a bit strange. This is the biggest detraction for this wave count.
Wave 3 blue ends in a small truncation (this is only a slight detraction though).
Ratios within primary wave C are: wave 3 black is 21.09 points longer than 2.618 the length of wave 1 black (a 6.3% variation). This is an okay fibonacci ratio, but not as good as the main wave count.
Ratios within wave 3 black are: wave 3 blue has no fibonacci ratio to wave 1 blue and wave 5 blue is 4.3 points longer than 0.382 the length of wave 1 blue.
Ratios within wave 3 blue within wave 3 black are: wave 3 pink is 14.42 points short of 6.854 the length of wave 1 pink and there is no ratio between wave 5 pink and either of 3 or 1.
Overall the ratios for this wave count are not as good as the main wave count.
The trend channel has a reasonable breach, but fourth waves do not always end where a trend channel shows they should. It is possible for wave 4 black to be over here. It is not too far out of proportion to wave 2 black to be reasonable.
Wave 4 black may not move into wave 1 black price territory. This wave count is invalidated with movement below 1,129.24.