
Elliott Wave chart analysis for the S&P 500 for10th June, 2011. Please click on the charts below to enlarge.
The S&P moved lower during Friday’s session, which we had expected, but we had expected it was unlikely to make a new low which it did.
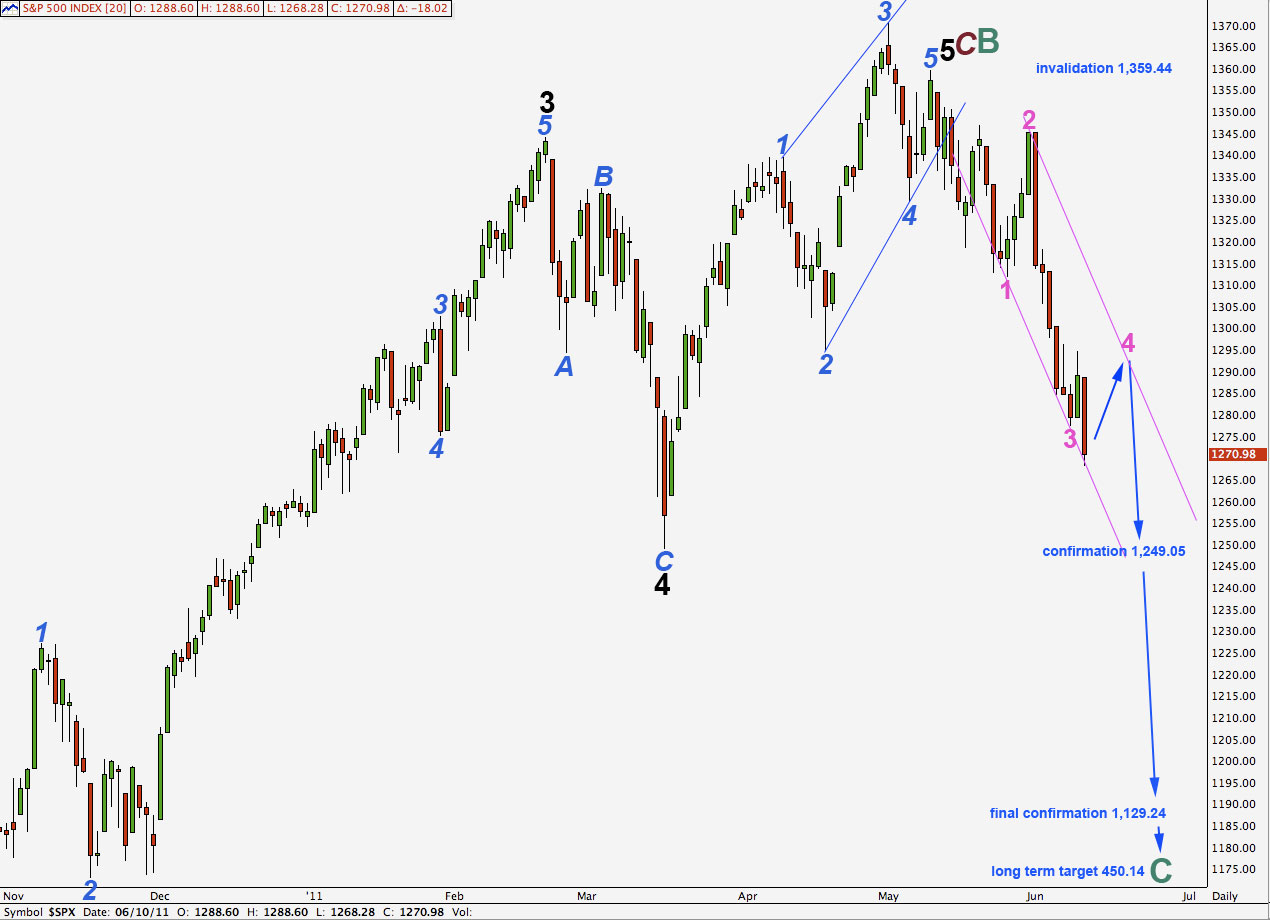
In the long term it is likely that cycle wave C will reach equality with cycle wave A at 450.14. Cycle wave C should take at least a year, if not longer, to complete.
Further movement below 1,249.05 would increase the probability of this bear market. At that stage a very unlikely alternate which saw downwards movement as a second wave correction within wave 5 black would be invalidated.
Finally, movement below 1,129.24 would invalidate the one remaining alternate bullish wave count and so give us a lot of confidence that the S&P is in a bear market.
Any second wave correction (at blue degree) may not move beyond the start of its first wave. This wave count is invalidated with movement above 1,359.44.
We may now draw a trend channel about wave 1 blue down. If wave 4 pink is incomplete (our main hourly wave count) it may end about the upper edge of this channel. If wave 4 pink is complete then we may expect wave 5 pink to end about the lower edge of this channel, or possibly midway in the channel.
Main Hourly Wave Count.
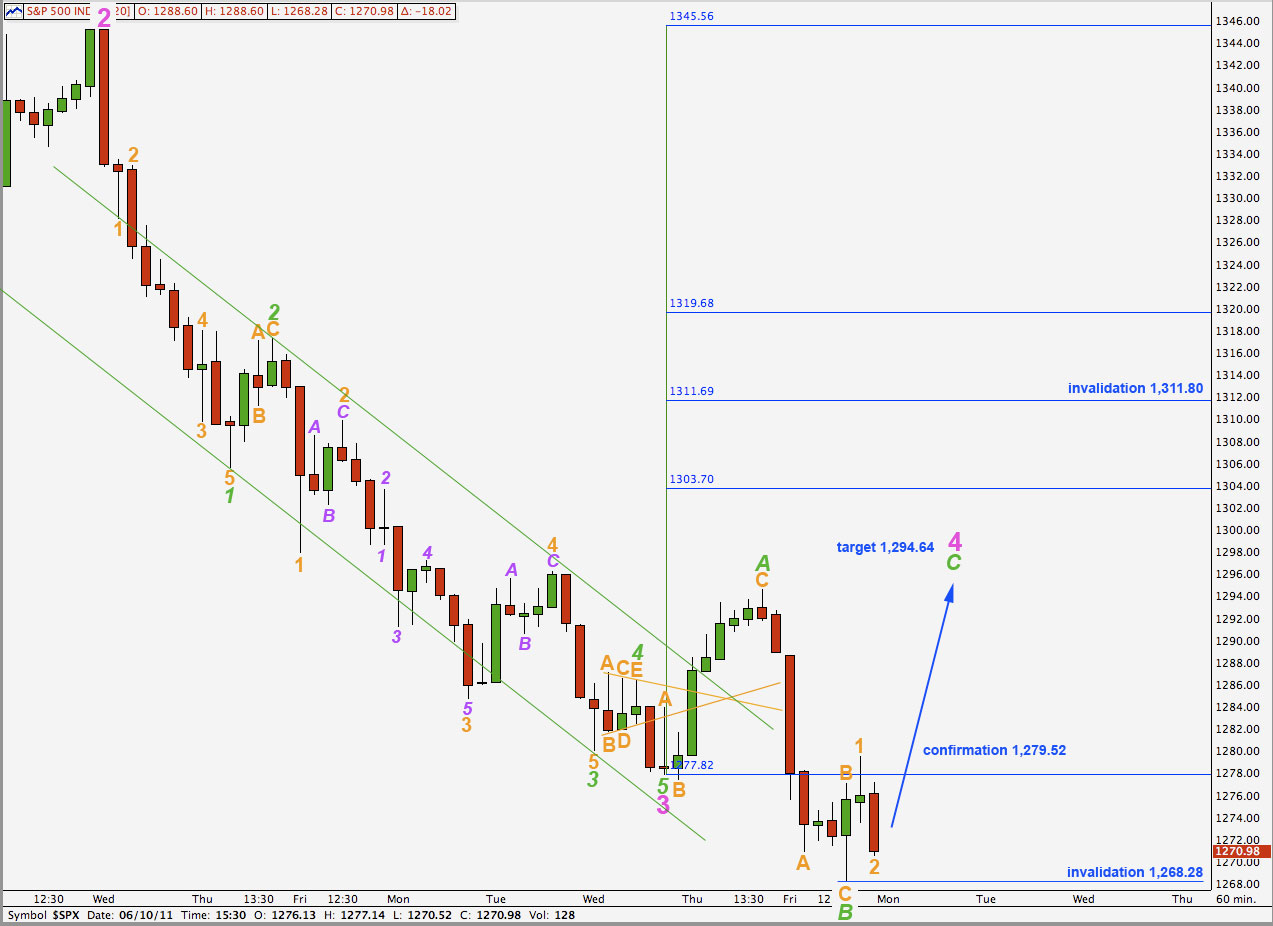
By looking at the end of wave 3 pink a little differently we can see that wave 4 pink may be unfolding as a flat correction. It may also yet unfold as a running triangle, but that would be less likely as it is a rarer structure than a flat.
Looking at wave 5 green to end wave 3 pink carefully on a 5 minute chart sees it may have ended at 1,278.25. Following this low we can see an expanded flat correction labeled here wave A green. Wave A within wave 4 pink may have unfolded as a three wave structure which is required for a flat correction.
At 1,294.64 wave C green within wave 4 pink will reach 1.618 the length of wave A green.
Within wave C green wave 2 orange may not move beyond the start of wave 1 orange. This wave count is invalidated with movement below 1,268.28.
Alternate Hourly Wave Count.
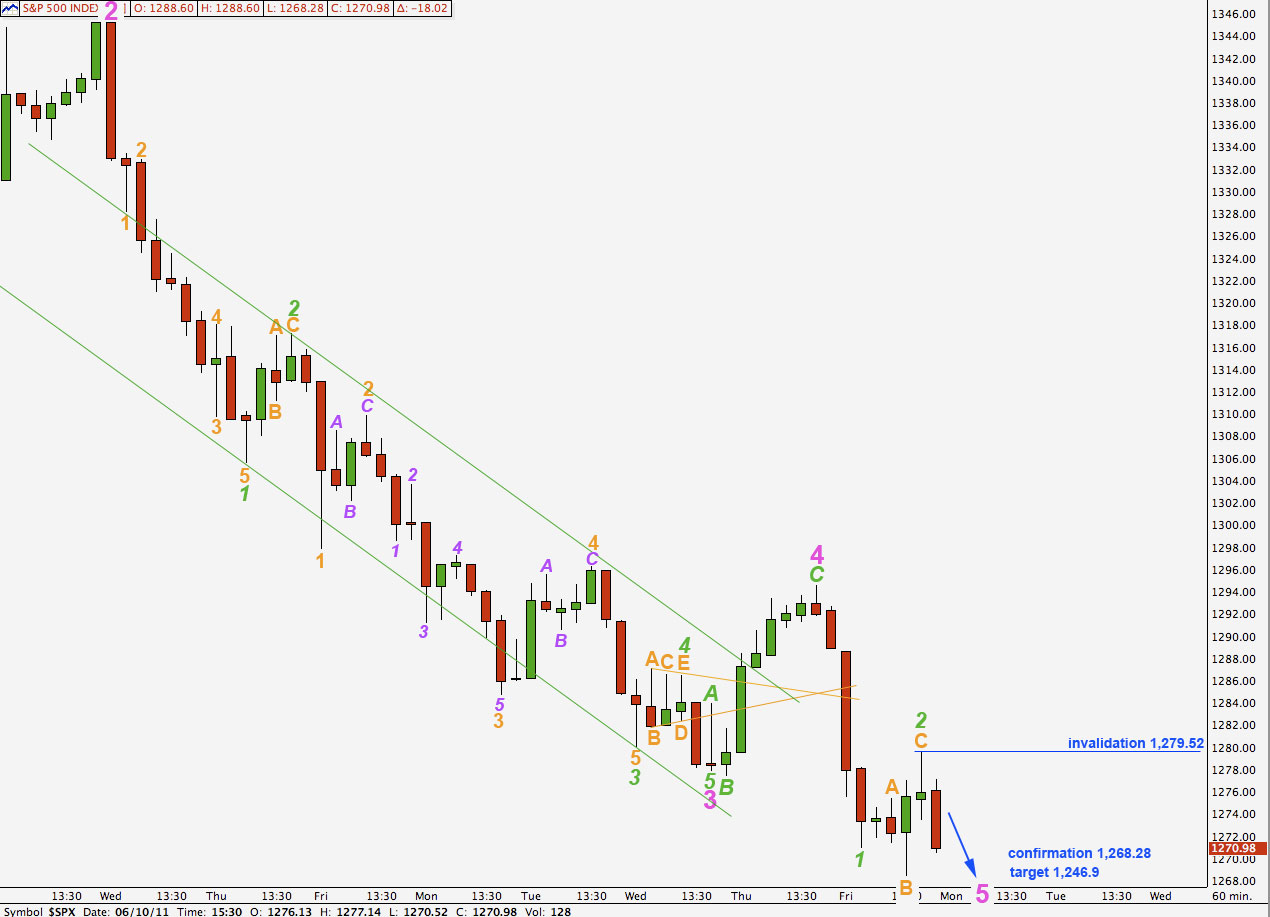
If we simply move the degree of labeling within the three wave structure labeled here 4 pink up one degree, we may already have an end to wave 4 pink and be within a final fifth wave downwards.
Wave 2 pink lasted 4 days and was a deep zigzag correction of wave 1 pink. Wave 4 pink for this wave count lasted 2 days and was a shallow flat correction of wave 3 pink. The guideline of alternation is achieved very nicely with this wave count both in terms of depth and structure.
Wave 3 pink has no fibonacci ratio to wave 1 pink. It is more likely then that wave 5 pink will exhibit a relationship to either of 3 or 1, and equality with 1 is the most common. This would be achieved at 1,246.90 and so for this wave count is the most likely target for wave 5 pink to end.
Within wave 3 green any second wave correction may not move beyond the start of its first wave. This wave count is invalidated with movement above 1,279.52.