
Elliott Wave chart analysis for the S&P 500 for 9th June, 2011. Please click on the charts below to enlarge.
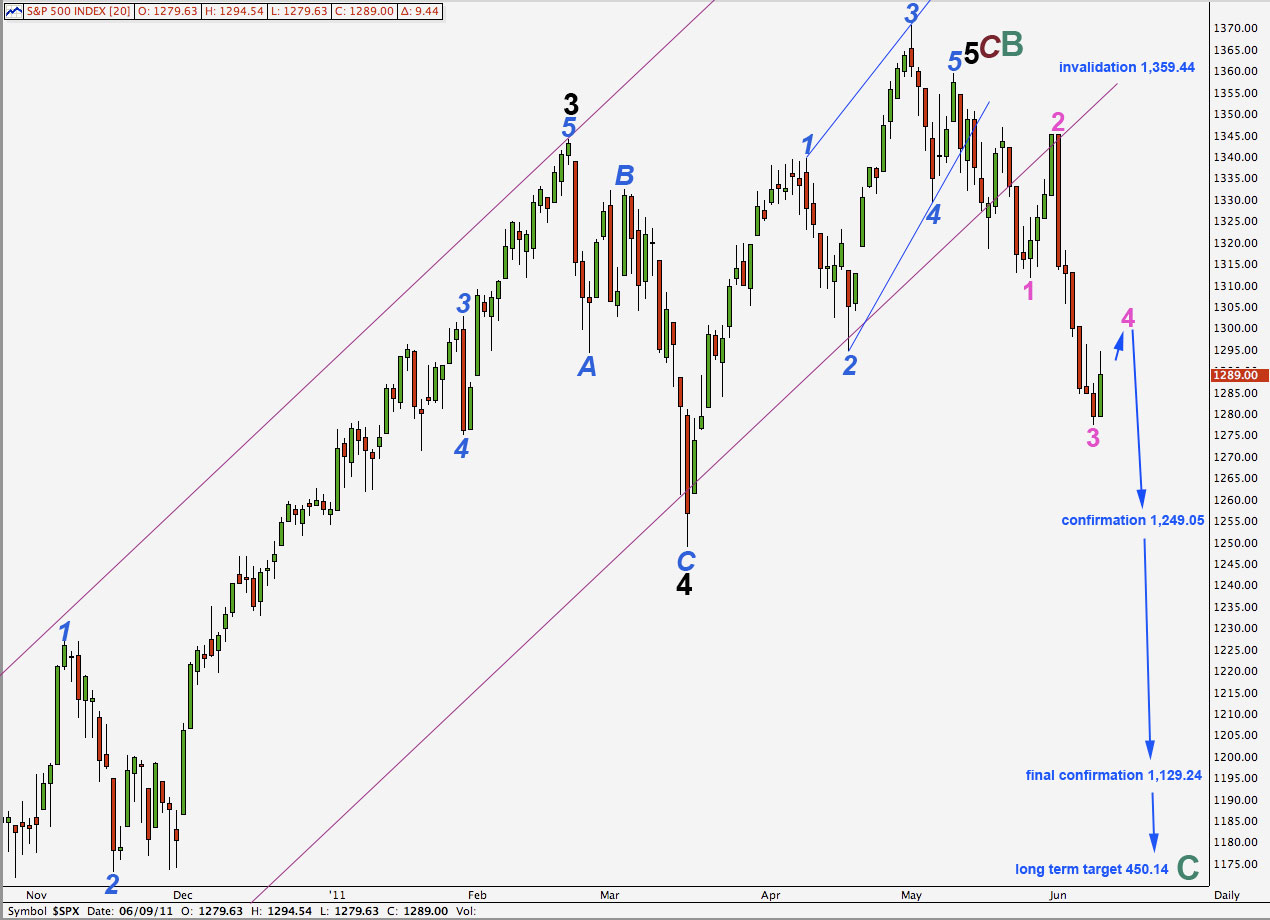
Movement above 1,286.48 quickly indicated an end to wave 3 pink and a start to wave 4 pink.
I have moved the degree of labeling for recent downwards movement all up one degree. Waves at pink degree often show up on daily charts as these ones do, but waves at green degree rarely do.
In the long term it is likely that cycle wave C will reach equality with cycle wave A at 450.14. Cycle wave C should take at least a year, if not longer, to complete.
Further movement below 1,249.05 would increase the probability of this bear market. At that stage a very unlikely alternate which saw downwards movement as a second wave correction within wave 5 black would be invalidated.
Finally, movement below 1,129.24 would invalidate the one remaining alternate bullish wave count and so give us a lot of confidence that the S&P is in a bear market.
Any second wave correction (at blue degree) may not move beyond the start of its first wave. This wave count is invalidated with movement above 1,359.44.
Wave 5 green (previously orange) was a very brief wave but within wave 3 pink there are very good fibonacci ratios. Wave 3 green is 2.39 points shorter than wave 1 green and wave 5 green is just 0.28 points short of 0.236 the length of wave 1 green.
There is no fibonacci ratio between waves 3 and 1 pink which makes it increasingly likely that wave 5 pink to come will exhibit a ratio to either of 3 or 1.
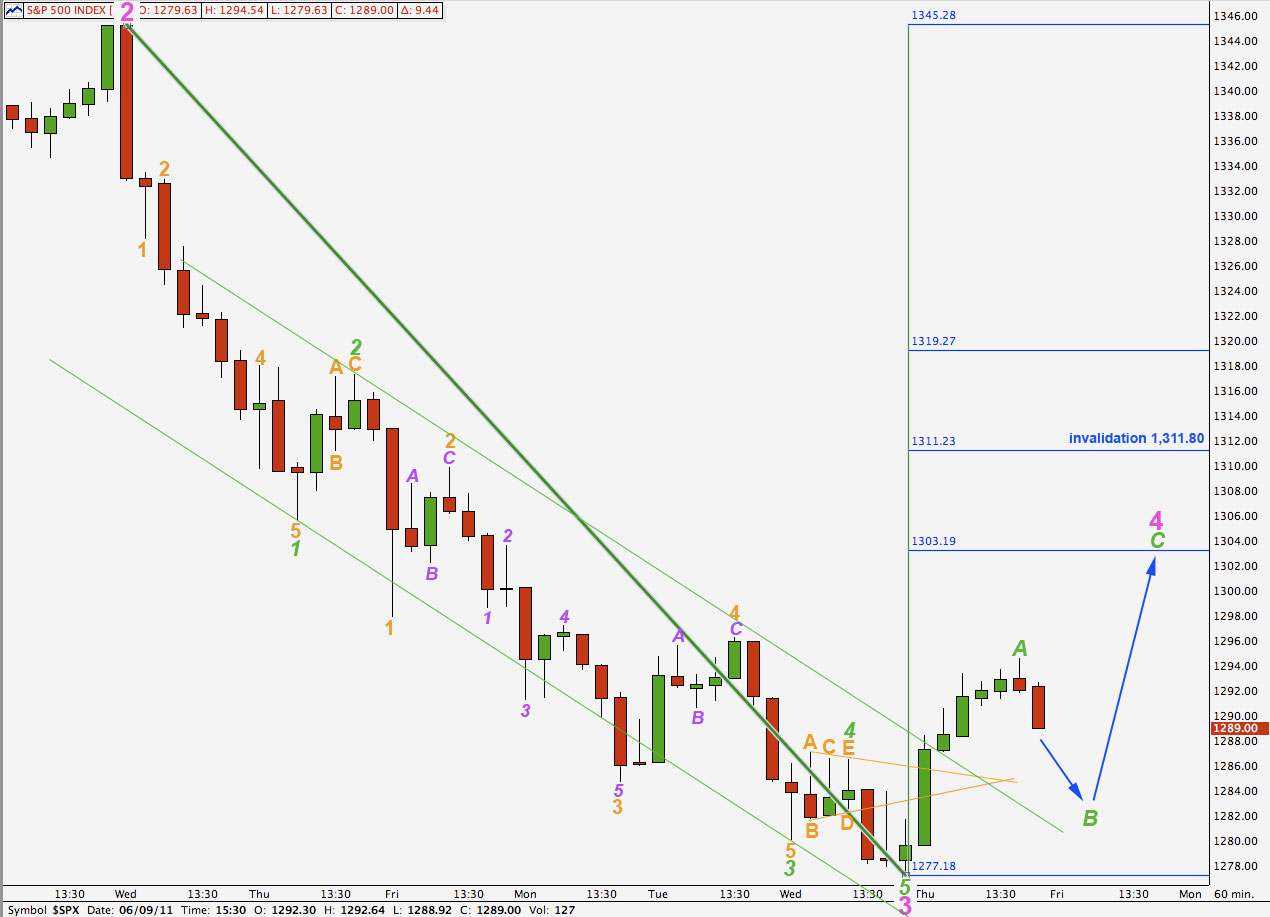
We should be expecting a small correction downwards tomorrow for a B wave within wave 4 pink, and then another five wave structure upwards for wave C to end wave 4 pink.
Wave A green within wave 4 pink looks like a five wave structure on the 15 minute chart. If this is correct then the possibility of a flat correction for wave 4 pink may be eliminated. Wave 4 pink may be a zigzag or a triangle (or a combination beginning with a zigzag). As wave 2 pink was a zigzag we would expect wave 4 pink to be a triangle. However, zigzags are much more common and so that is how I have labeled this today.
If wave 4 pink is a zigzag then wave B green may not move beyond the start of wave A green below 1,277.42.
If wave 4 pink is a triangle then wave B green may move below the start of wave A green at 1,277.42 if it is a running or expanding triangle.
For both structures we would expect the next movement to be a three wave structure downwards.
Thereafter, wave C green upwards will provide us with more information about the structure of wave 4 pink. If wave C green moves above the end of wave A green at 1,294.54 then wave 4 pink is most likely a zigzag.
If wave C green fails to move above the end of wave A green at 1,294.54 and is a zigzag then wave 4 pink may be a contracting triangle.
We should expect sideways to upwards movement for a few more days as wave 4 pink unfolds.
Because wave 2 pink was a deep 70% correction of wave 1 pink we may expect wave 4 pink to be a shallow correction of wave 3 pink, most likely ending about the 0.382 fibonacci ratio about 1,303. This would provide alternation between waves 2 and 4 pink even if they are both zigzags.
Wave 4 pink may not move into wave 1 pink price territory. This wave count is invalidated with movement above 1,311.80.
If this wave count is invalidated with upwards movement then we would expect that this would be only wave 2 green within wave 3 pink, and we would move the degree of labeling on the hourly chart here all done one degree. We would then be looking at an extended third wave and the invalidation point would move up to 1,345.20.