
Elliott Wave chart analysis for the S&P 500 for 8th June, 2011. Please click on the charts below to enlarge.
This analysis was for 8th June which was unable to be published on time due to issues with the internet connection. I’m in Auckland today with a reliable connection so the next analysis will be published as usual, in a few hours. Thank you all very much for your patience!
The hourly chart was invalidated with upwards movement and the target was not reached. As in the final paragraph we may now expect that wave 4 green is underway and should last a few more days, probably ending late next week.
Price has moved a little lower which was expected but has not reached our targets yet.
I have reanalysed the hourly chart thoroughly today. We should expect a little more downwards movement as most likely before wave 4 green begins.
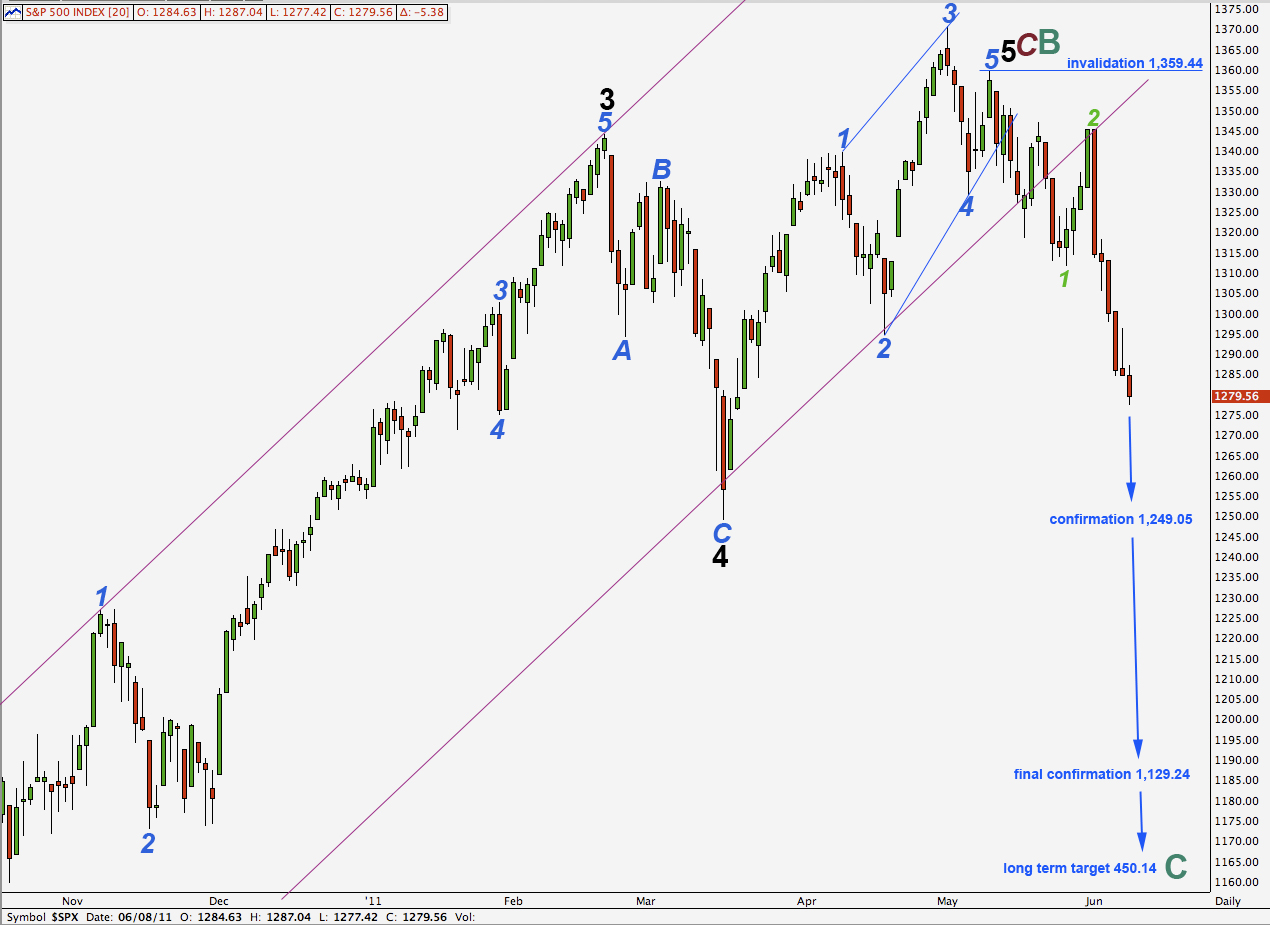
In the long term it is likely that cycle wave C will reach equality with cycle wave A at 450.14. Cycle wave C should take at least a year, if not longer, to complete.
Further movement below 1,249.05 would increase the probability of this bear market. At that stage a very unlikely alternate which saw downwards movement as a second wave correction within wave 5 black would be invalidated.
Finally, movement below 1,129.24 would invalidate the one remaining alternate bullish wave count and so give us a lot of confidence that the S&P is in a bear market.
Any second wave correction may not move beyond the start of its first wave. This wave count is invalidated with movement above 1,359.44.
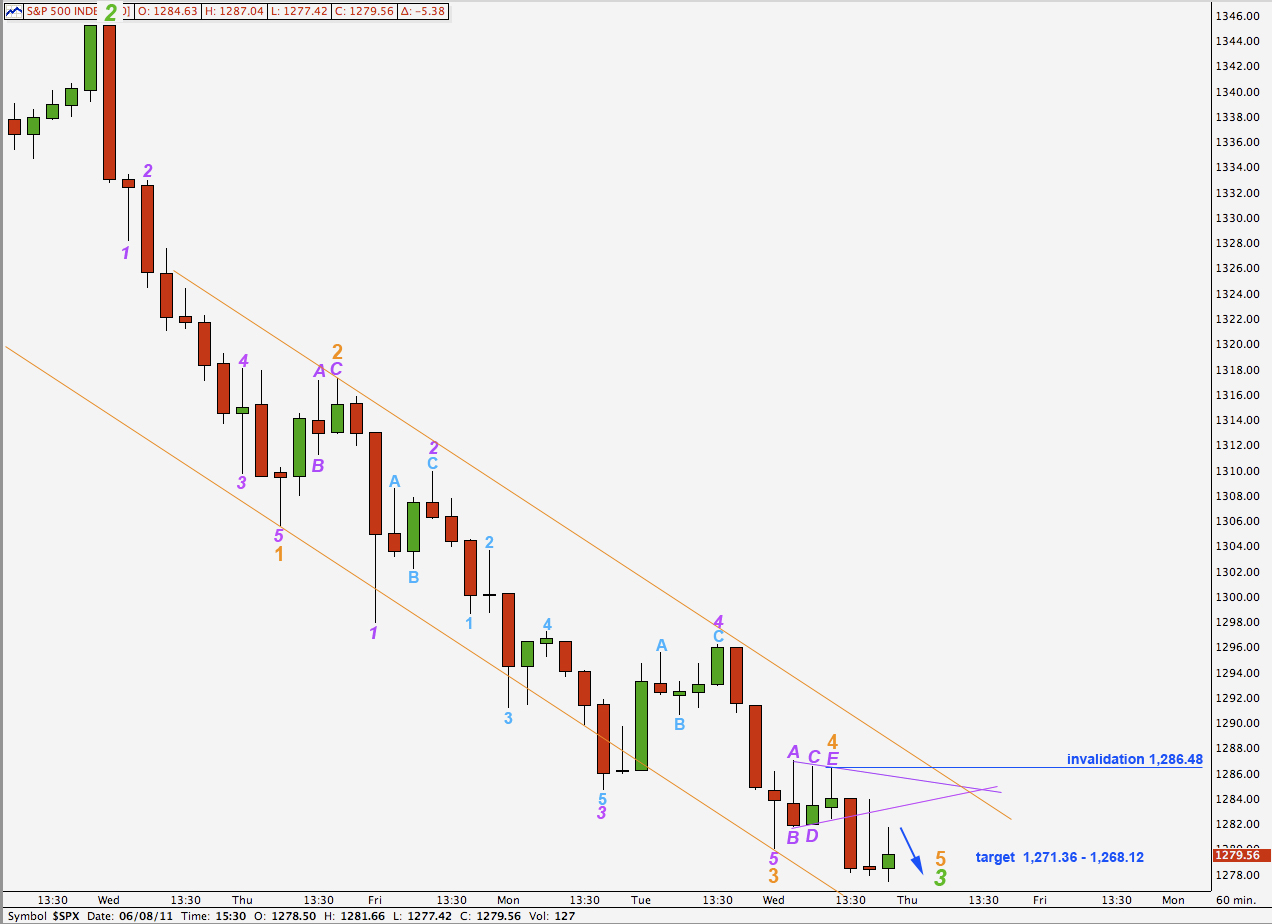
The labeling here within wave 3 purple of wave 3 orange was determined after analysis of a 5 minute chart. This is the best fit for downwards movement I can see at this stage.
There was a triangle which unfolded during Wednesday’s session. This is highly likely to be a fourth wave. Our previous wave count on the hourly chart would have seen it as wave 4 green, but that is hugely out of proportion to wave 2 green zigzag. Hence the reanalysis.
Wave 3 orange is still shorter than wave 1 orange, but now this is just 2.39 points shorter which is an adequate ratio.
Ratios within wave 3 orange are: wave 3 purple has no fibonacci ratio to wave 1 purple and wave 5 purple is just 0.63 longer than 0.618 the length of wave 3 purple.
Ratios within wave 3 purple of wave 3 orange are: wave 3 aqua is 1.16 points longer than wave 1 aqua and wave 5 aqua is just 0.11 short of equality with wave 3 aqua.
Wave 2 orange is a zigzag and wave 4 orange is a triangle, which achieves the guideline of alternation nicely.
At 1,271.34 wave 5 orange will reach 0.382 the length of wave 1 orange. At 1,268.12 wave 3 green will reach 1.618 the length of wave 1 green. This is our target for this wave to end and it may be reached in another day or two.
The trend channel drawn here using Elliott’s technique contains this downwards third wave very well. We may expect the fifth wave to end about the lower edge of it.
If upwards movement breaches the invalidation point at 1,286.48 then wave 5 orange must be complete and wave 4 green would have begun sooner than we are expecting. If this occurs then we should expect wave 4 green to last at least a couple of days to a week, and the invalidation point would then be at the end of wave 1 green which is at 1,311.80.