Elliott Wave chart analysis for the S&P 500 for 3rd June, 2011. Please click on the charts below to enlarge.
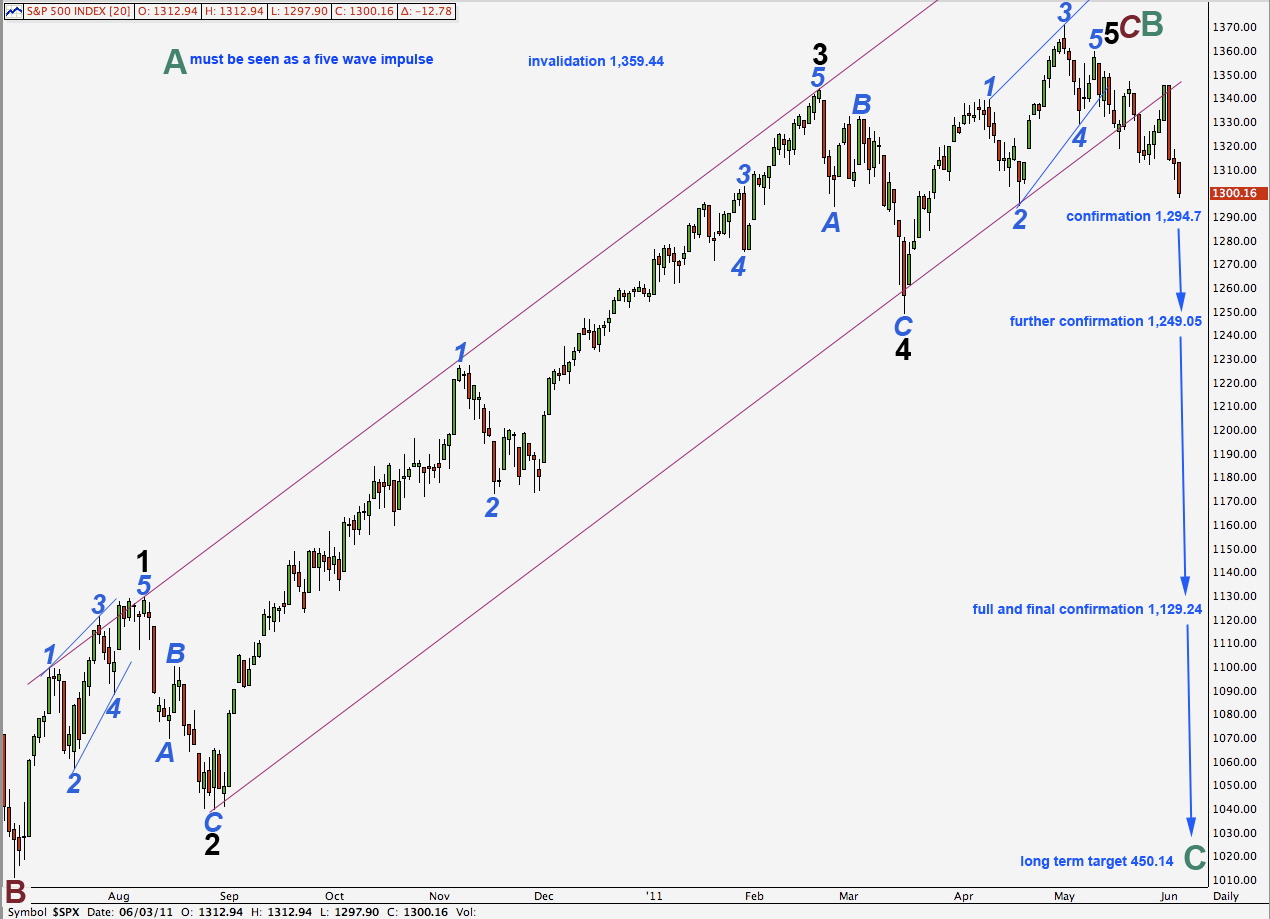
This wave count sees the S&P 500 within the very early stages of a cycle wave C downwards. This fits with other indicies which have made new all time highs. As these indicies would be within a cycle wave C downwards, while the S&P structure is a zigzag other indicies, such as the Russell 2000, would be unfolding as flat corrections.
Within a zigzag the most common relationship between waves A and C is equality. Cycle wave A was 909.3 points in length. Cycle wave C will reach equality with cycle wave A at 450.14.
Cycle waves should last about one to several years. Cycle wave A lasted 18 months. Cycle wave B lasted 27 months. There are no fibonacci time relationships here so we cannot use this to estimate when cycle wave C may end.
Movement below 1,297.7 would invalidate our one remaining bullish wave count. At that stage we may have reasonable confidence we are in a bear market. Movement below 1,249.05 would invalidate an alternate idea which sees downwards movement as a second wave correction within wave 5 black upwards (move the degree of labeling from the low at 1,249.05 down one degree). At that stage we may have increased confidence in this wave count. Finally, movement below 1,129.24 would invalidate the outlying alternate presented at the end of this analysis. At that stage we may have full confidence in this wave count.
Each of these price points will increase the probability that this wave count is correct and that we shall see new lows for the S&P.
Any second wave correction within this new downwards trend may not move beyond the start of wave 1. This wave count is invalidated with movement above 1,359.44.
Within cycle wave B zigzag primary wave C is just 6.77 points short of 0.618 the length of cycle wave A.
Ratios within cycle wave C are: wave 3 black is just 5.42 points longer than 2.618 the length of wave 1 black and wave 5 black is just 7.94 points short of equality with wave 1 black.
Despite the odd look of the third wave this impulse for primary wave C has excellent fibonacci ratios at intermediate degree.
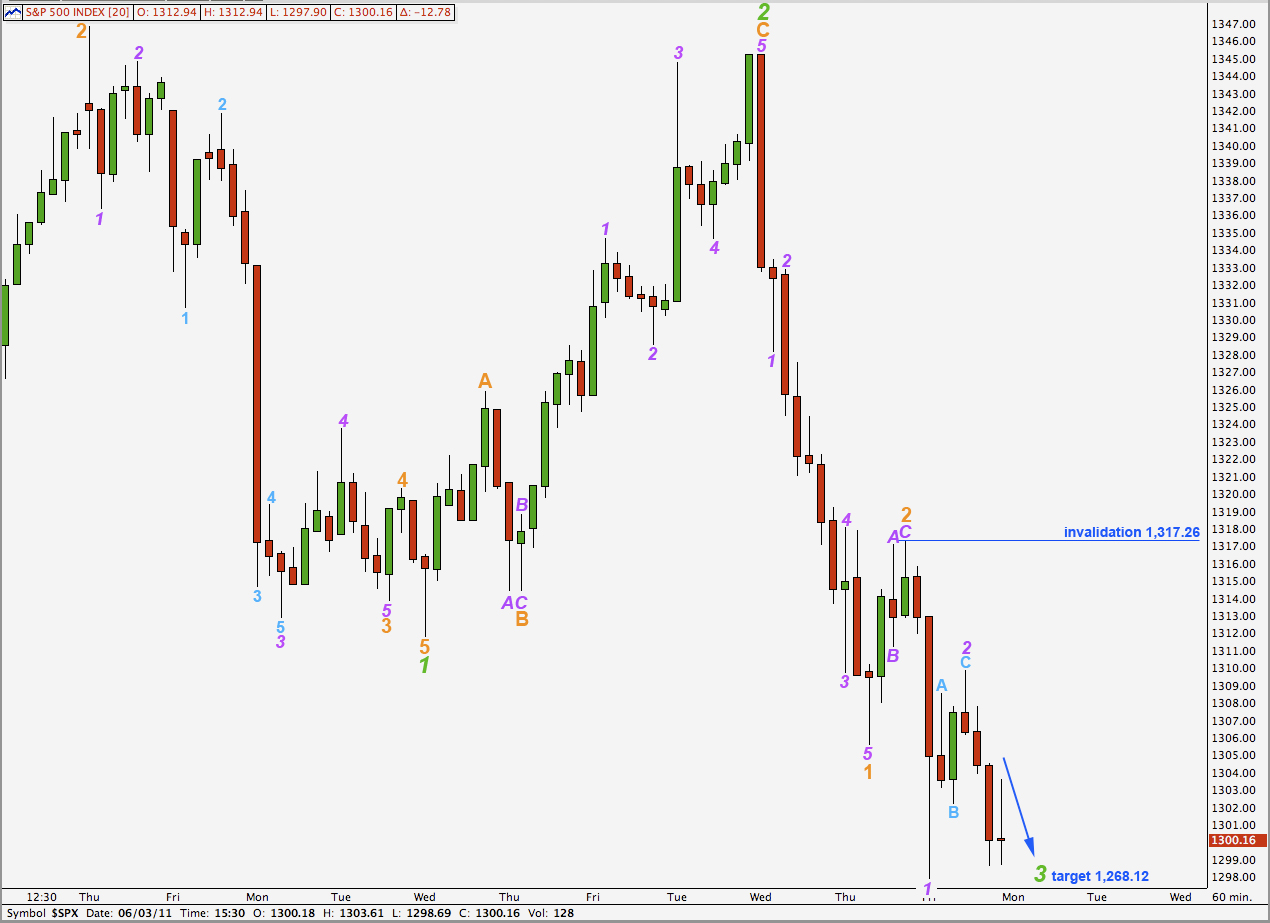
The last analysis hourly wave count expected downwards movement for a third wave. This third wave may have begun on Friday.
The target remains the same; at 1,268.12 wave 3 green will reach 1.618 the length of wave 1 green. This target may be reached by the end of next week.
Within wave 2 purple of wave 3 orange there is no ratio between waves A and C aqua.
Wave 2 purple may be complete as labeled, or this may be only wave A within a flat correction for wave 2 purple (if we move the degree of labeling down one degree). Any further extension of wave 2 purple may not move beyond the start of wave 1 purple. This wave count is invalidated with movement above 1,317.26.
Daily Alternate Wave Count #1.
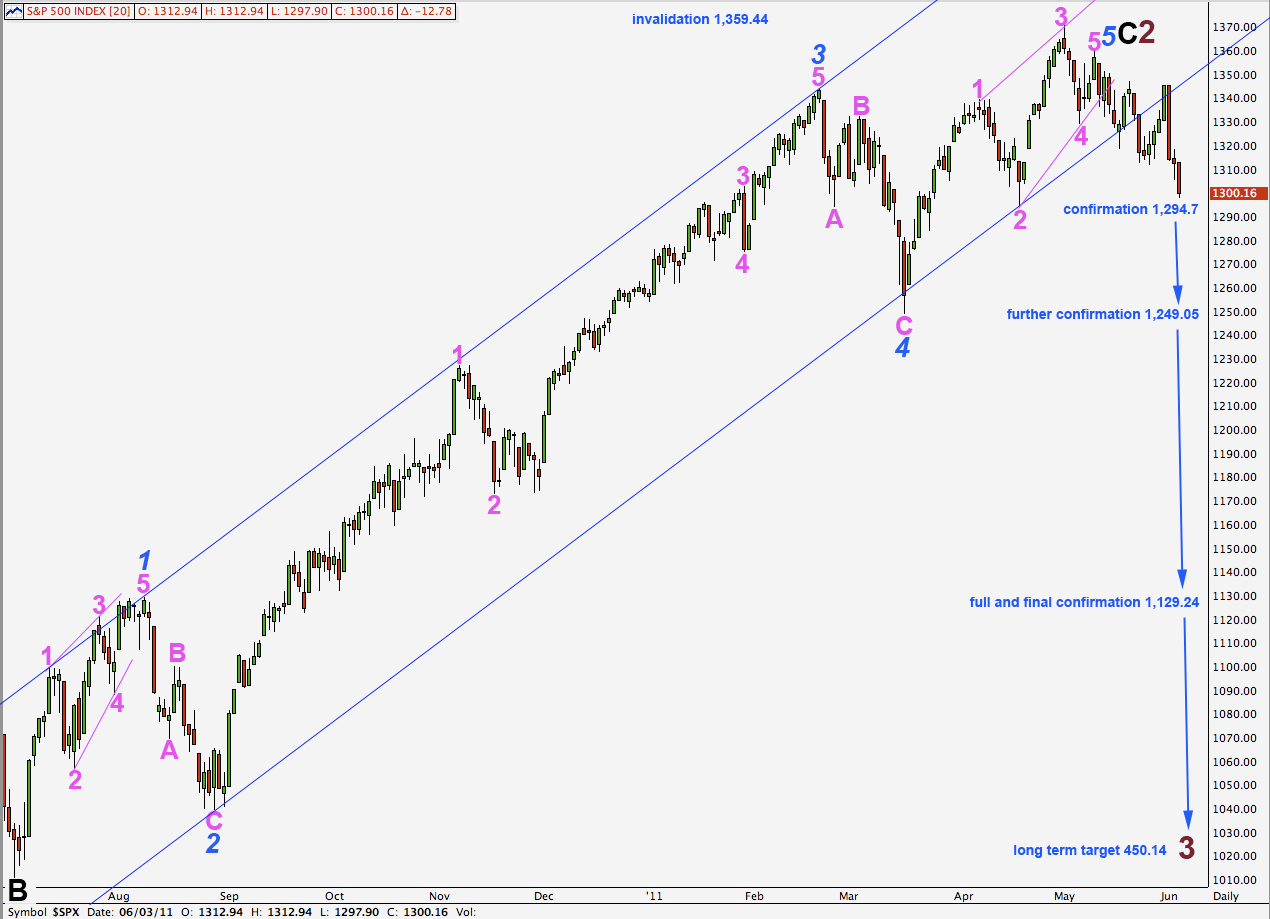
This wave count is essentially the same as the main wave count in terms of expectations. It differs at cycle degree. With a little further downwards movement and more confidence in this bear market I will switch our main and alternate historic wave counts around and this will be our alternate historic wave count.
Daily Alternate Wave Count #2.
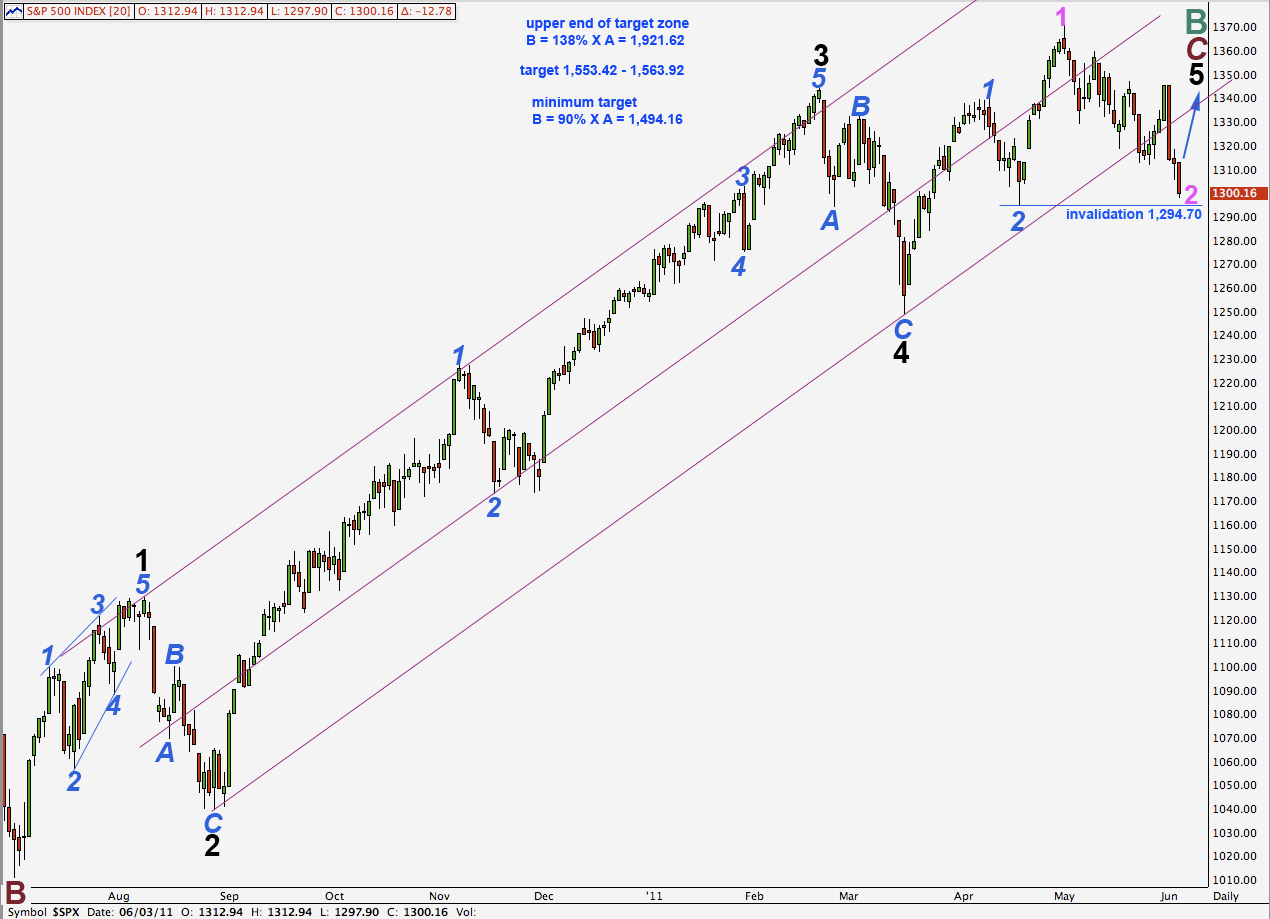
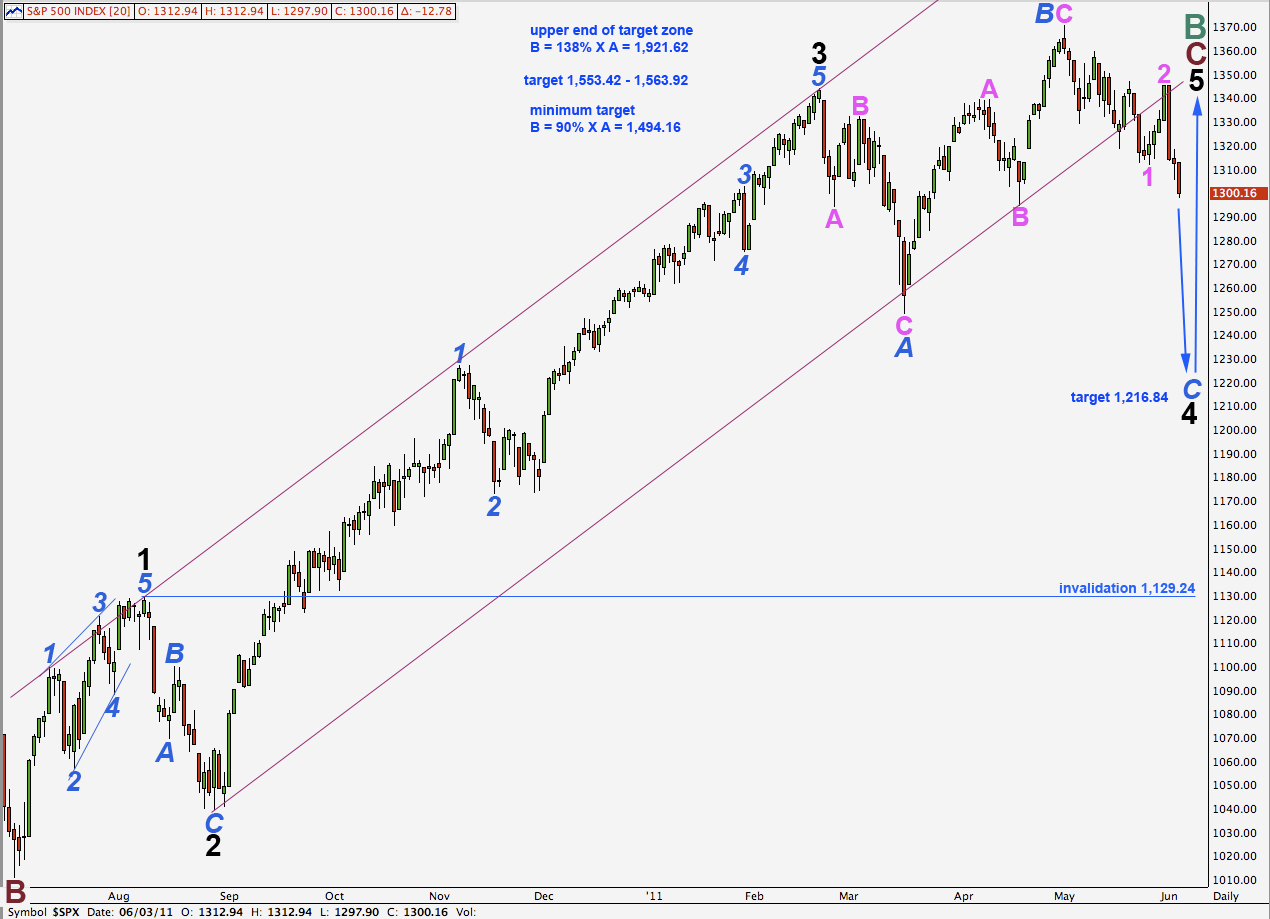
With two daily candlesticks comfortably below the parallel channel containing the impulse for primary wave C this wave count now has a low probability.
A little further downwards movement would invalidate it.
If this wave count is correct we would expect to see a very strong upwards movement as the third wave within a third wave upwards begins very soon.
Daily Alternate Wave Count #3.
This wave count does not have the right look at all and so has a low probability.
Wave 4 black within cycle wave C is here seen as an expanded flat and downwards movement is wave C blue of that correction.
Wave 2 black lasted 15 days. At this stage wave 4 black has lasted 73 days and is incomplete. This is completely out of proportion in duration and size.
The trend channel around primary wave C has been comfortably breached. Fourth waves can do this, that is why Elliott suggested a second technique to redraw the channel if it did not contain the fourth wave. However, when this fourth wave is complete the channel that would be drawn would not have a very typical look at all as most of the upper end of the third wave would be above it.
This will be the last time I present this outlying alternate for a while. We should continue to be aware of it in terms of the price point at 1,129.24 being an important point to provide final confirmation of our main daily wave count.

