Elliott Wave chart analysis for the S&P 500 for 2nd June, 2011. Please click on the charts below to enlarge.
With movement below 1,311.8 our primary bullish wave count is now looking much less likely. We must consider our second bearish wave count now as the most likely of all our wave counts. Movement below 1,294.7 would significantly increase the probability that we have seen a major trend change recently and that the S&P is on its way to new lows.
All possible wave counts which I can see are again presented below, in order of probability.
Wave counts 1, 2, 4, 5 and 7 all see the larger historical count as having the start of the correction at the all time high in October 2007 at 1,576.09. In the historic analysis, as it currently is, this wave count is listed as the “alternate”.
Wave count 3 sees the larger historical count as having the start of the correction (and expanded flat) in March, 2000 at 1,552.87. Wave count 6, from 27th May analysis, is now looking so unlikely I have removed it from this analysis.
Table
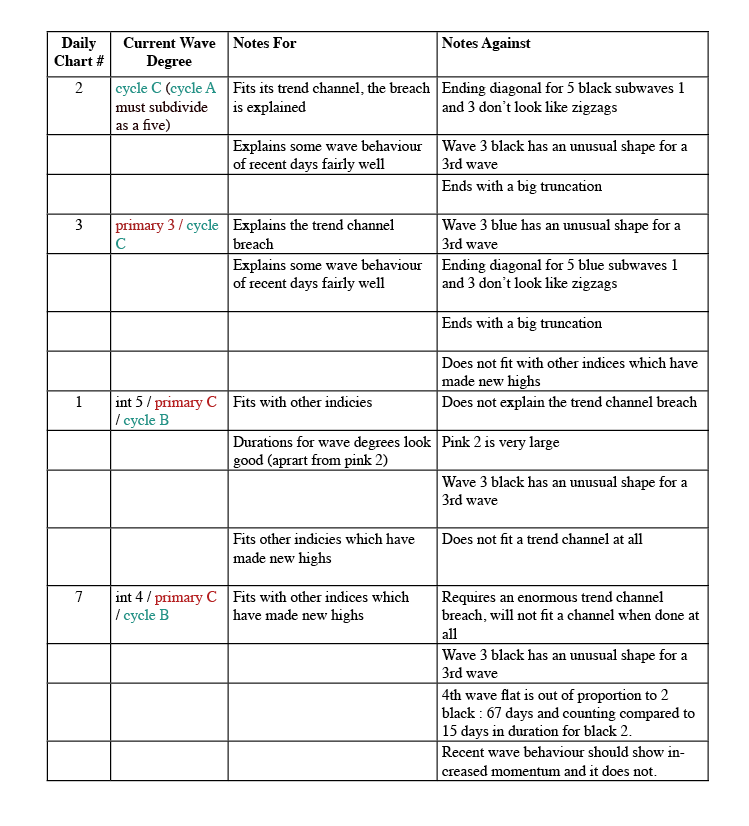
Click here to download a .pdf of the table above.
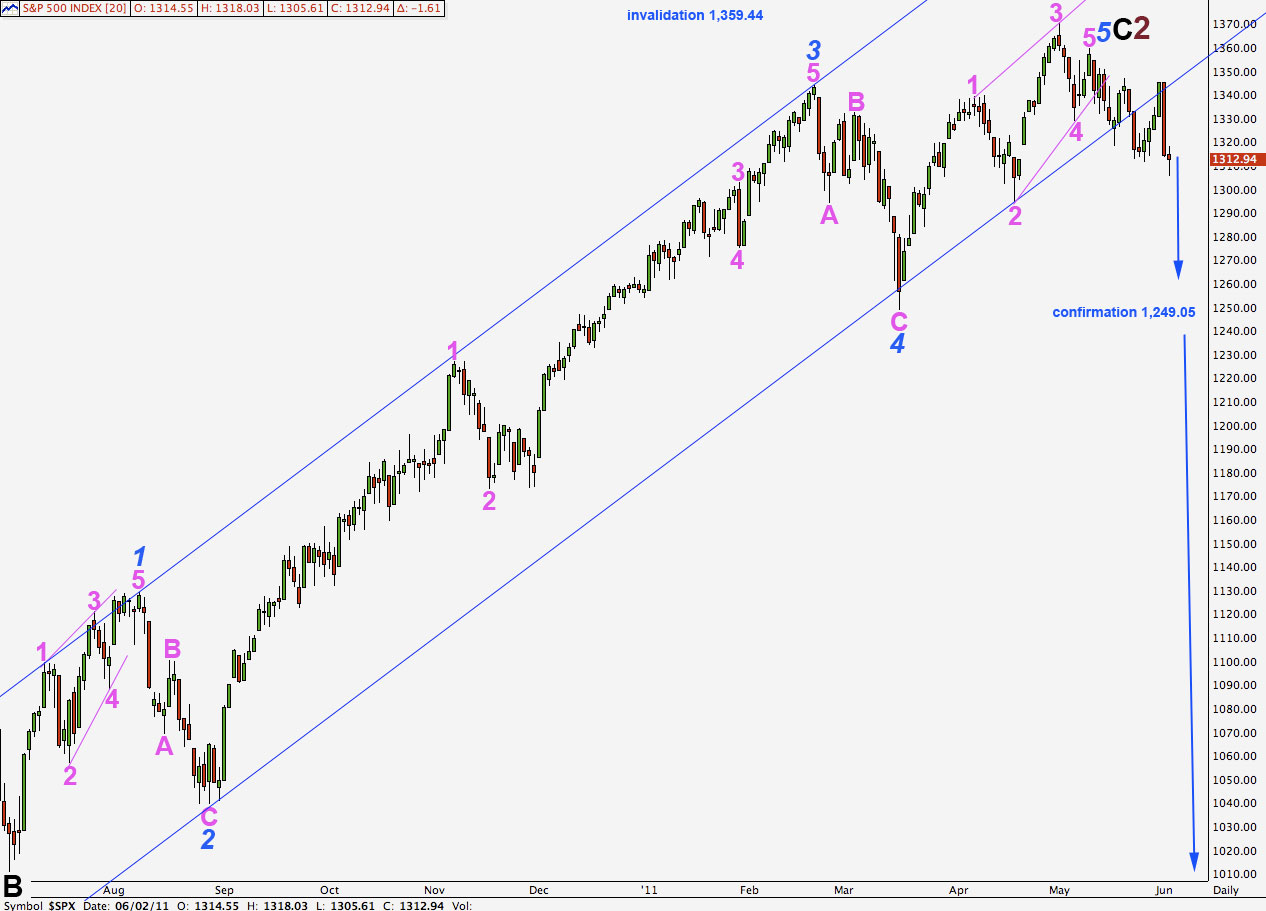
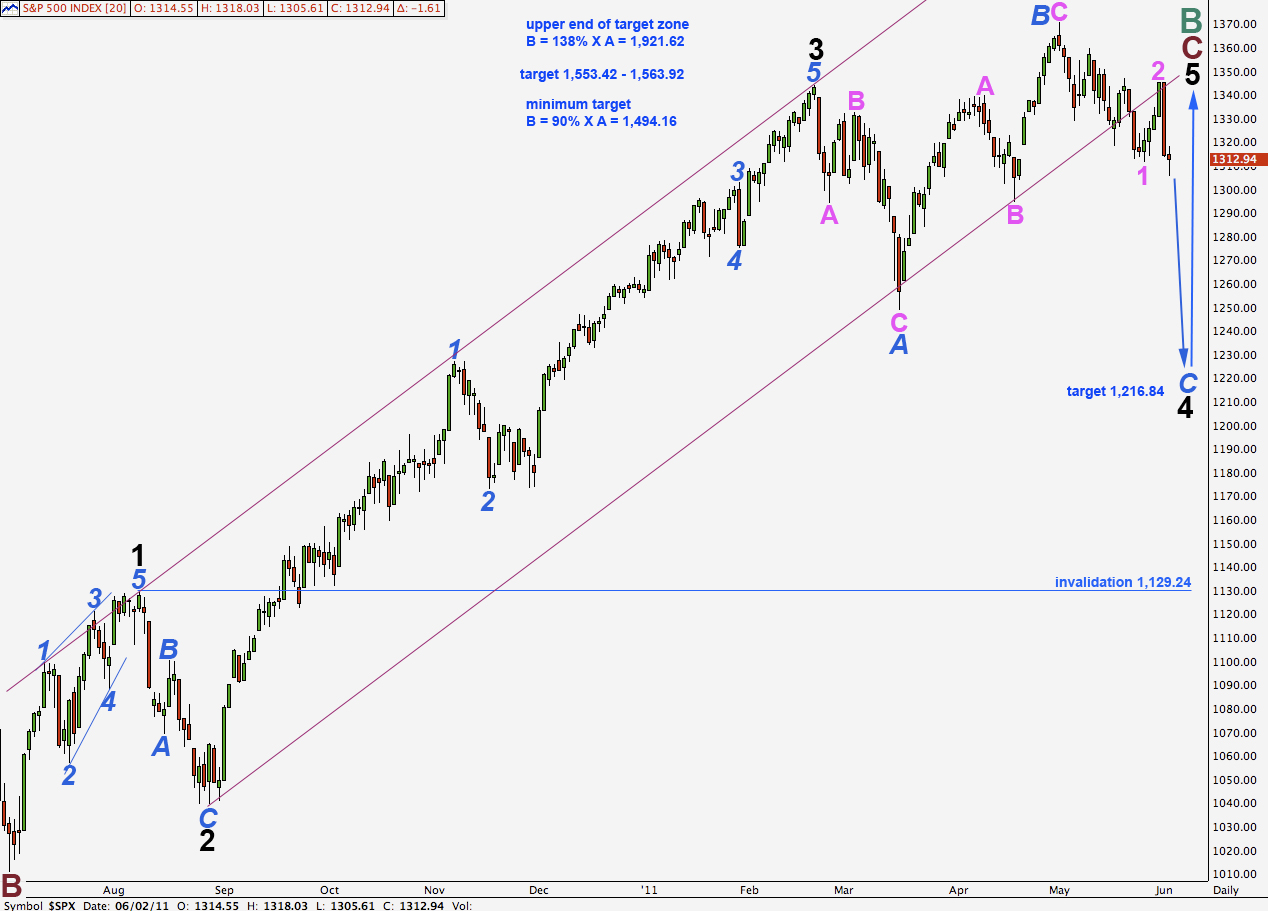
Daily Chart #2
This wave count explains the trend channel breach and some recent wave behaviour fairly well. The major detraction is the structure of blue waves 1 and 3 within the ending contracting diagonal of black wave 5. They both should be zigzags and these do not look quite like zigzags.
Movement below 1,294.7 will increase the probability that we are now in a bear market, and movement below 1,249.05 would confirm it. At that stage the only bullish wave count I can see would look so strange as to be almost ridiculous (wave count 7).
If this wave count is correct then we may have just seen the first wave within a third wave downwards. The next move, if the following second wave correction is complete, should be a strong third wave down.
Movement above 1.359.44 would invalidate this wave count.
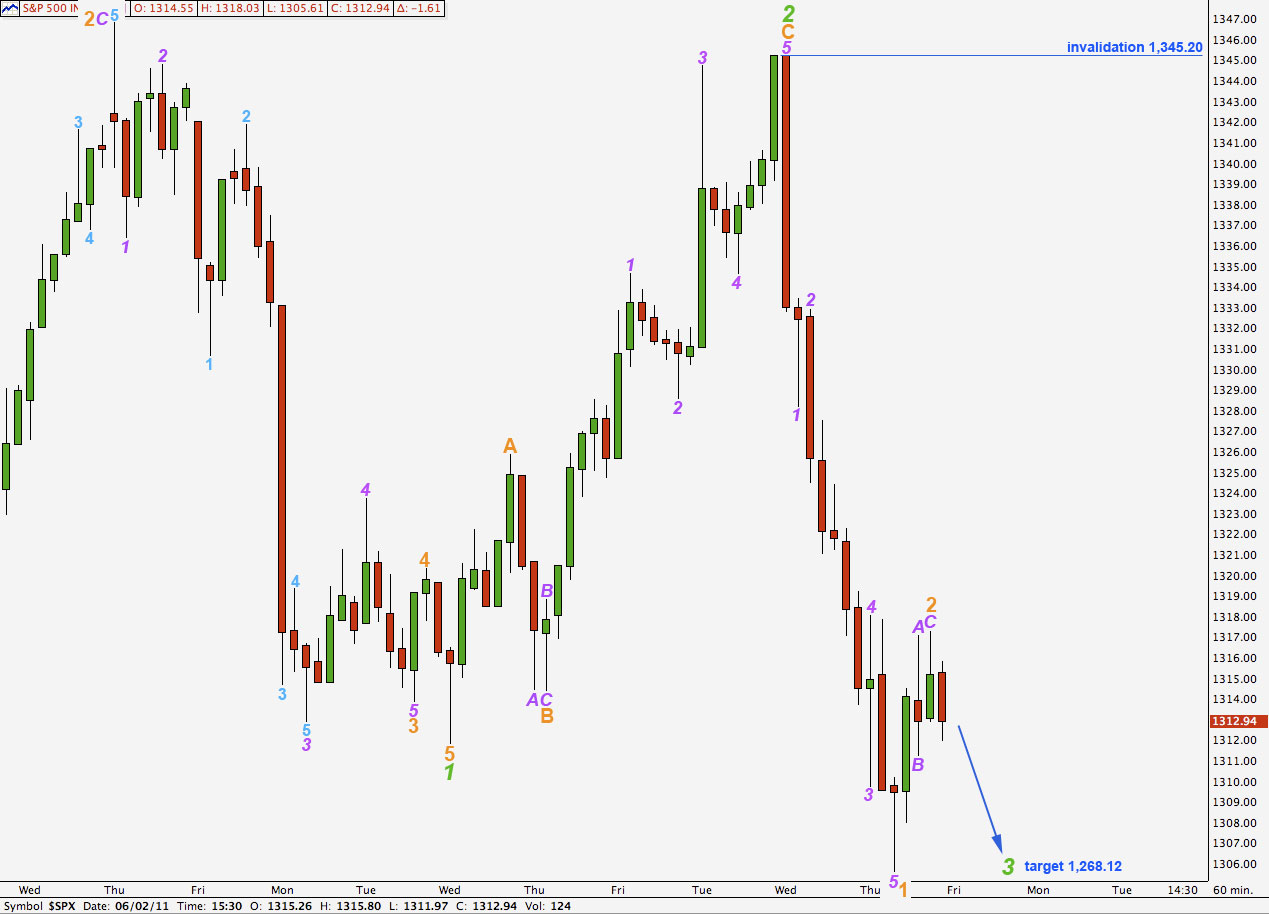
Within wave 3 green the last downwards wave is likely to be just wave 1 orange. There are no fibonacci ratios within wave 1 orange between waves 1, 3 and 5 purple.
Within wave 2 orange we can see a complete zigzag on a 5 minute chart. There is no ratio between waves A and C purple. Price has fallen below the start of wave C purple indicating that this zigzag is complete.
Alternately this zigzag may be only wave A purple within wave 2 orange and wave 2 may be unfolding as a flat correction. This alternate may be seen by simply moving the degree of labeling down one degree within this small correction.
Any further extension of wave 2 orange upwards may not move beyond the start of wave 1 orange. This wave count is invalidated with movement above 1,345.20.
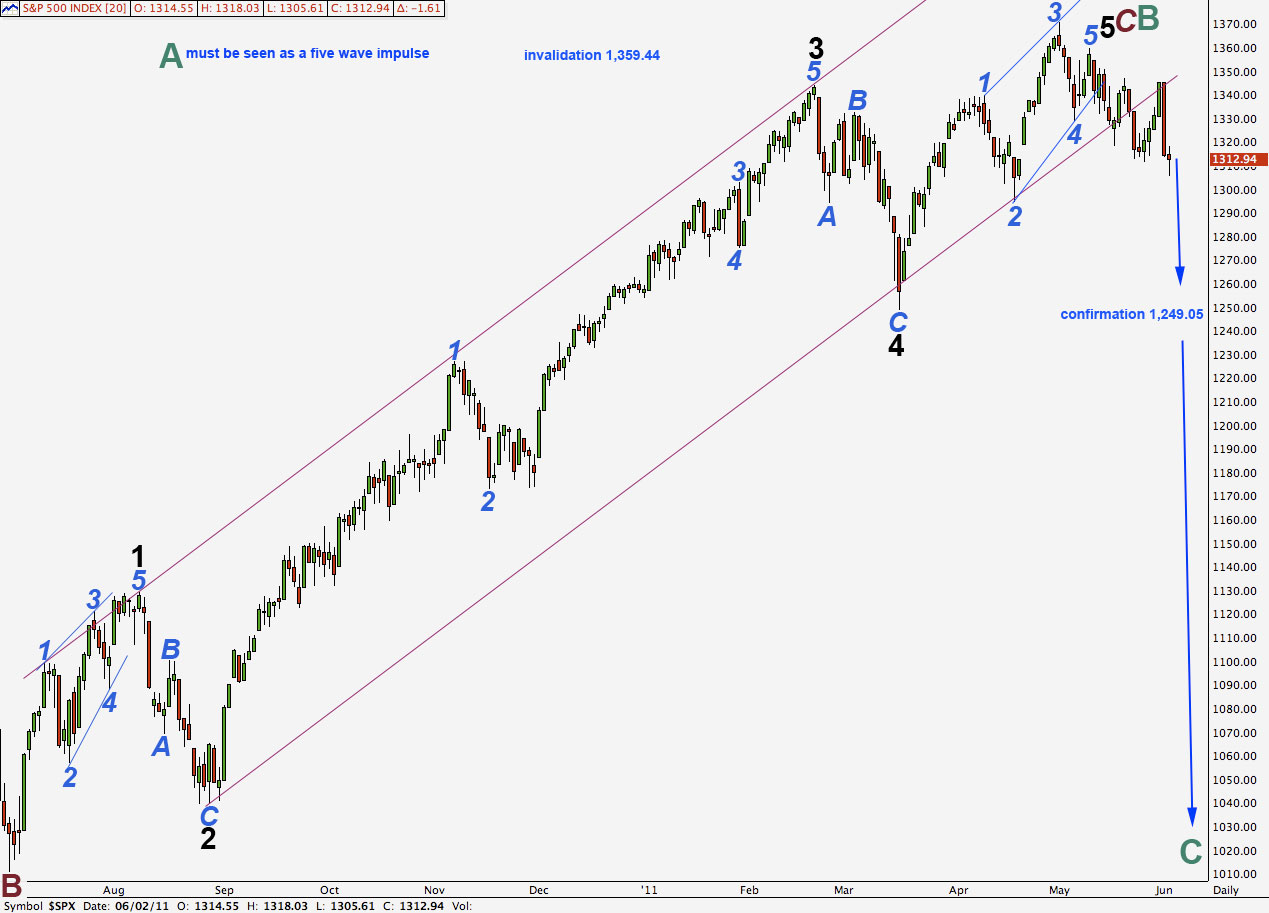
Daily Chart #1
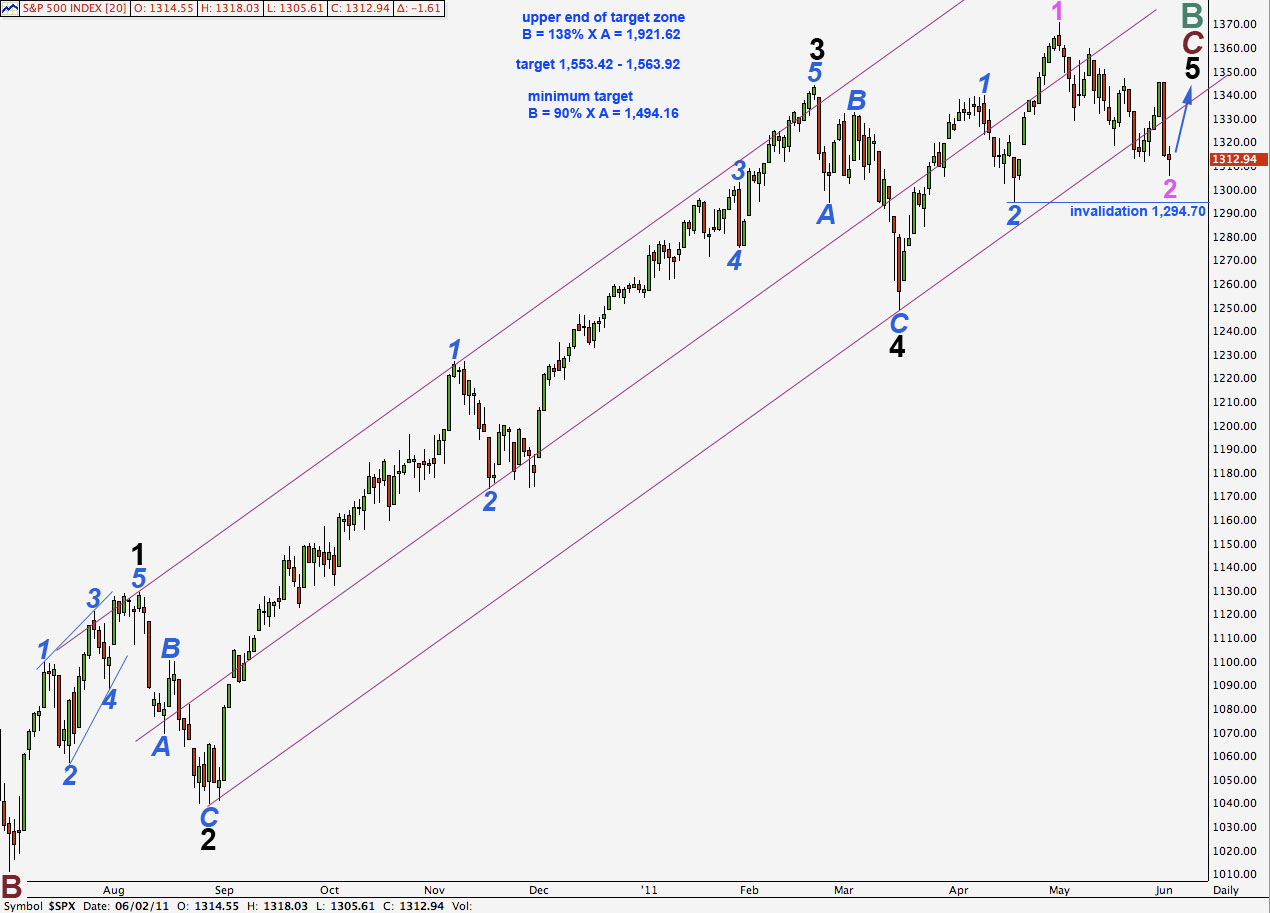
This wave count now has a very clear trend channel breach. This indicates an end to the upwards trend and a change to a bear market. This wave count has now significantly reduced in probability.
Movement below 1,294.7 would finally fully invalidate this wave count as wave 2 pink may not move beyond the start of wave 1 pink.
The only positive note I could point out for this wave count would be that wave 2 pink now has an obvious corrective count of 7 on the daily chart.
Daily Chart #7
Daily Chart #3