
Elliott Wave chart analysis for the S&P 500 for 1st June, 2011. Please click on the charts below to enlarge.
Wave Count #1.
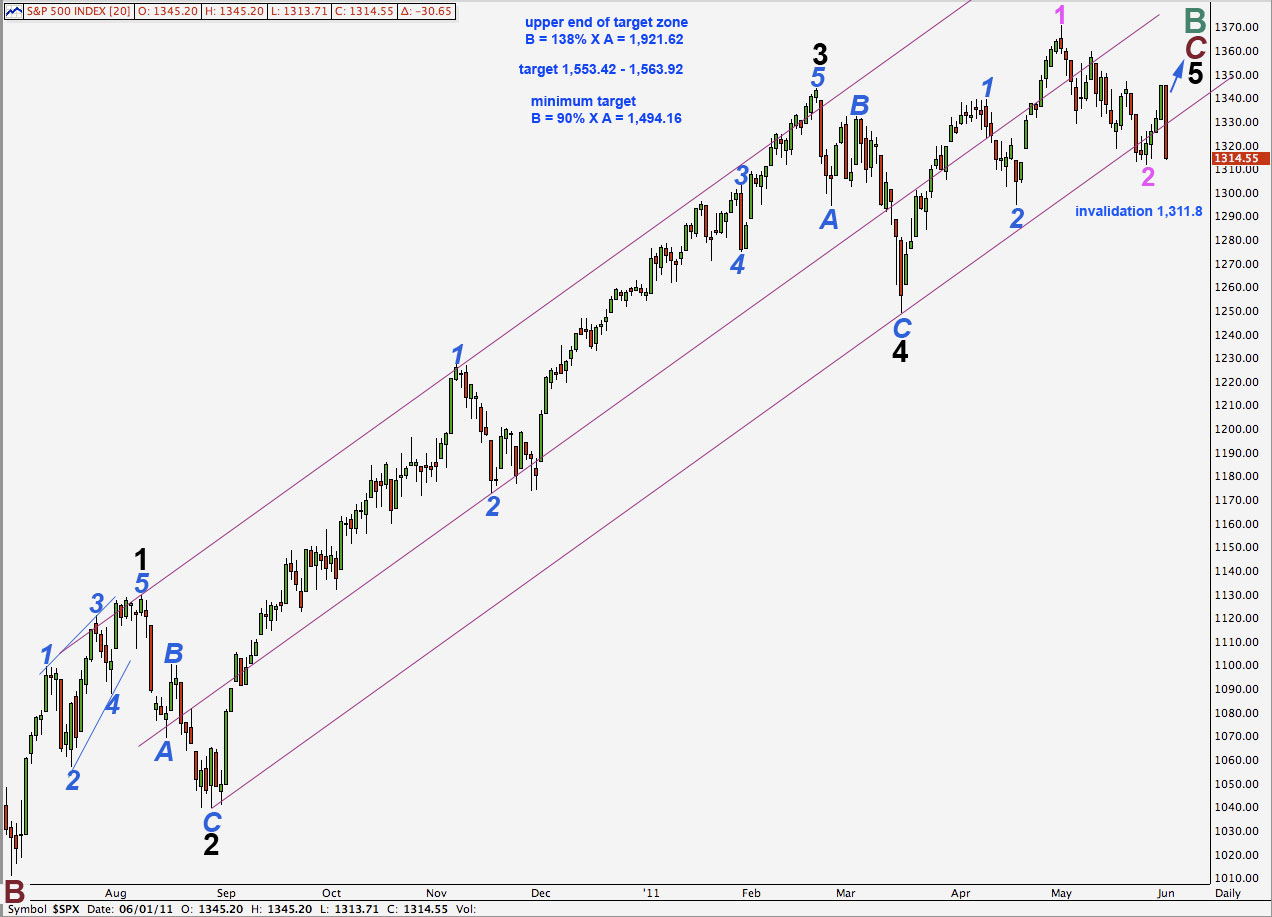
Yesterday’s hourly charts were quickly invalidated by strong downwards movement which is not what we were expecting.
While price remains above 1,311.8 this wave count will remain valid and will remain our primary wave count.
Price is now again below the parallel channel which contains wave C maroon impulse. If tomorrow’s candlestick remains below this lower trend line and does not re-enter the channel then the probability of this wave count will significantly reduce.
Movement below 1,311.8 would invalidate this wave count.
Cycle wave A subdivides most easily into a three wave zigzag. At super cycle degree this wave count sees the S&P as within a flat correction. Wave B of a flat must retrace at least 90% of wave A and so cycle wave B will reach 90% the length of cycle wave A at 1,494.16.
At 1,553.42 wave 5 black will reach equality with wave 3 black. At 1,563.92 primary wave C will reach equality with primary wave A. This is our small target zone for upwards movement to end.
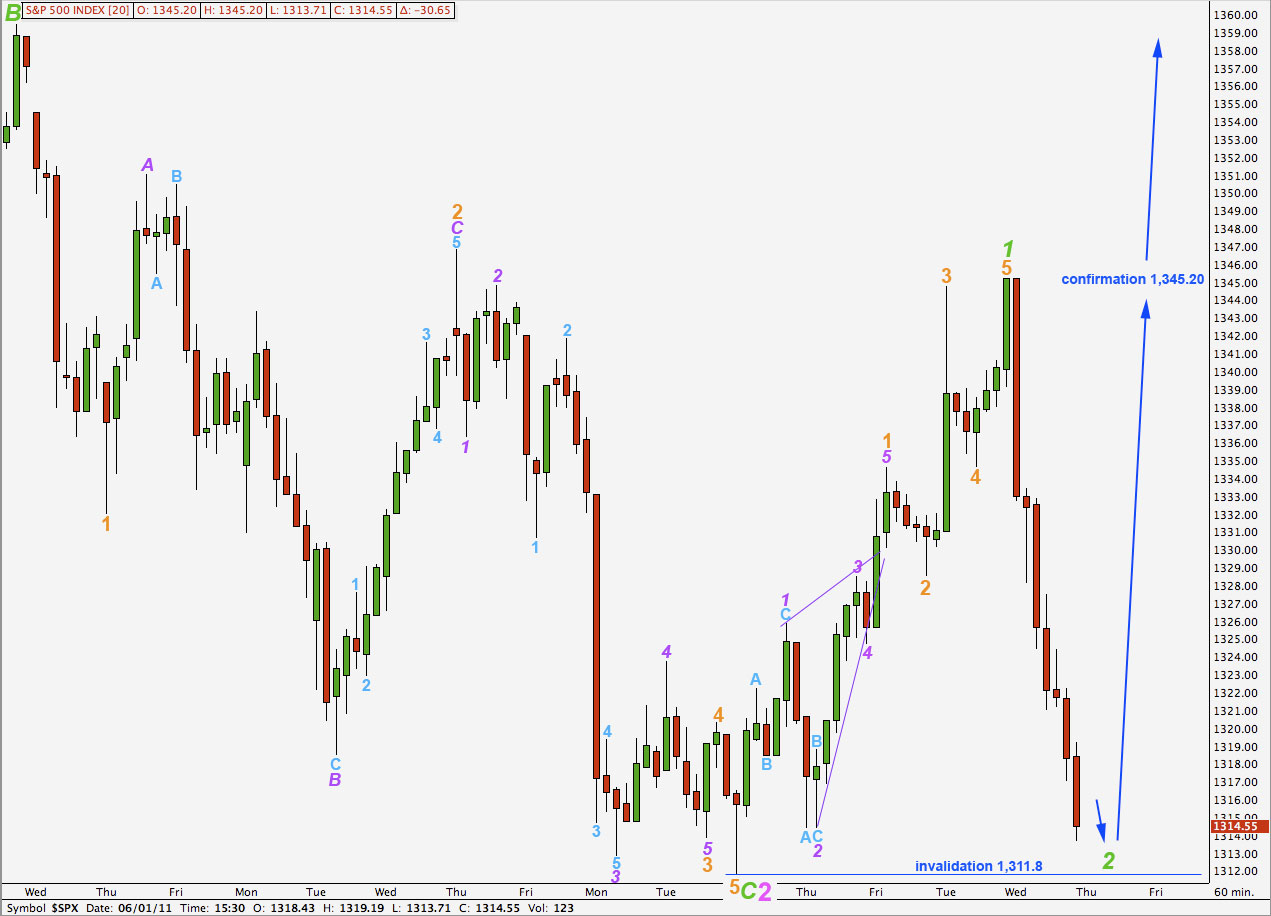
Upwards movement has an impulsive count of 9. Ratios within wave 1 green are: wave 3 orange has no fibonacci ratio to wave 1 orange and wave 5 orange is just 0.53 longer than 0.618 the length of wave 3 orange.
Downwards movement now has an impulsive count of 9 on the 15 minute chart. It would need two final waves, one small upwards correction and one final wave down, to complete a corrective count of 11 if this main wave count is correct.
Wave 2 green may not move beyond the start of wave 1 green. This wave count is invalidated with movement below 1,311.8.
Wave Count #2.
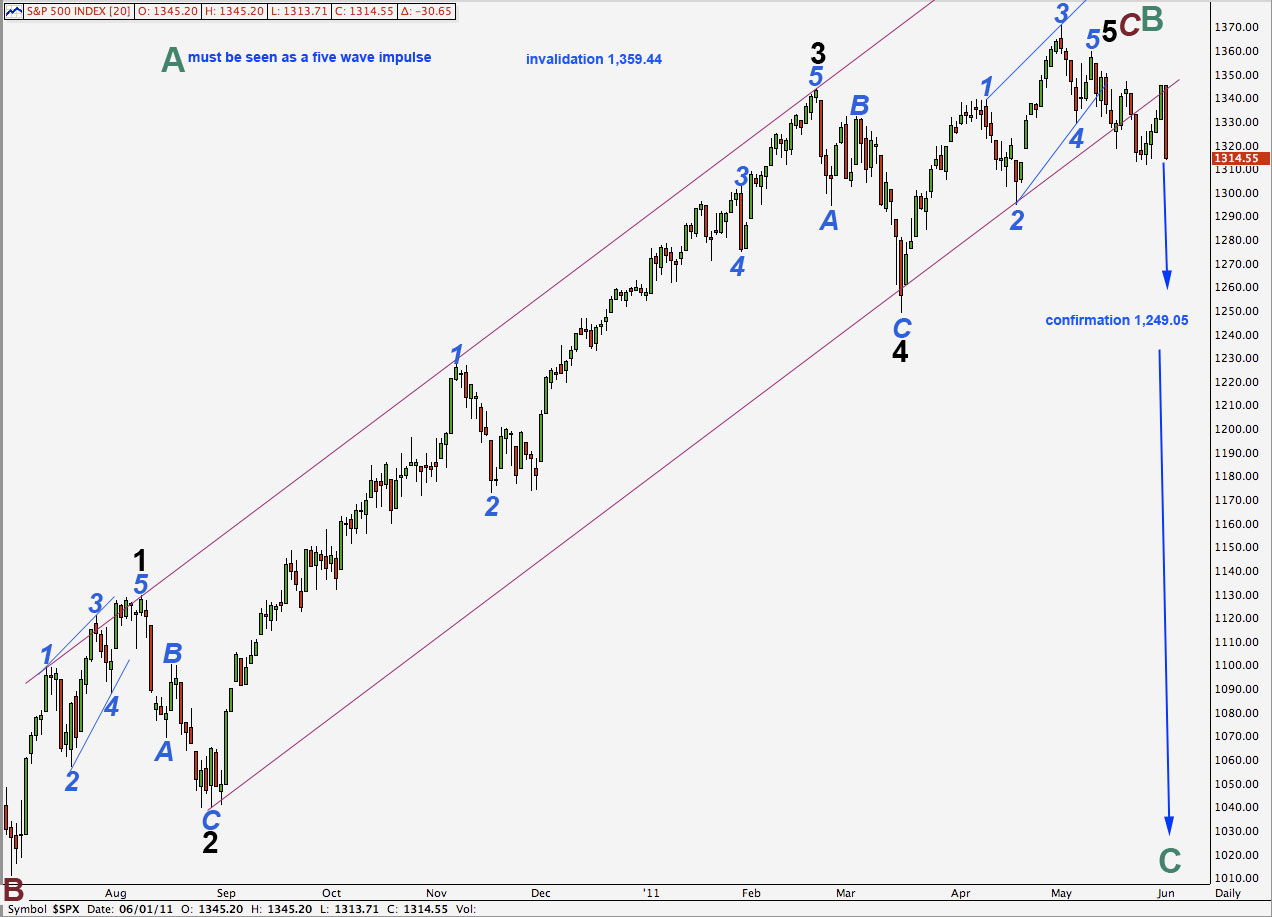
After moving back into the trend channel on Tuesday, Wednesday’s strong downwards movement has taken price back below the channel which would be what we should expect for this wave count. Downwards movement is again showing strong impulsive behaviour which also fits for this wave count.
Movement below 1,249.05 would confirm a bearish outlook. At that stage the first main bullish wave count and all but one (number 7) of our alternate bullish wave counts would be invalidated (numbers 4, 5, and 6).
If we have a high in place then any movement above 1,359.44, the end of wave B at cycle degree, would invalidate this wave count.
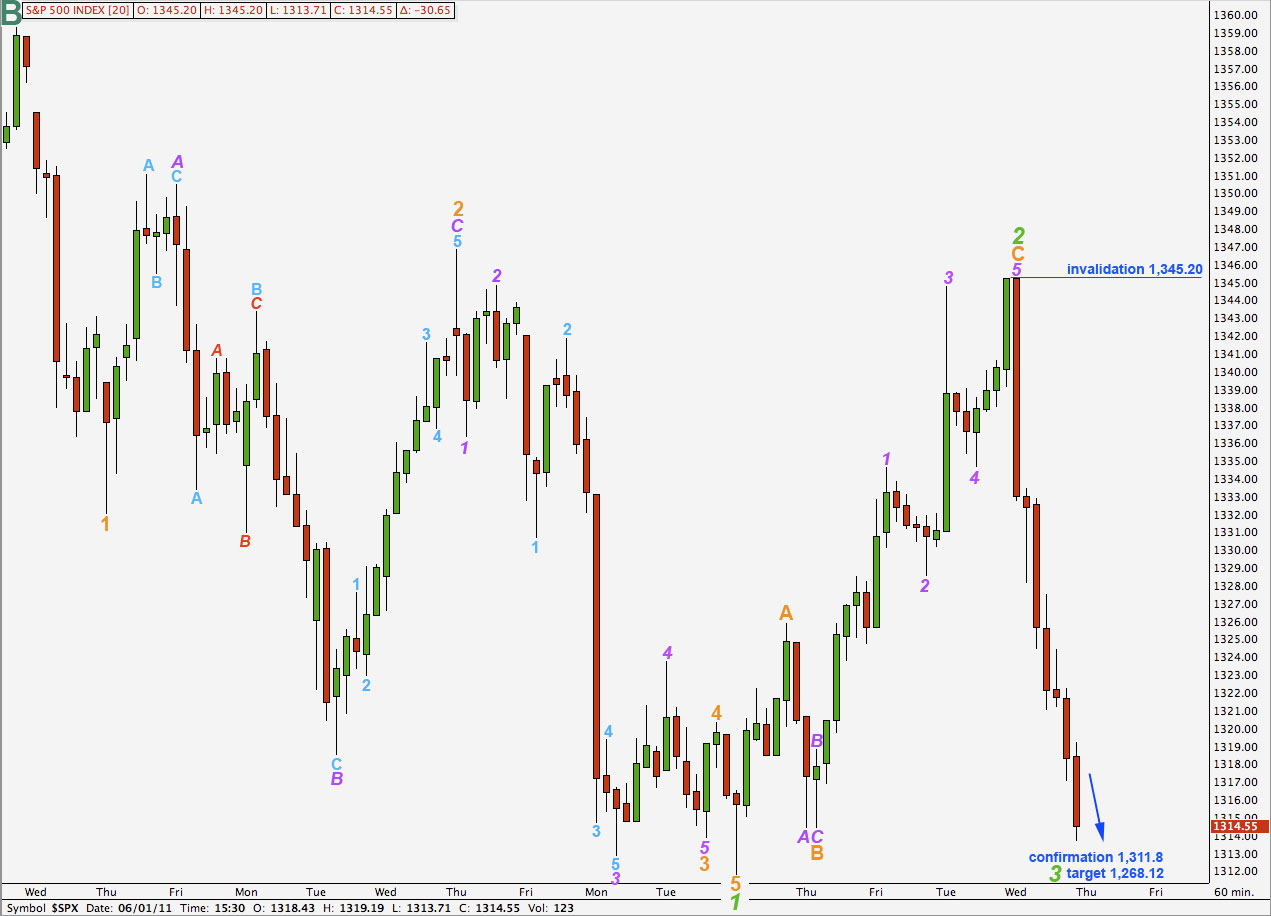
This wave count does not have a satisfactory a look as the first hourly wave count. Waves A orange and 1 purple both look like three wave structures on the hourly chart, although they can both be viewed as fives on the 15 minute chart.
There is no fibonacci ratio between waves A and C orange within wave 2 green.
Ratios within wave C orange are: wave 3 purple has no fibonacci ratio to wave 1 purple and wave 5 purple is just 0.53 points longer than 0.618 the length of wave 3 purple.
Movement below 1,311.8 would provide initial confirmation of this wave count. If price moves below this point we should expect it to continue lower to about 1,268.12 where wave 3 green would reach 1.618 the length of wave 1 green.
Movement above 1,345.2 would invalidate this wave count and confirm the first wave count.