Elliott Wave chart analysis for the S&P 500 for 26th May, 2011. Please click on the charts below to enlarge.
I have added a chart at the end of this analysis to be used as a guide to invalidation points.
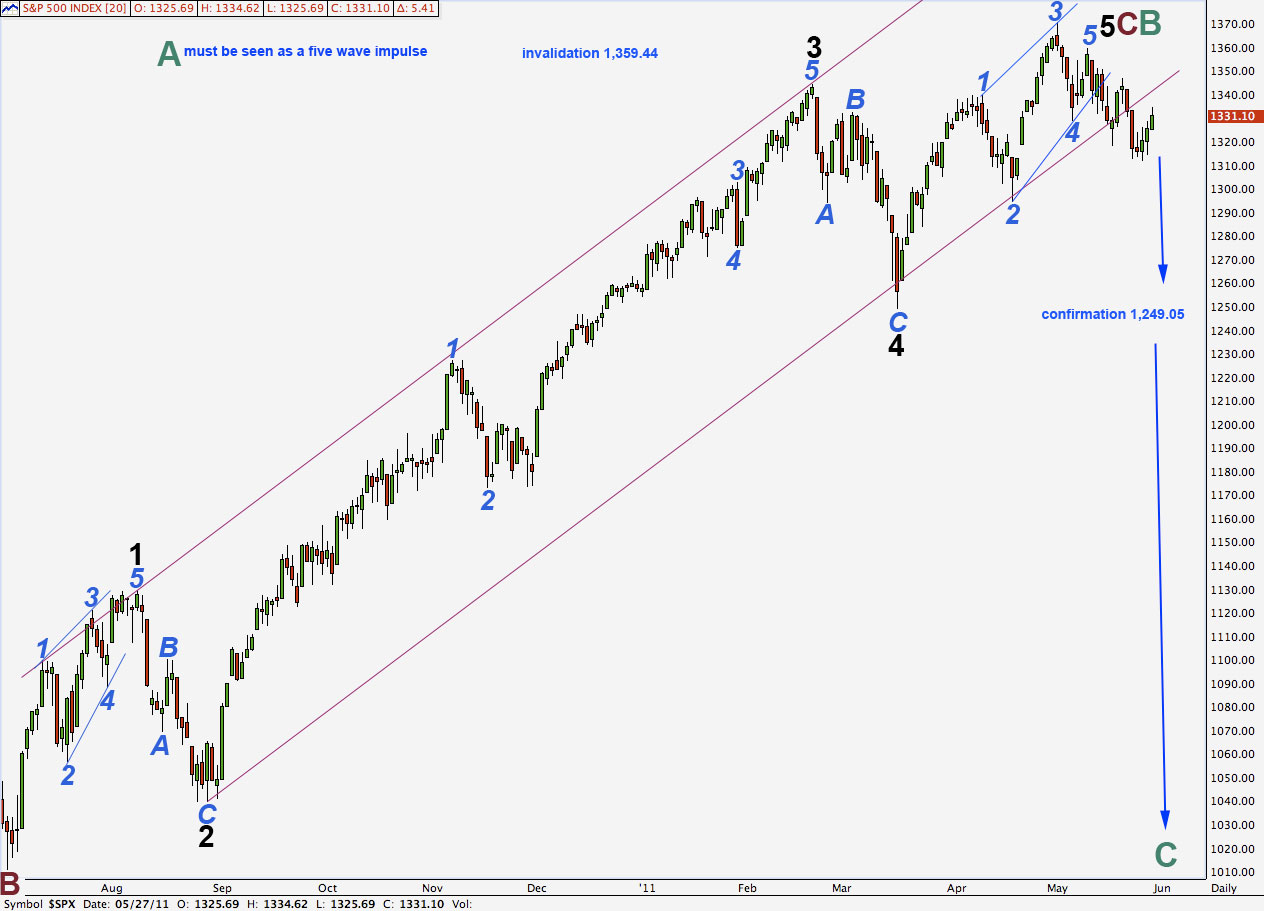
Wave counts 1, 2, 4, 5 and 7 all see the larger historical count as having the start of the correction at the all time high in October 2007 at 1,576.09. In the historic analysis, as it currently is, this wave count is listed as the “alternate”.
Wave counts 3 and 6 are listed at the end of the table and both see the larger historical count as having the start of the correction (and expanded flat) in March, 2000 at 1,552.87. These two counts do not allow for a new all time high and so do not fit with other indices (such as the Russell 2000) which have made new all time highs.
Table
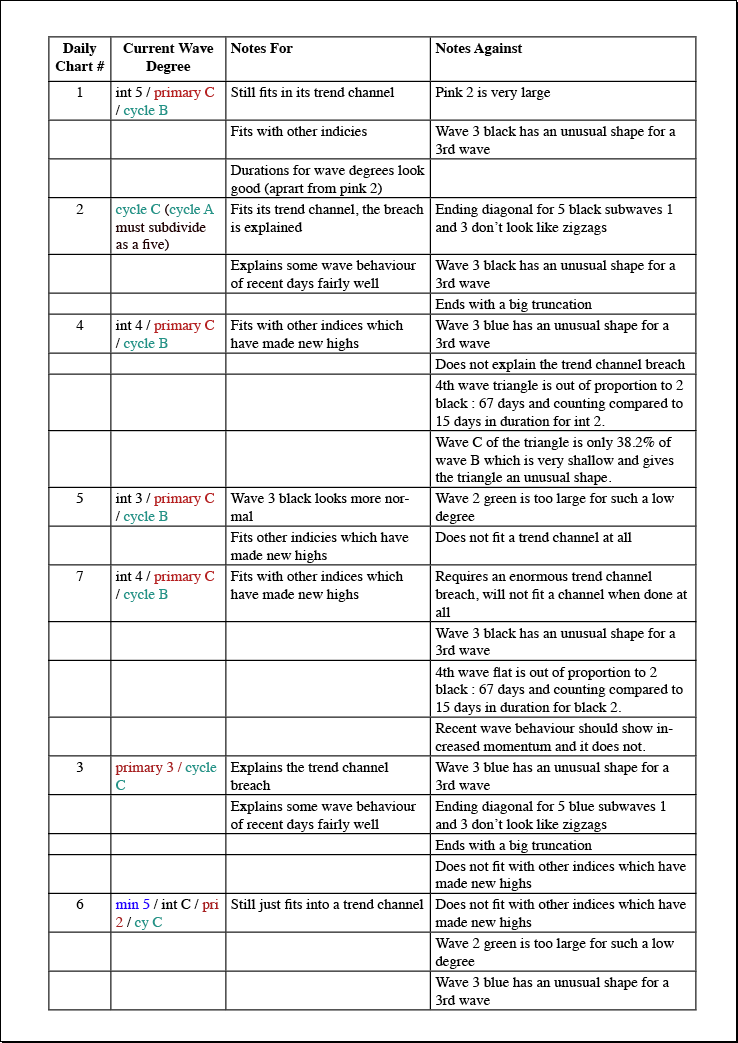
Click here to download a .pdf of the table above.
Daily Chart #1
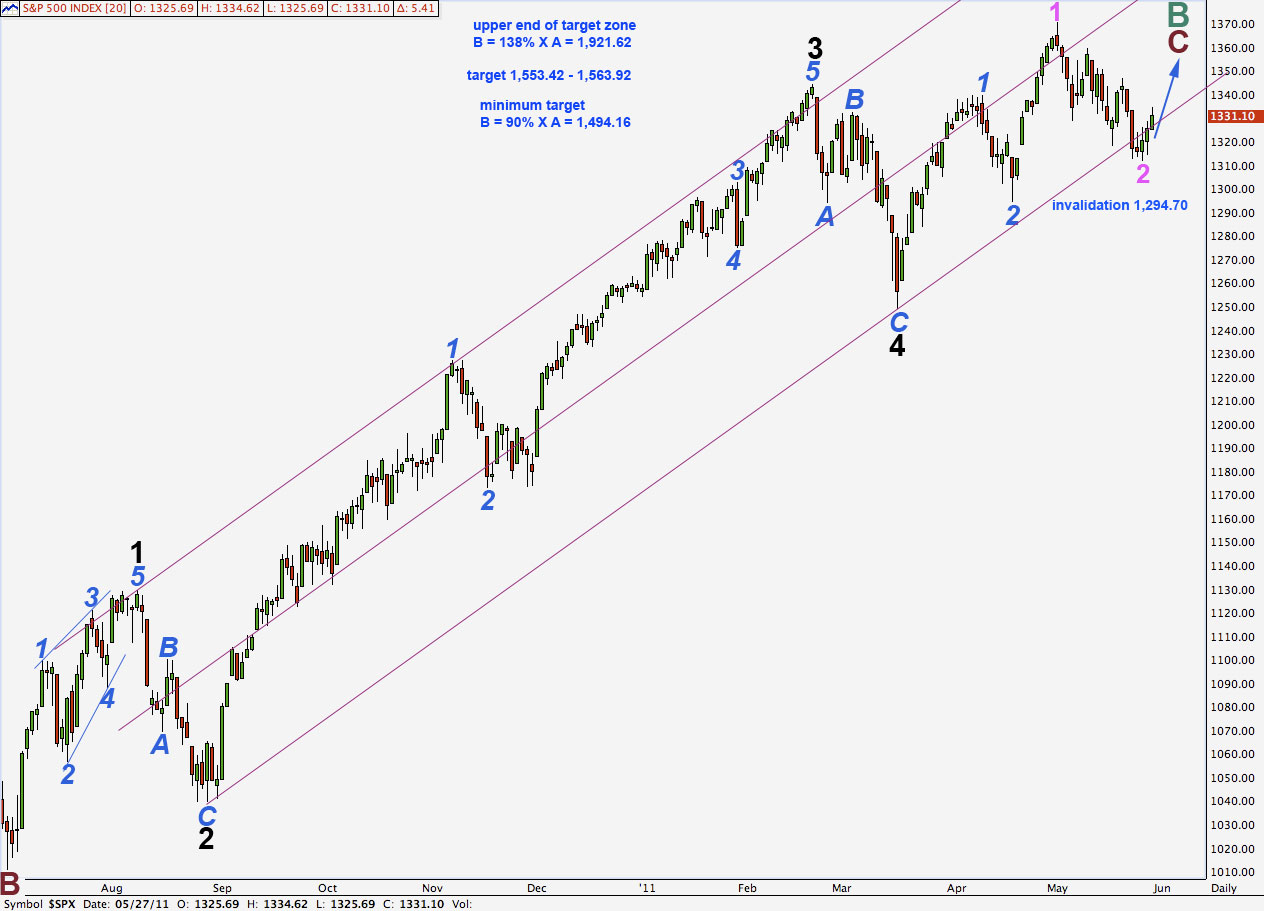
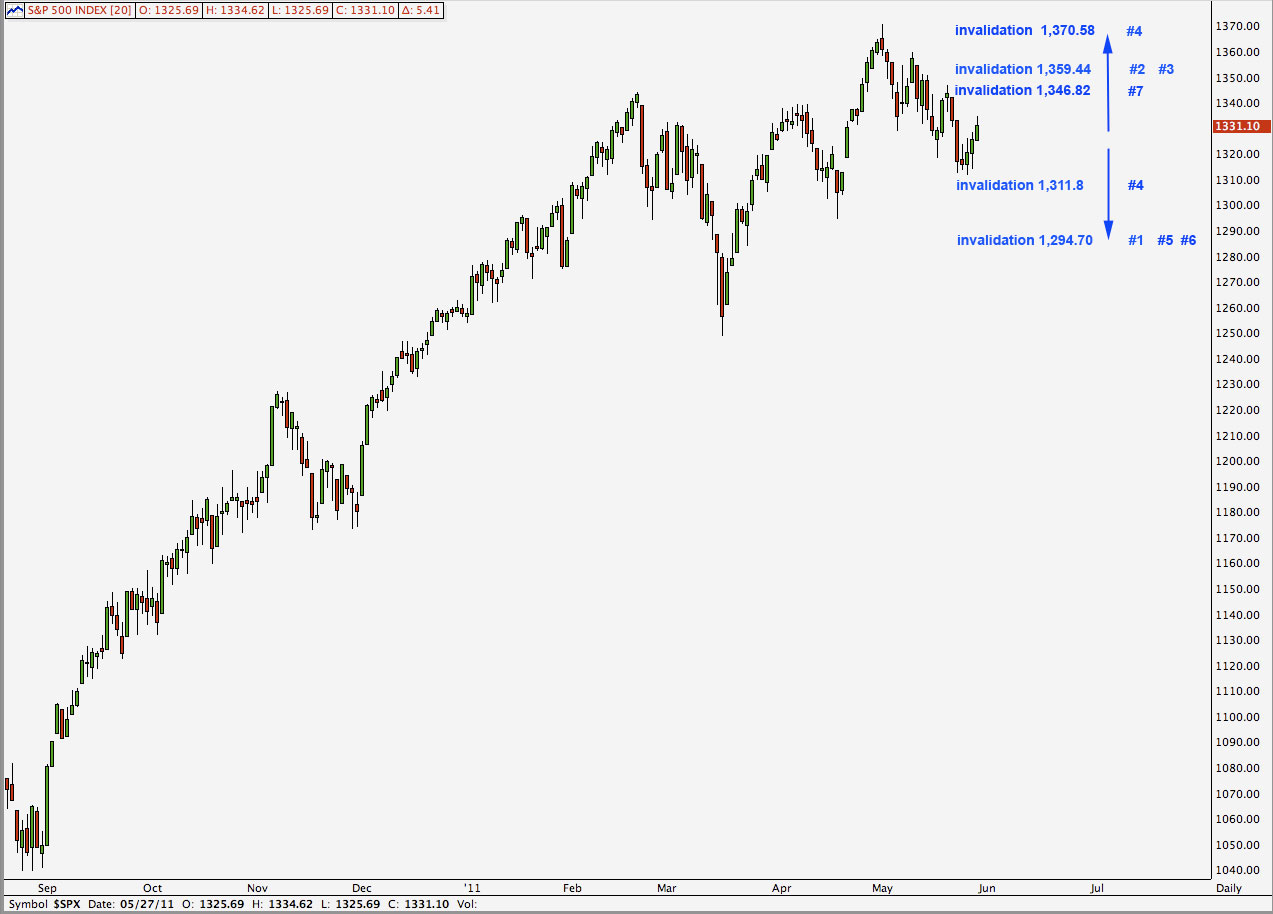
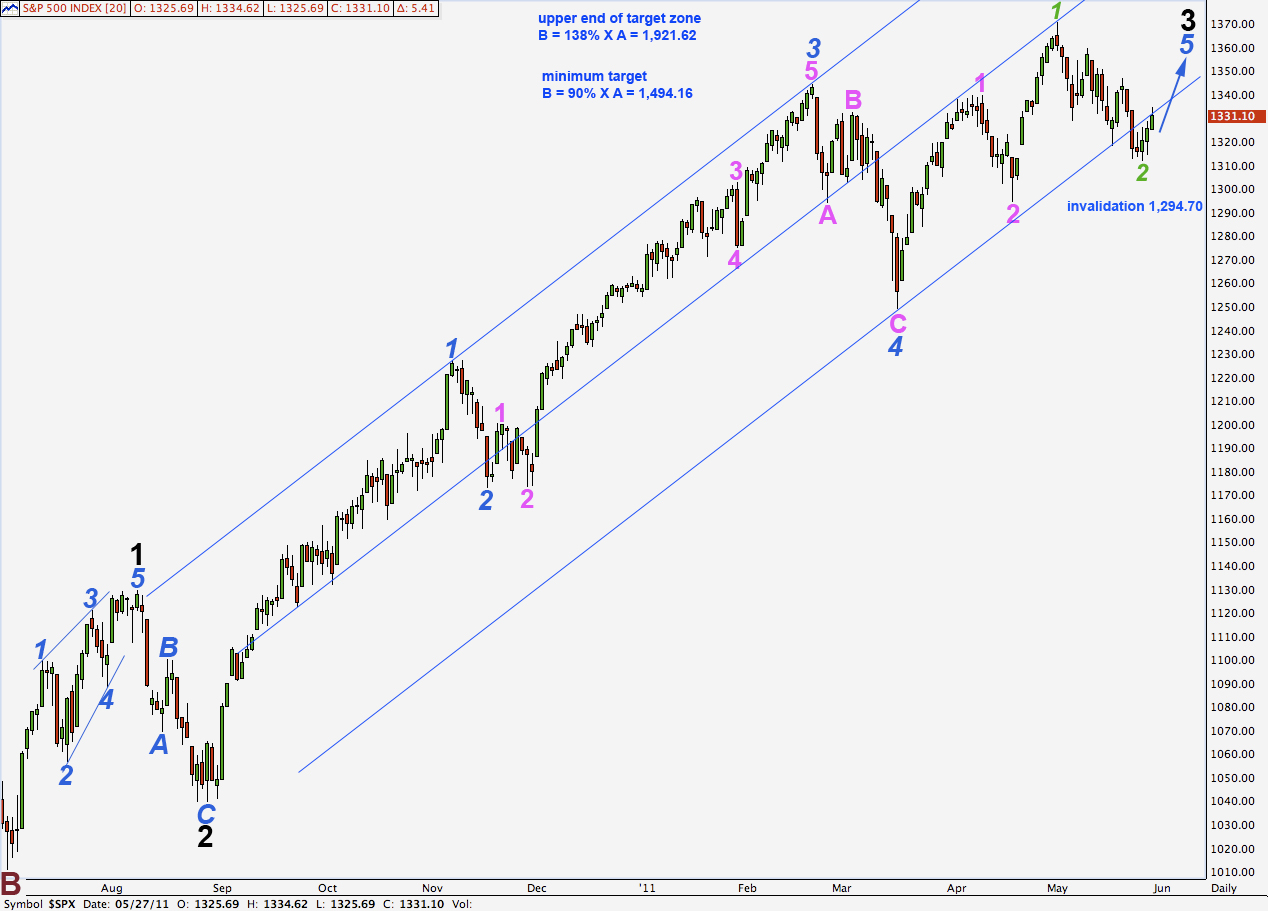
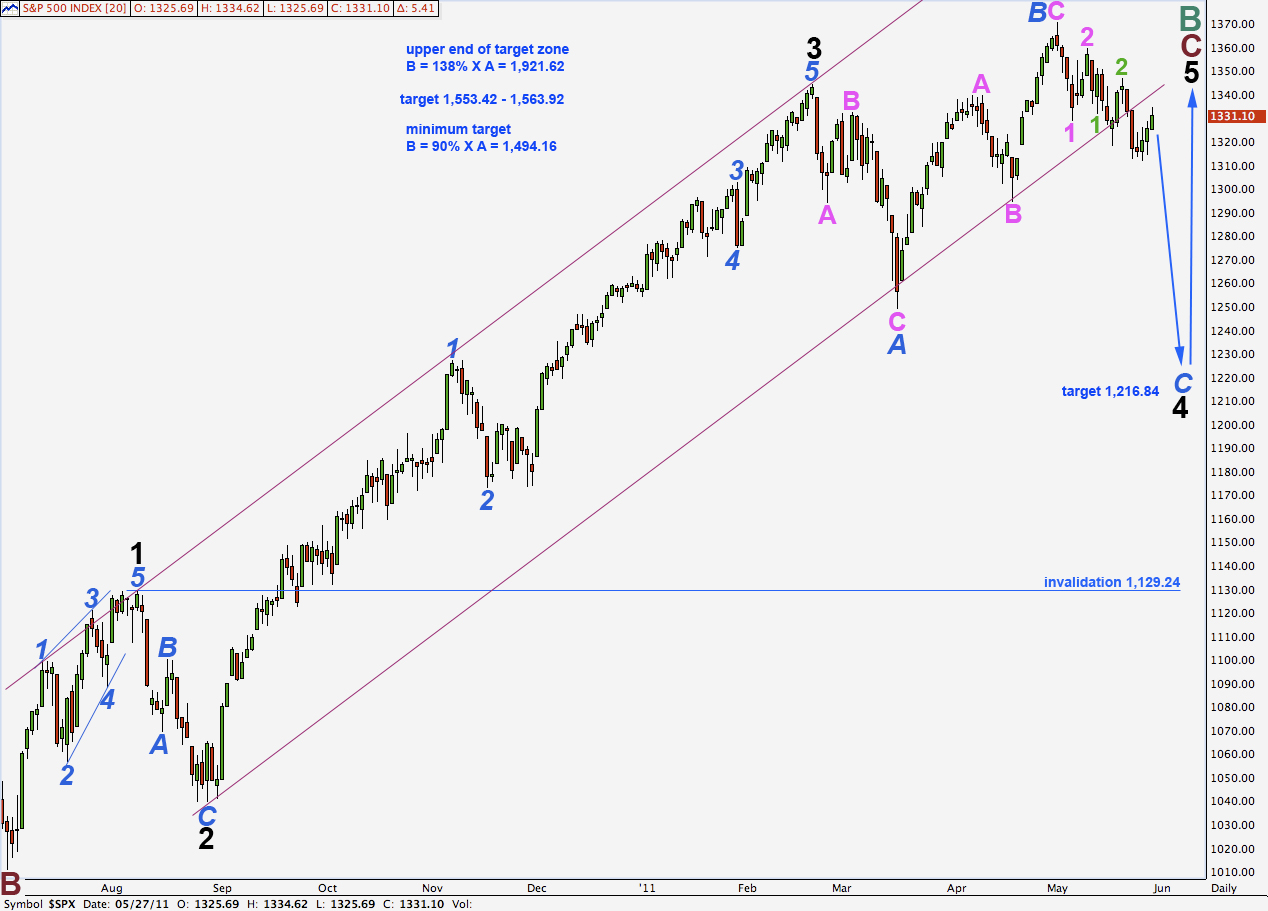
Upwards movement is taking price back into the parallel channel. Movement to a new high above 1,370.58 will fully confirm this wave count. At that stage this would be our primary wave count.
By the end of next week the situation may be much clearer. If price continues to rise the probability of this wave count will continue to increase.
At 1,494.16 this wave count will be our only wave count. At that stage there will exist possibility of new all time highs.
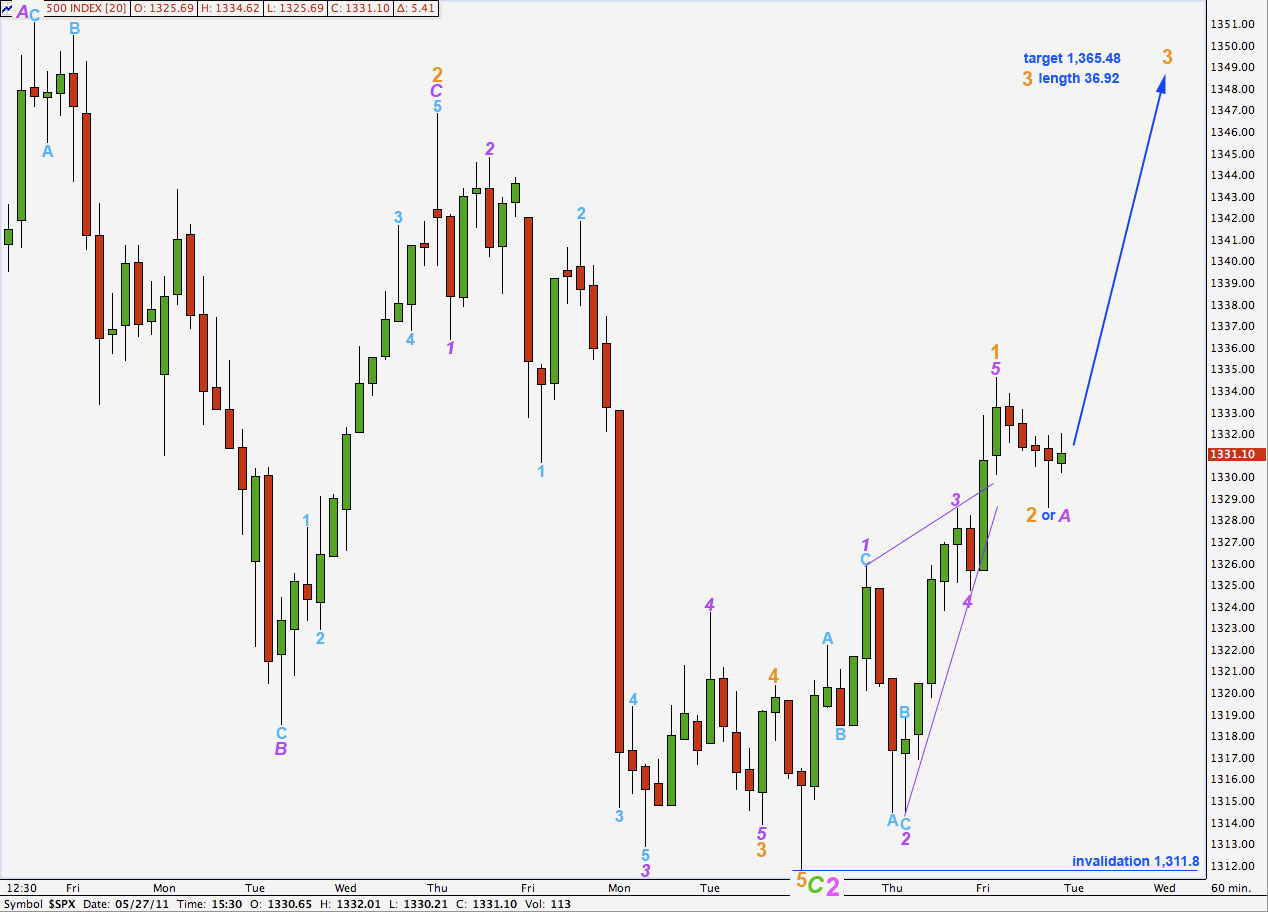
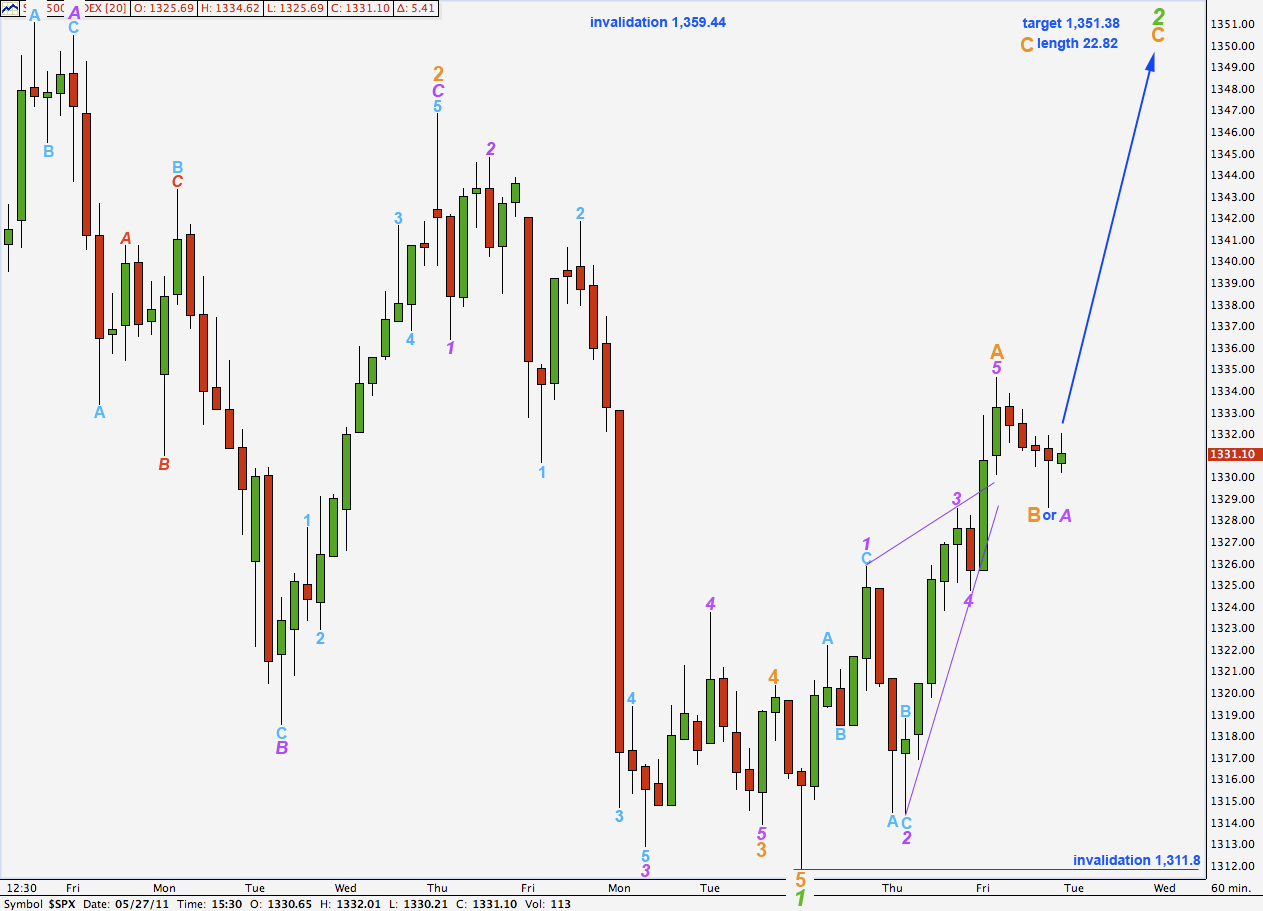
We were expecting wave 4 purple to move lower before further upwards movement. This did not happen but upwards movement may be seen as zigzags on a 5 minute chart and so this diagonal is valid. The diagonal is contracting because wave 4 purple is shorter than wave 2, but wave 3 is still slightly the longest. The fifth wave has overshot the 1-3 trend line.
Thereafter, downwards movement has a corrective count of 7 on a 5 minute chart. This may be either wave 2 orange complete as a zigzag, or just wave A purple of wave 2 orange complete. It depends upon the degree of labeling given to this small downwards piece of movement.
Any further movement downwards may not move beyond the start of wave 1 orange below 1,311.8.
We should be expecting further upwards movement for next week as most likely.
If wave 2 orange does not move any lower then a target for wave 3 orange is at 1,365.48 where it will reach 1.618 the length of wave 1 orange. If wave 2 orange does move lower then when it is finished we should expect wave 3 orange to follow it to be about 36.92 points in length.
Daily Chart #2
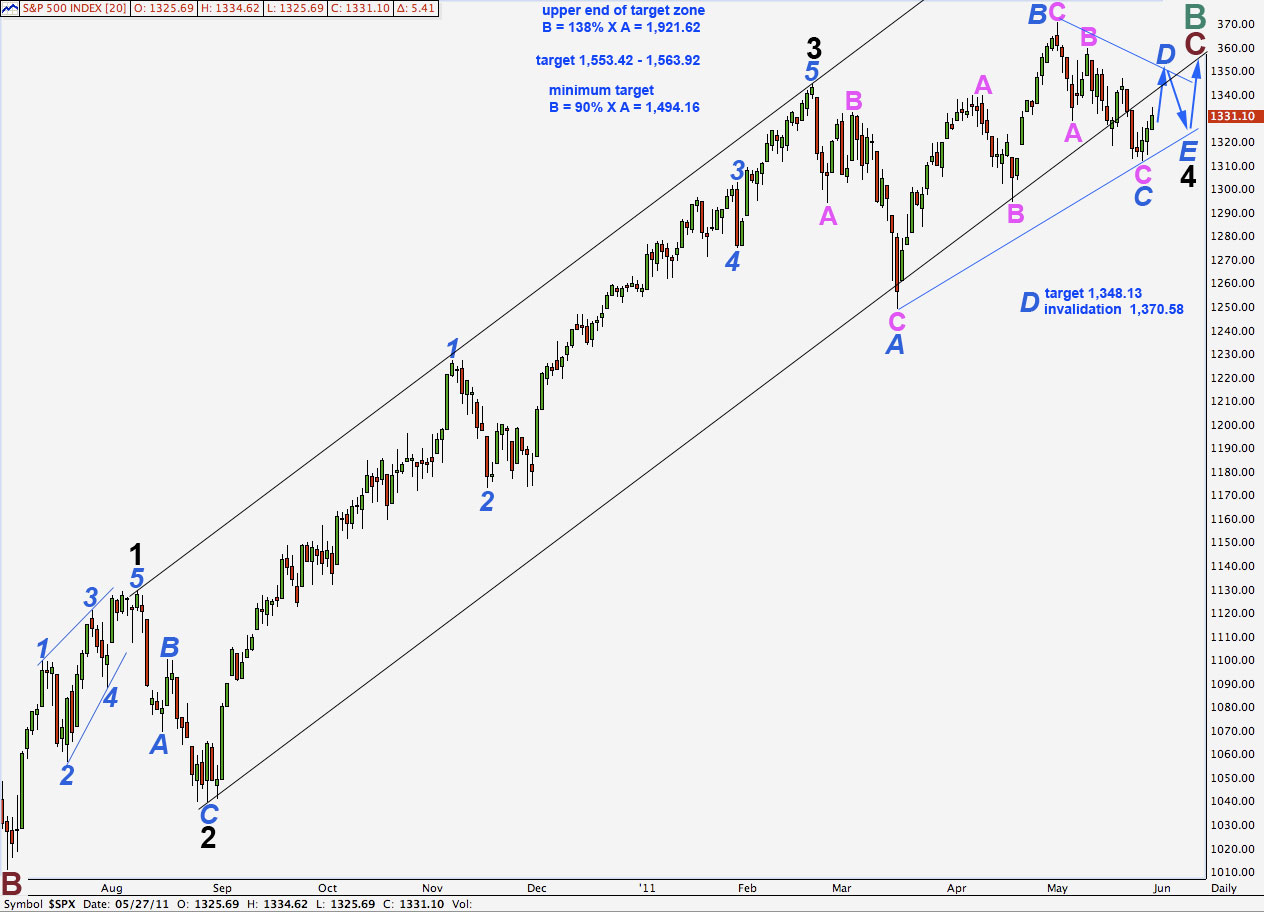
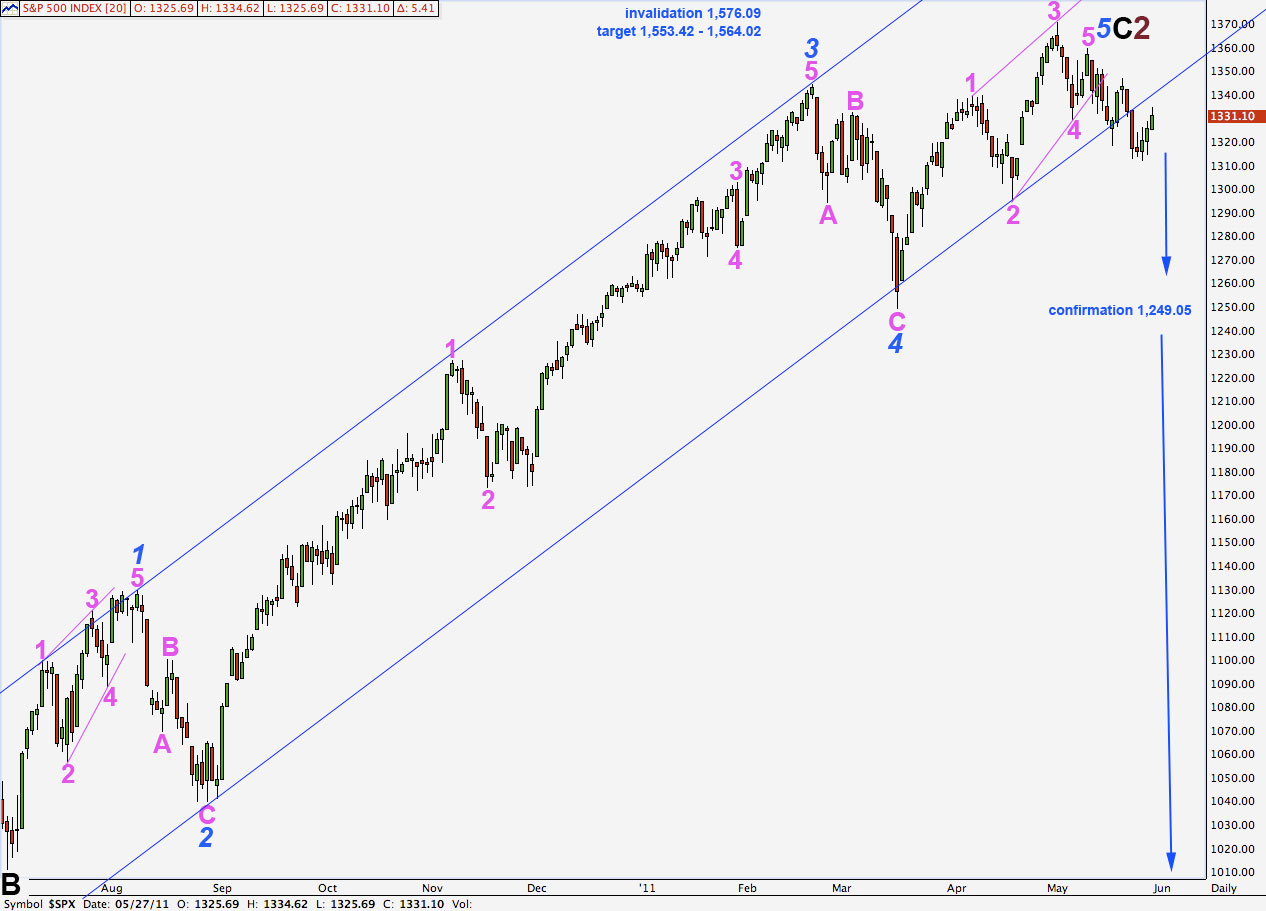
This is the only chart which is following the alternate historic wave count but requires cycle wave A downwards, from 1,576.06 to 666.79, to be viewed as a five wave structure. All other wave counts which follow the alternate historic count see this wave as a three, which it is most easily seen as. This is because cycle B has not reached 90% the length of wave A, which is a requirement for a flat correction where A subdivides into a three.
The last four days movement place some doubt on this wave count, and all others which see a significant high in place. Wave behaviour is no longer supporting this idea.
The short term movements and subdivisions of this hourly wave count are the same as the main hourly wave count.
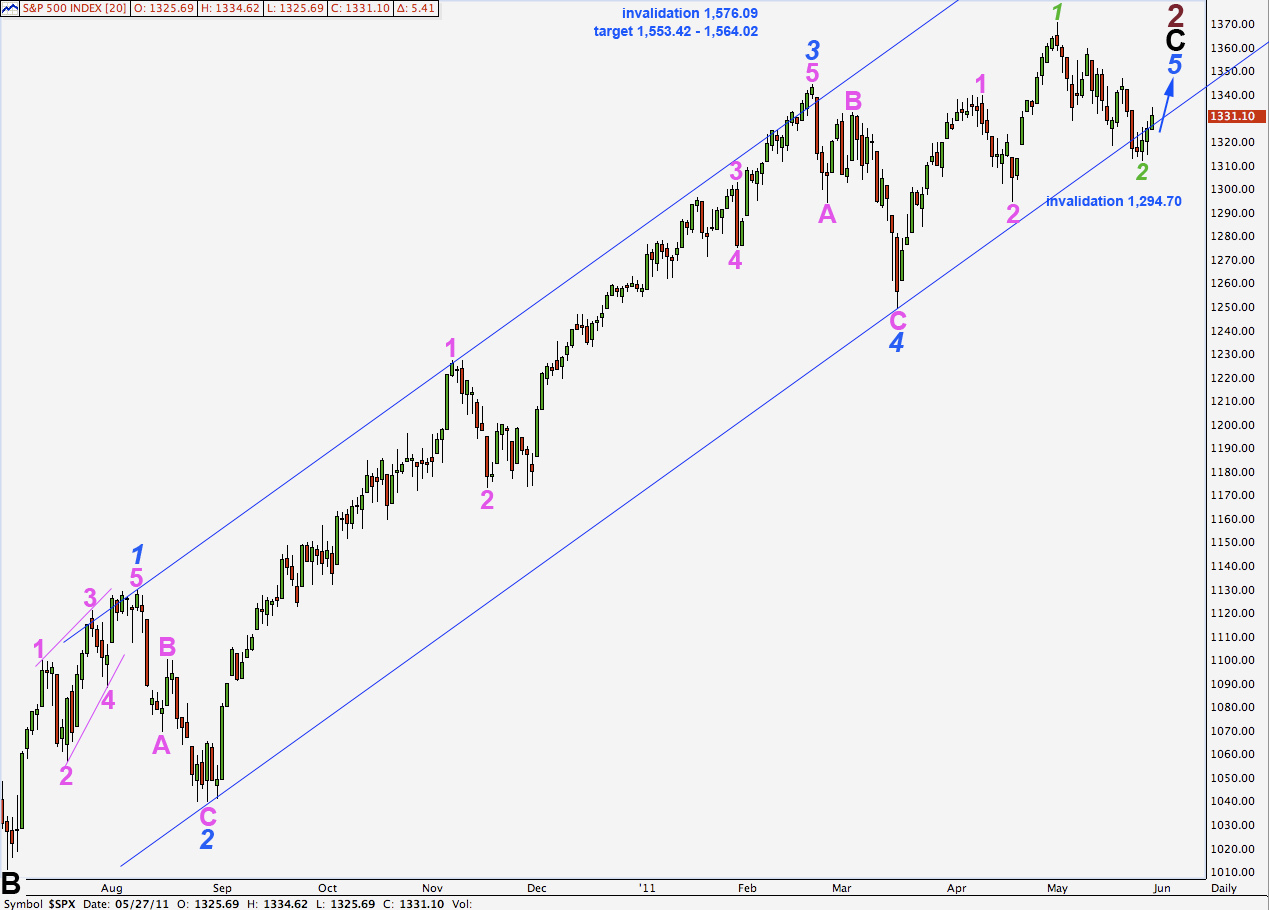
If wave B orange is complete then a target for wave C orange is equality with wave A orange at 1,351.38.
If wave B orange does move lower then when it is complete we shall expect the following wave C to be about 22.82 points in length.
Wave 2 green may not move beyond the start of wave 1 green. This wave count is invalidated with movement above 1,359.44.
Daily Chart #4
Daily Chart #5
Daily Chart #7
Daily Chart #3
Daily Chart #6
Invalidation Guide