Elliott Wave chart analysis for the S&P 500 for 24th May, 2011. Please click on the charts below to enlarge.
I have organised the charts below into a table for quick comparison of points for and against each chart.
I have kept the same number for each wave count that I used yesterday, for continuity’s sake, and have reorganised them into a more logical order instead of just 1, 2, 3… and so on.
Wave counts 1, 2, 4, 5 and 7 all see the larger historical count as having the start of the correction at the all time high in October 2007 at 1,576.09. In the historic analysis, as it currently is, this wave count is listed as the “alternate”.
Wave counts 3 and 6 are listed at the end of the table and both see the larger historical count as having the start of the correction (and expanded flat) in March, 2000 at 1,552.87. These two counts do not allow for a new all time high and so do not fit with other indices (such as the Russell 2000) which have made new all time highs.
Table
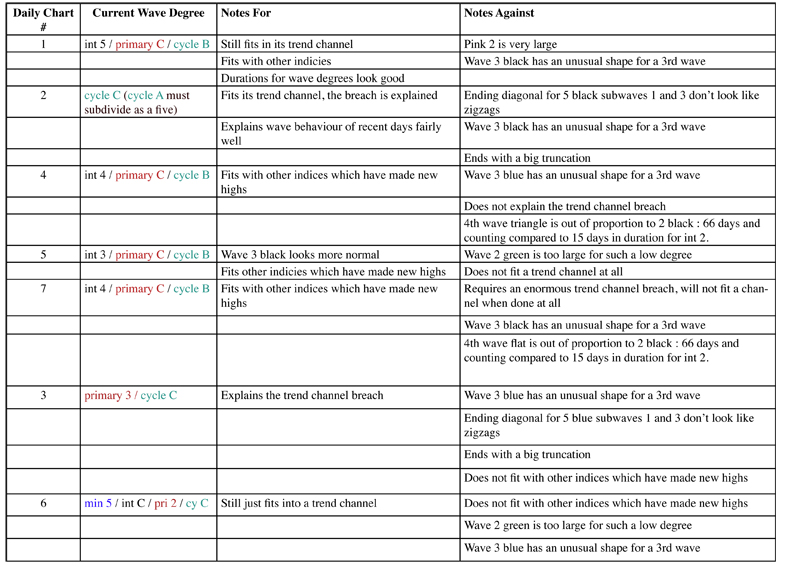
Click here to download a .pdf of the table above.
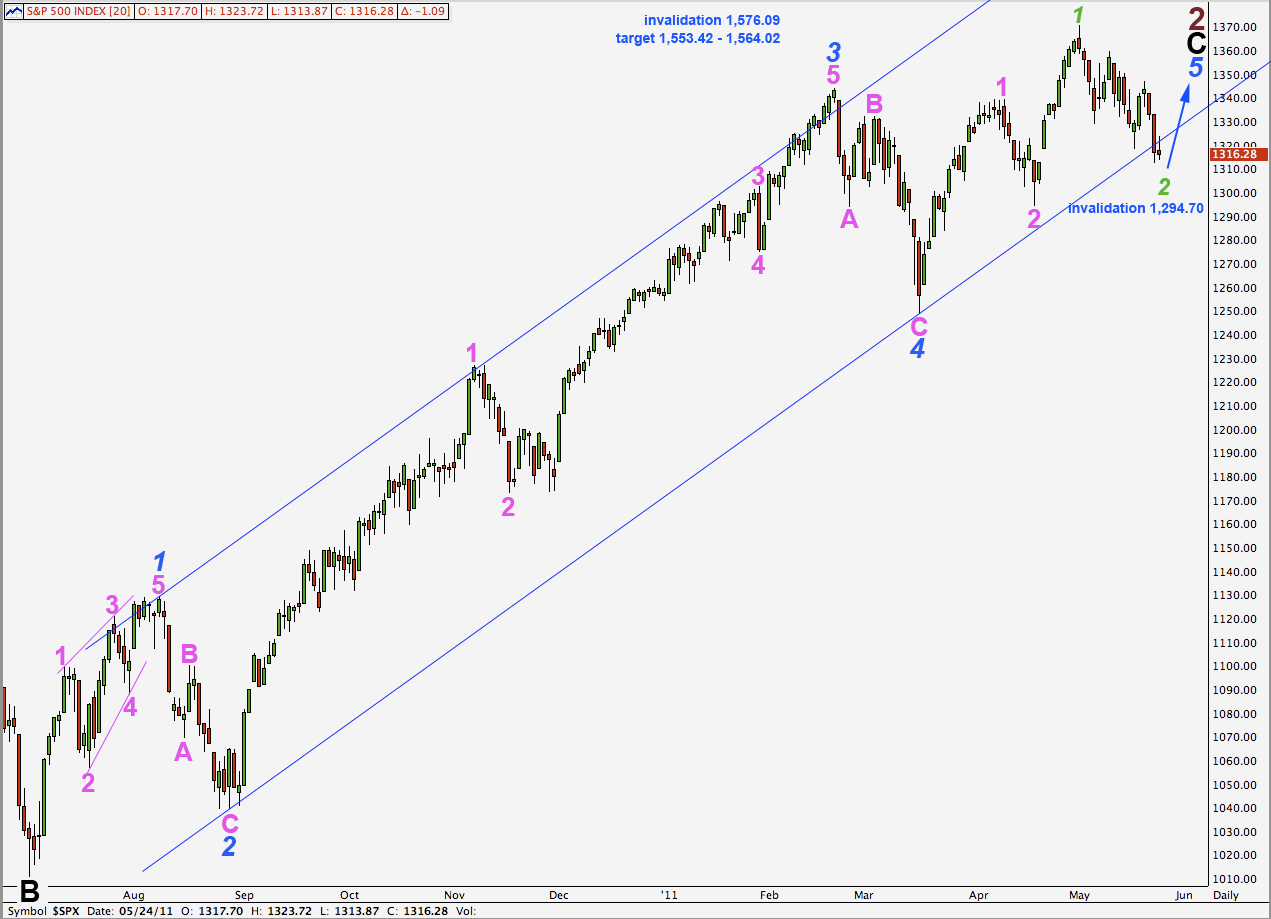
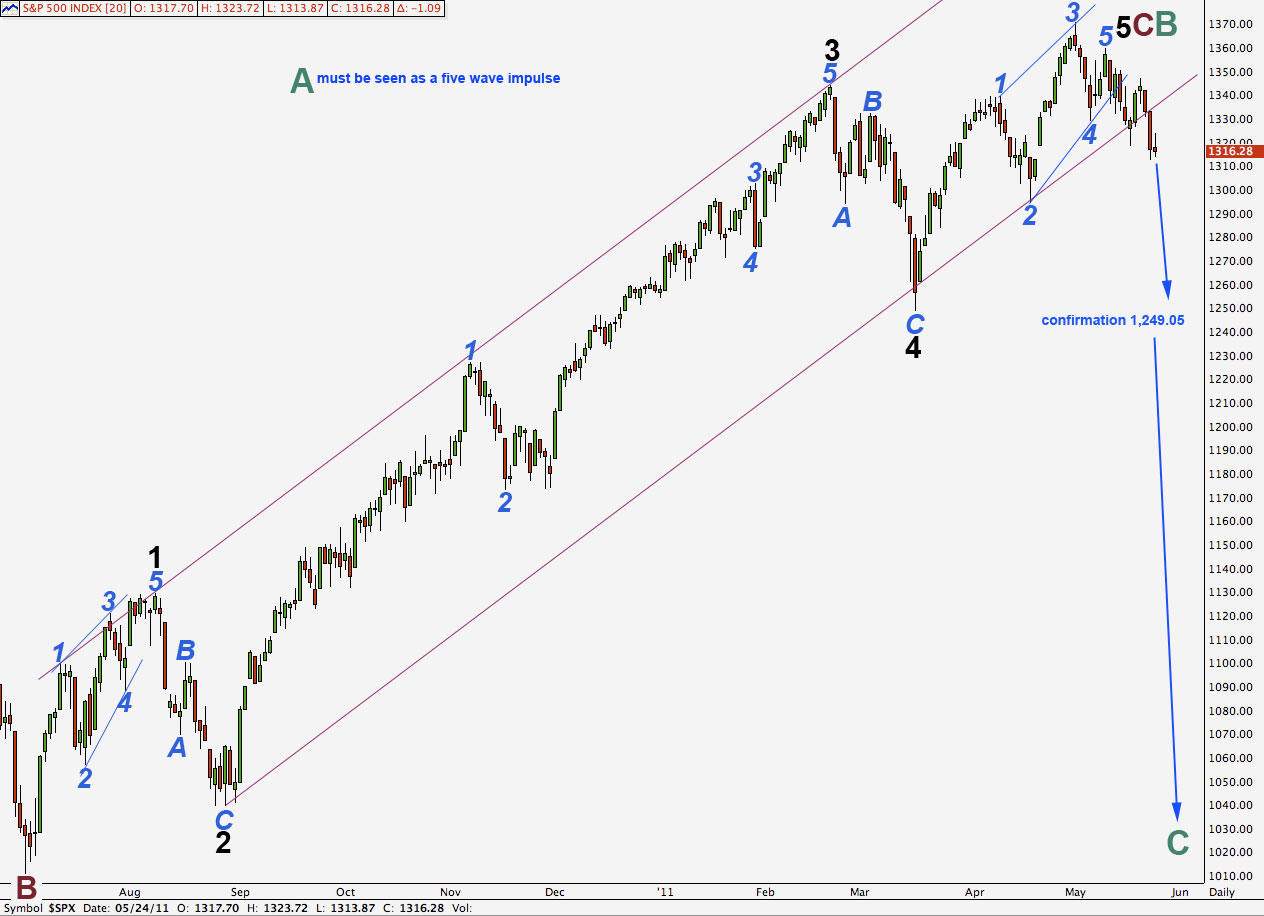
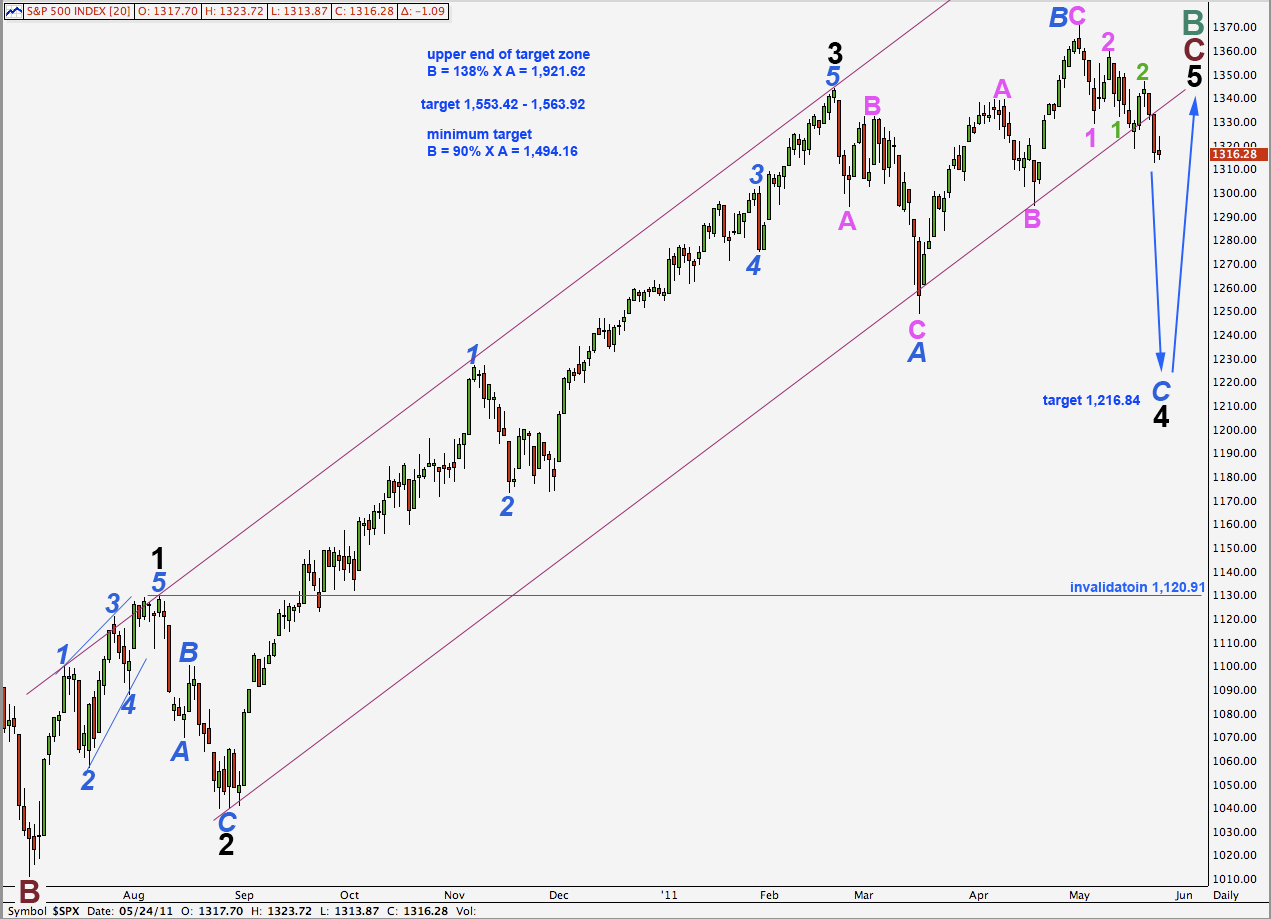
Daily Chart #1
Importantly the trend channel does not yet have a full breach, just an overshoot. Further notes are in the table.
5 orange may possibly be over at 1,313.87, with a small truncation, or that may be only wave 1 purple of wave 5 orange which has further down to go.
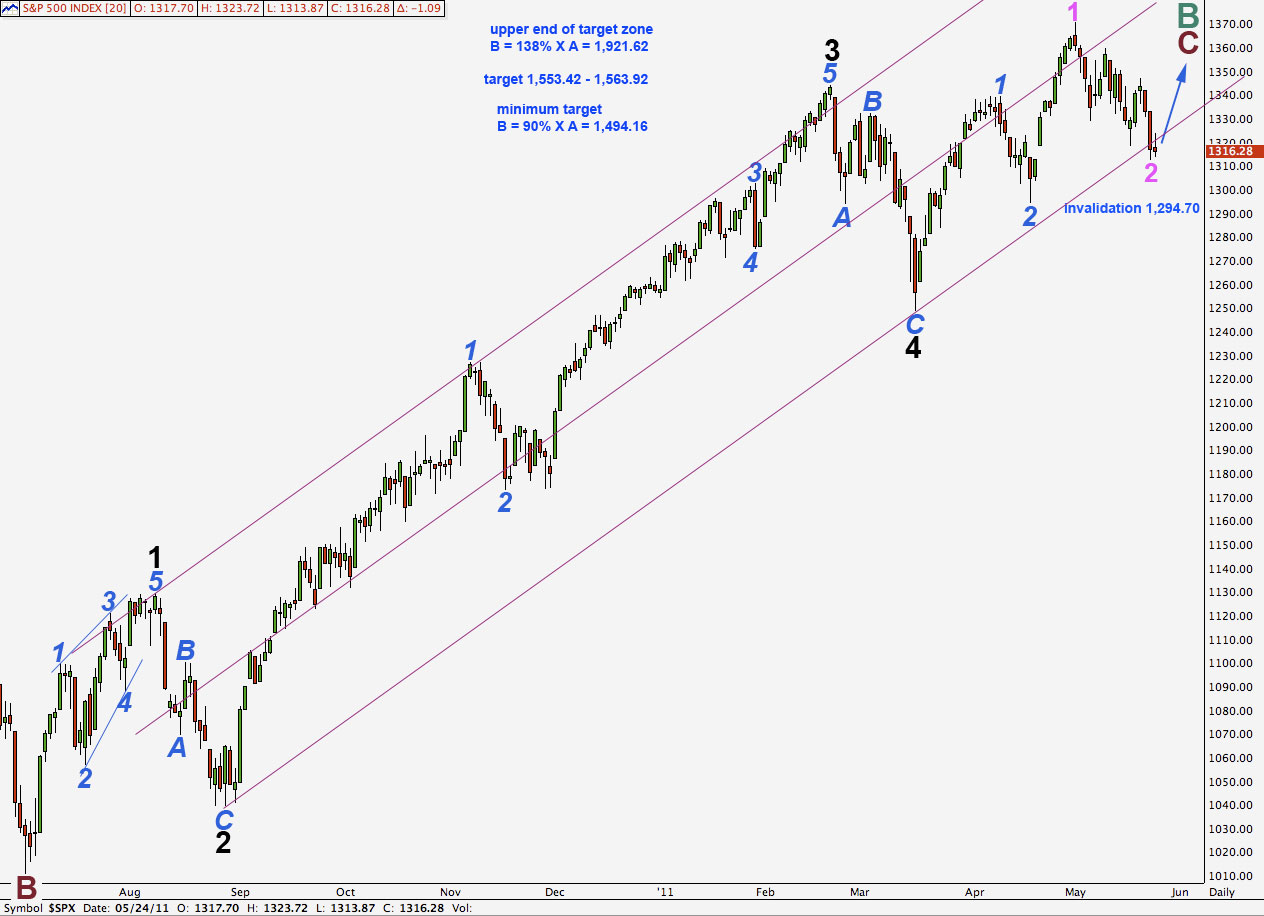
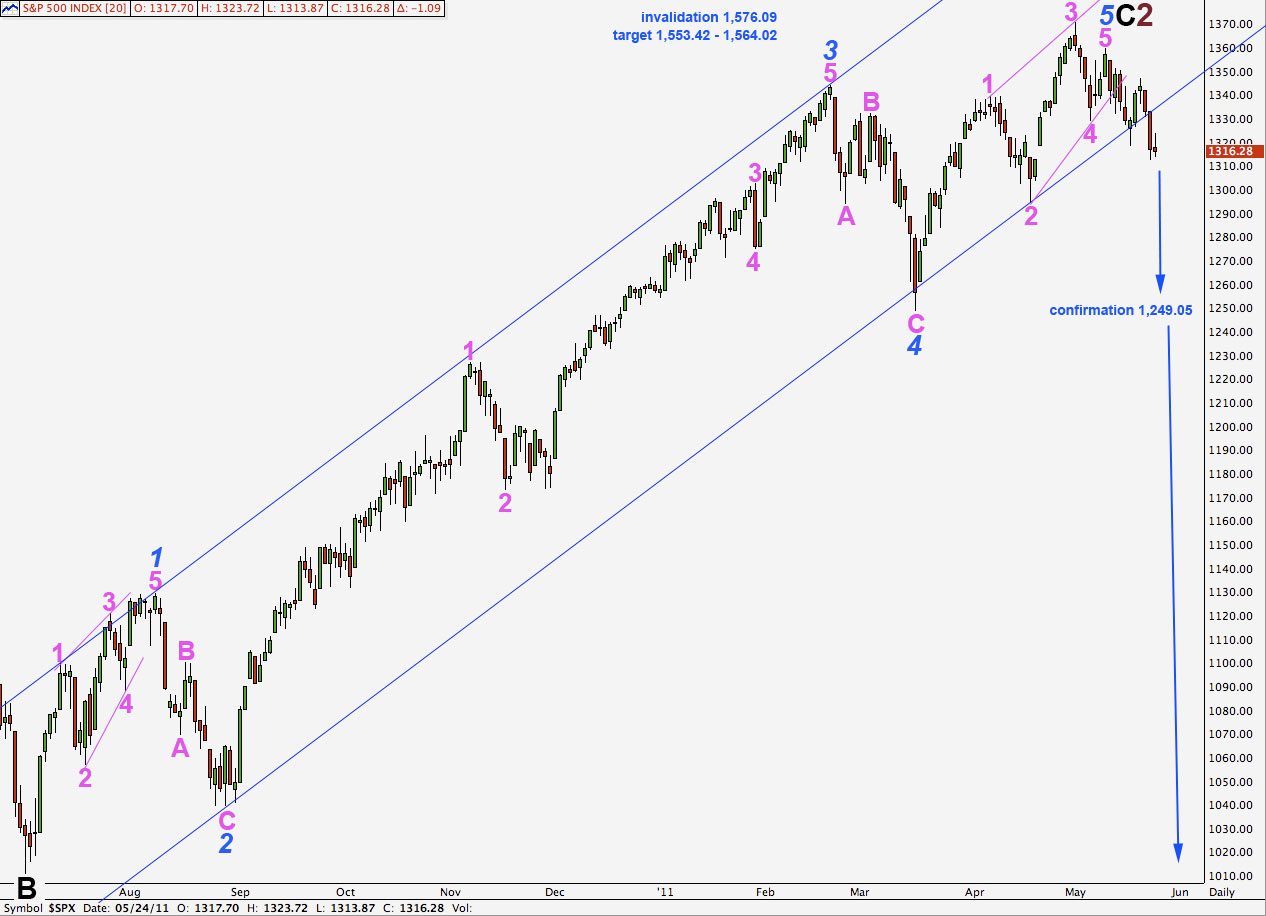
Daily Chart #2
This is the only chart which is following the alternate historic wave count but requires cycle wave A downwards, from 1,576.06 to 666.79, to be viewed as a five wave structure. All other wave counts which follow the alternate historic count see this wave as a three, which it is most easily seen as. This is because cycle B has not reached 90% the length of wave A, which is a requirement for a flat correction where A subdivides into a three.
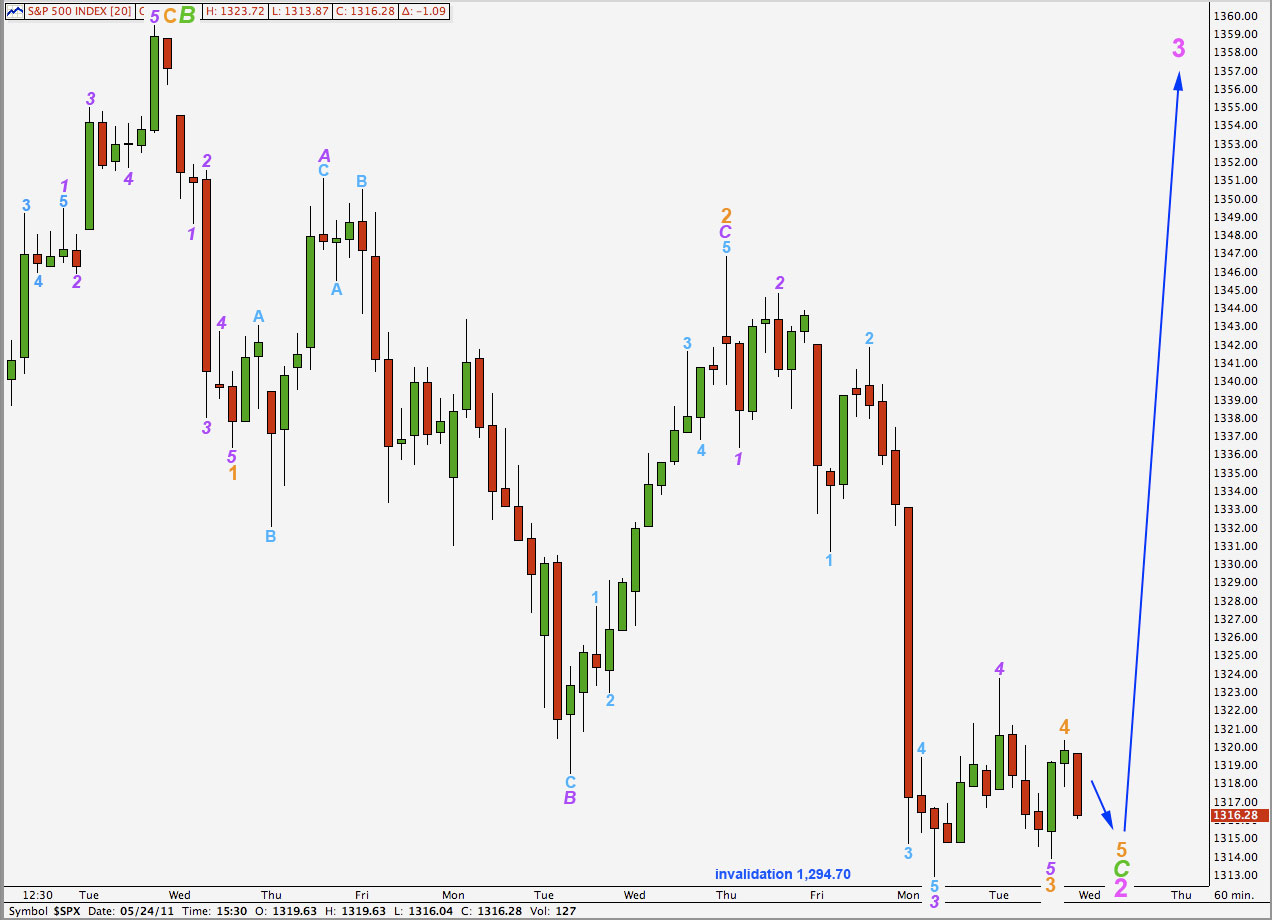
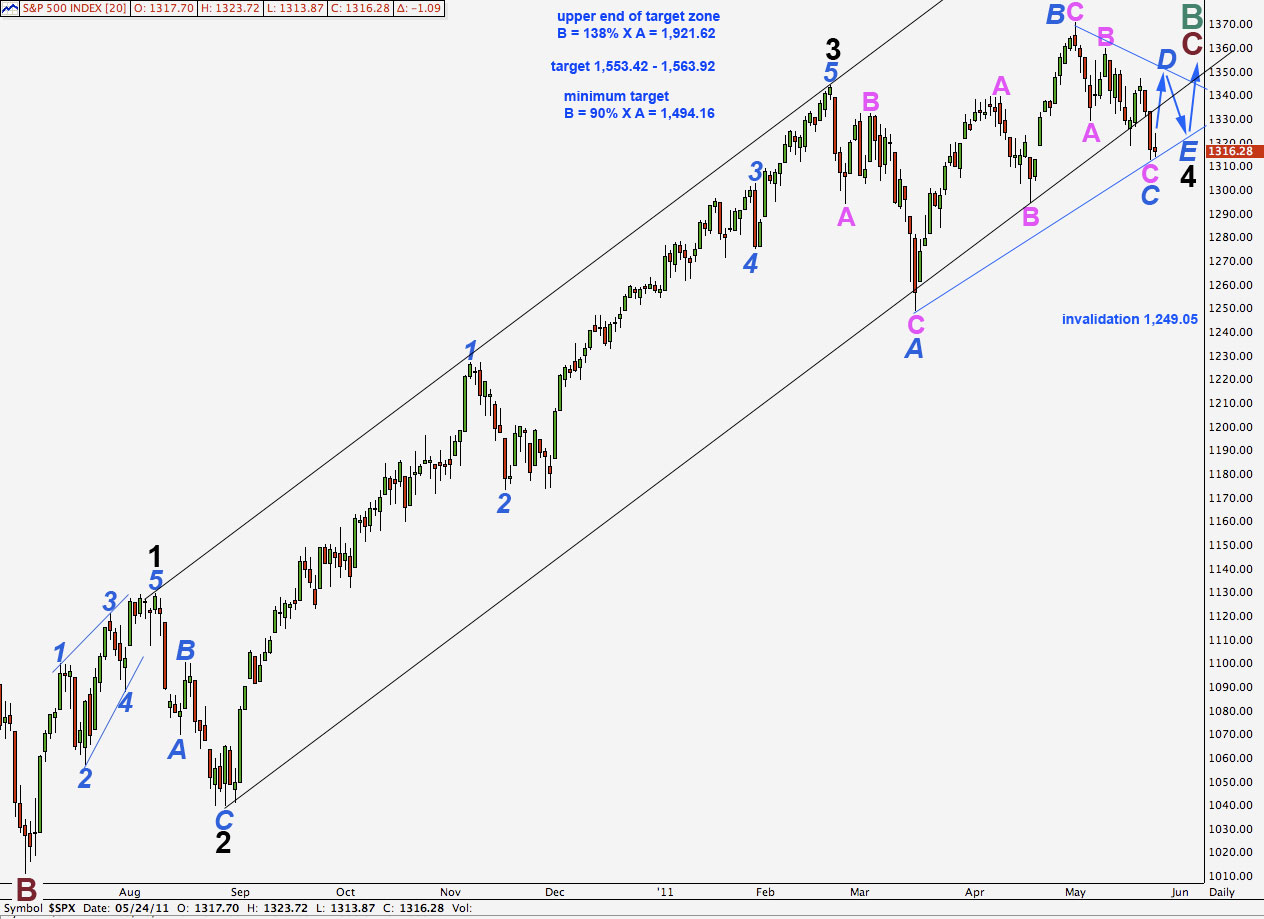
I have labeled wave 3 purple here as ending in a slight truncation.
Within wave 3 purple there are no adequate fibonacci ratios between aqua waves 1, 3 and 5.
My labeling of wave 5 aqua to end wave 3 purple may be premature. This may be only wave 1 of wave 5 aqua and so it may yet develop a better fibonacci ratio with further downwards movement.
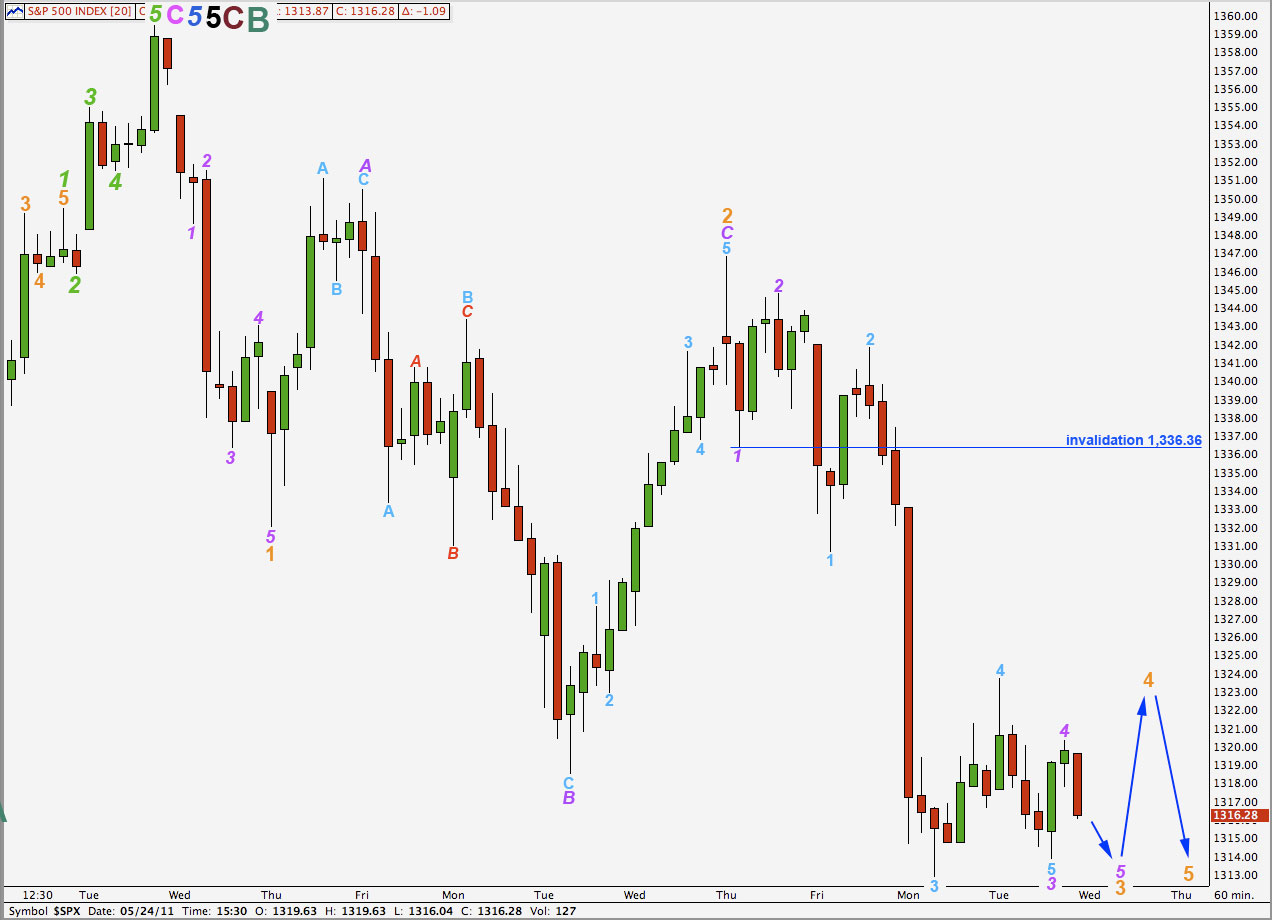
Wave 4 orange to come may not move into wave 1 orange price territory. This hourly wave count is invalidated with movement above 1,336.36.
Daily Chart #4
Daily Chart #5
Daily Chart #7
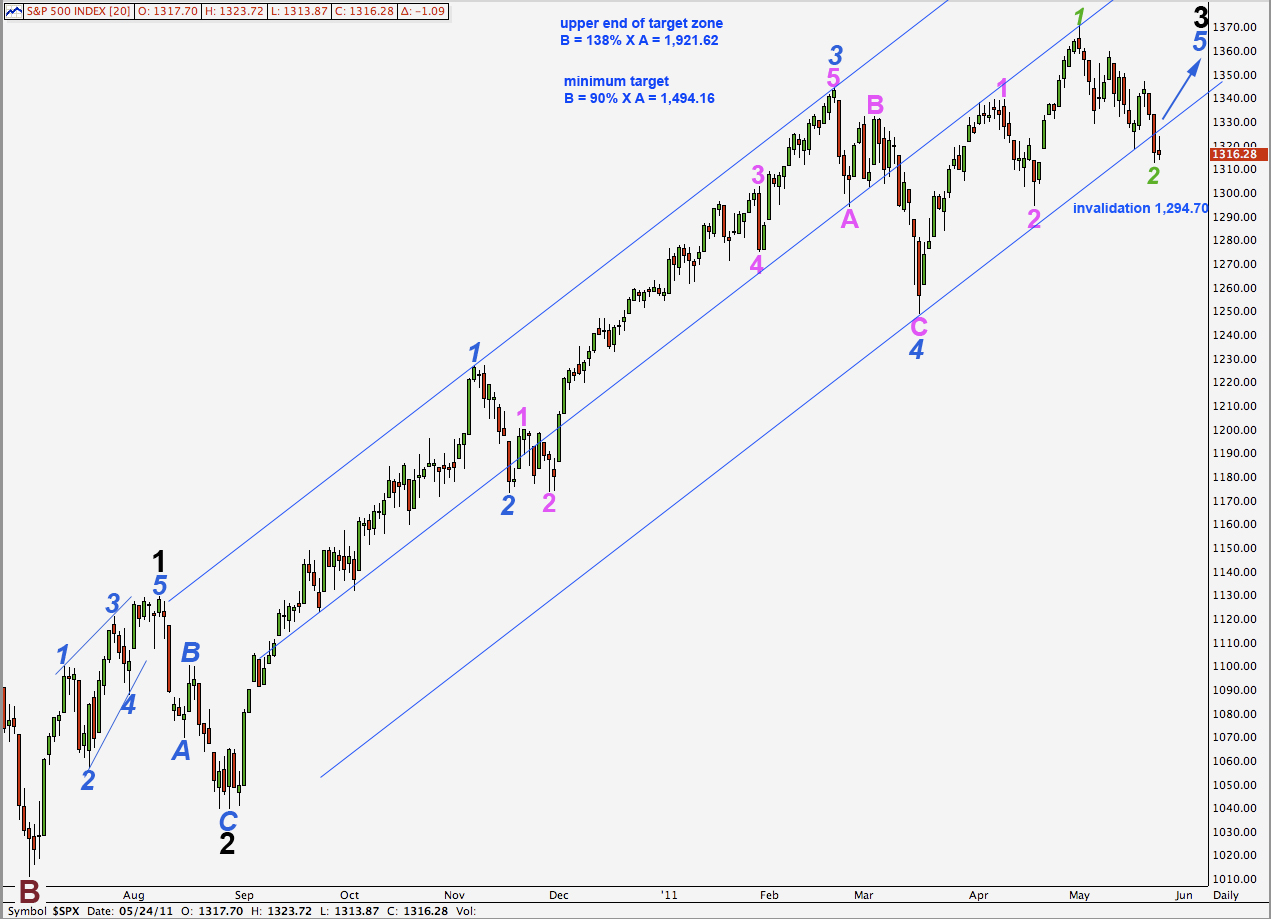
Daily Chart #3
Daily Chart #6