
Elliott Wave chart analysis for the S&P 500 for 23rd May, 2011. Please click on the charts below to enlarge.
At this stage there are several possibilities that I can see. The situation is particularly unclear after Monday’s strong downwards movement.
Therefore, I have charted as many wave counts as I can see. There would be more if some of the ideas contained in these charts are combined differently but I think that 7 is more than enough.
Daily Wave Count #1
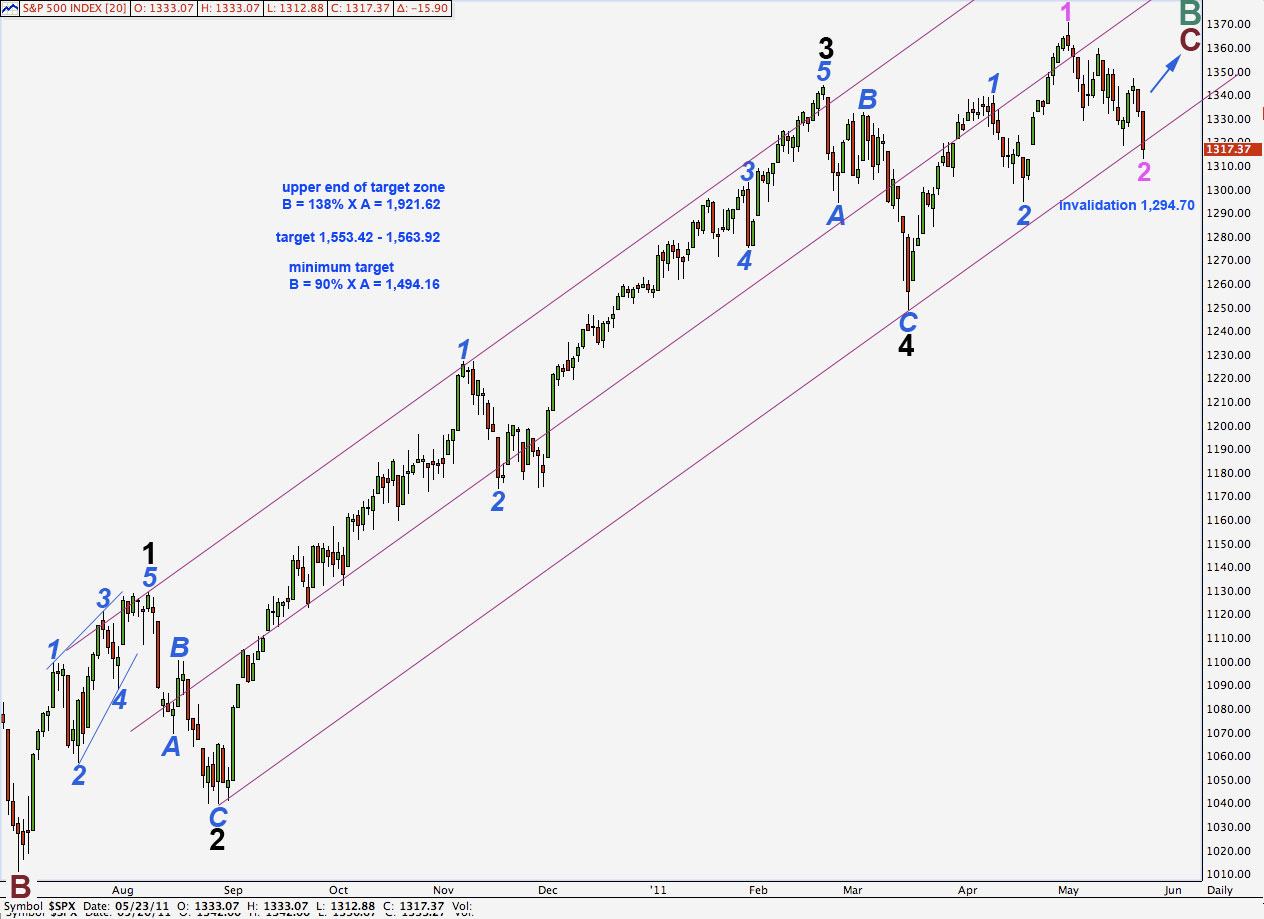
The S&P 500 is within minute wave 2 correction within minor wave 3 upwards within intermediate wave 5 within primary wave C to end cycle wave B.
Cycle wave A most easily subdivides into a three and so cycle wave B must reach at least 90% the length of wave A at 1,494.16.
Minute (pink) wave 2 may not move beyond the start of minute wave 1. This wave count is invalidated with movement below 1,294.70.
If we draw this trend channel from the lows of 2 to 4 black and place a parallel copy on the high of 1 black, then for wave 2 pink we have an overshoot for Monday and not a full channel breach. The midline of this channel does not work as well as drawing it using Elliott’s first technique. Because of this it makes me think that drawing it in this manner may be incorrect.
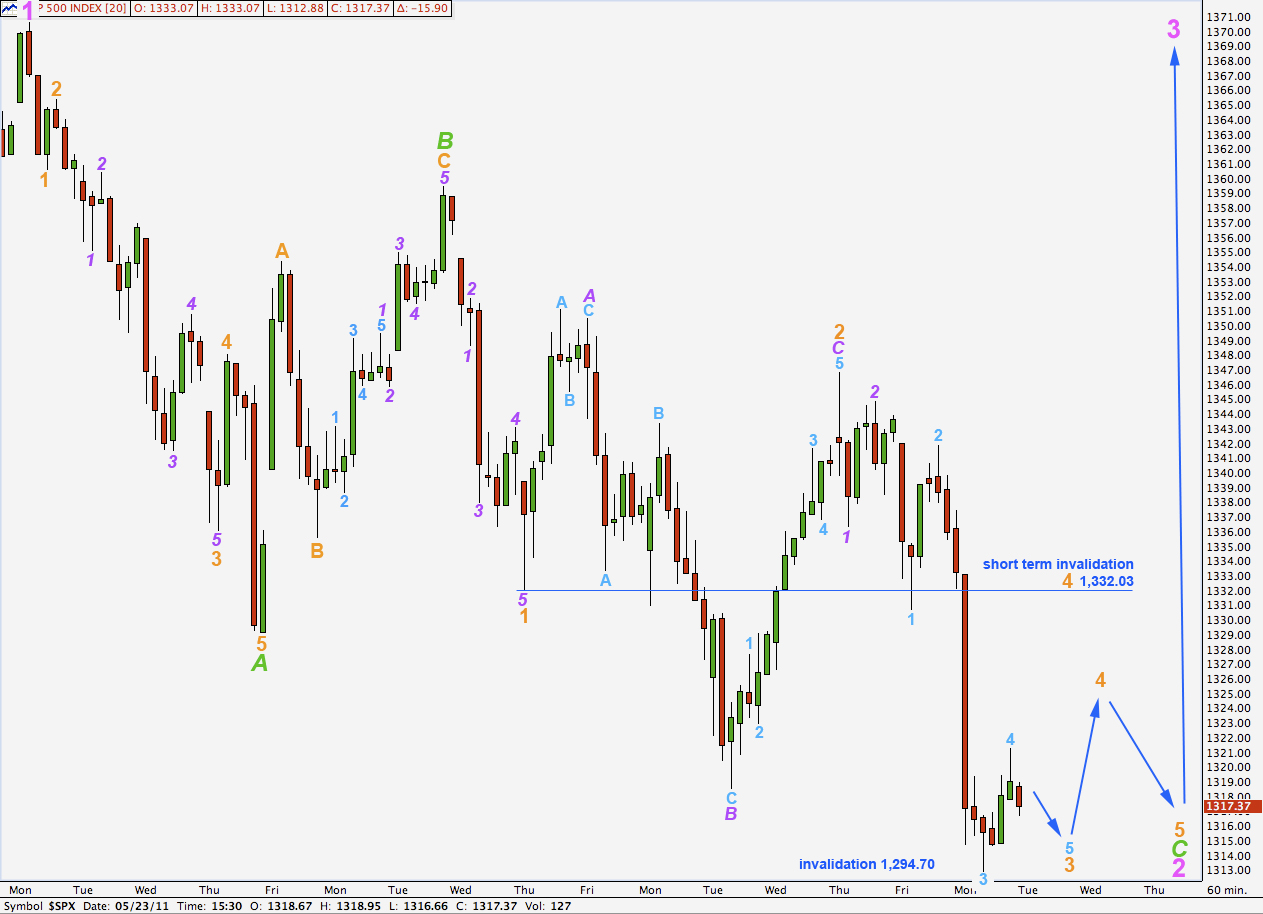
On the hourly chart this downwards movement for Monday’s session is labeled as the middle of a third wave. It follows a rare running flat for wave 2 orange, which is technically possible but we would not expect to see one of these unless we were in a primary or cycle wave trending downwards.
Wave 4 orange may not move into wave 1 orange price territory. This wave count is invalidated with movement above 1,332.03.
Wave 2 pink may not move beyond the start of wave 1 pink. This wave count is invalidated with movement below 1,294.70.
Daily Wave Count #2
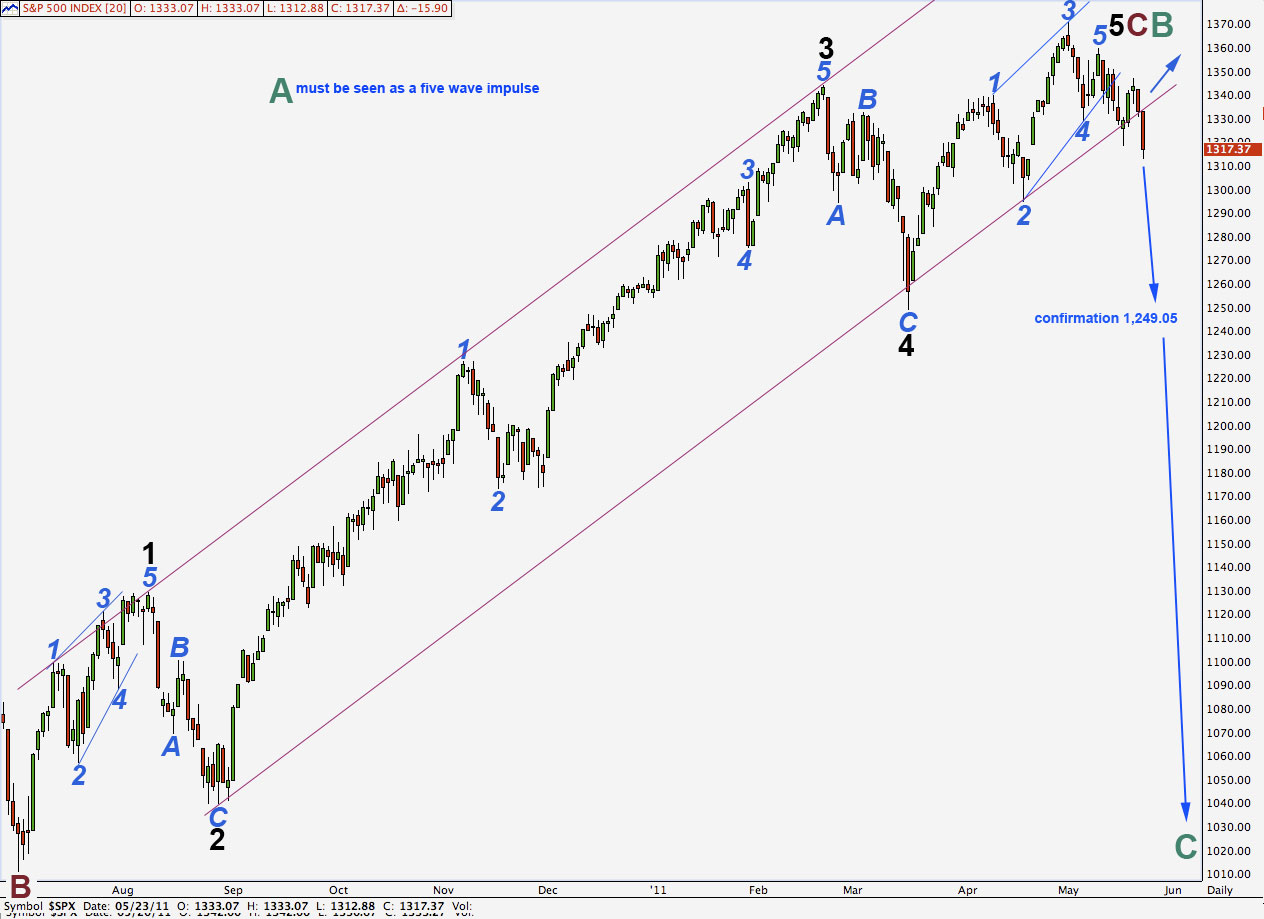
This wave count requires cycle wave A to be a five wave structure. This is possible but it is less preferable than seeing it as a three.
Cycle wave B may be recently over.
Black wave 5 is here labeled as an ending contracting diagonal.
Subwaves 1 and 3 blue within this diagonal must be seen as three wave zigzags. This is possible for wave 1 blue but is quite difficult for wave 3 blue. For this reason this wave count would have a low probability. If this structure really was an ending diagonal, and we have had a trend change at cycle or primary wave degree, then we really should expect all the subwaves of the ending diagonal to be clearly zigzags as is wave 5 blue.
The trend channel drawn here is Elliott’s first technique and it shows a full daily bar below it, but still touching the channel. With only one more daily bar below this channel we would have some further confidence in this wave count.
Price movement below 1,249.05 would initially confirm it but unfortunately, because of Daily Wave Count #7, it would not be final confirmation. Technically, only movement below 1,129.24 would confirm a trend change at primary or cycle degree, but this point is a very long way away.
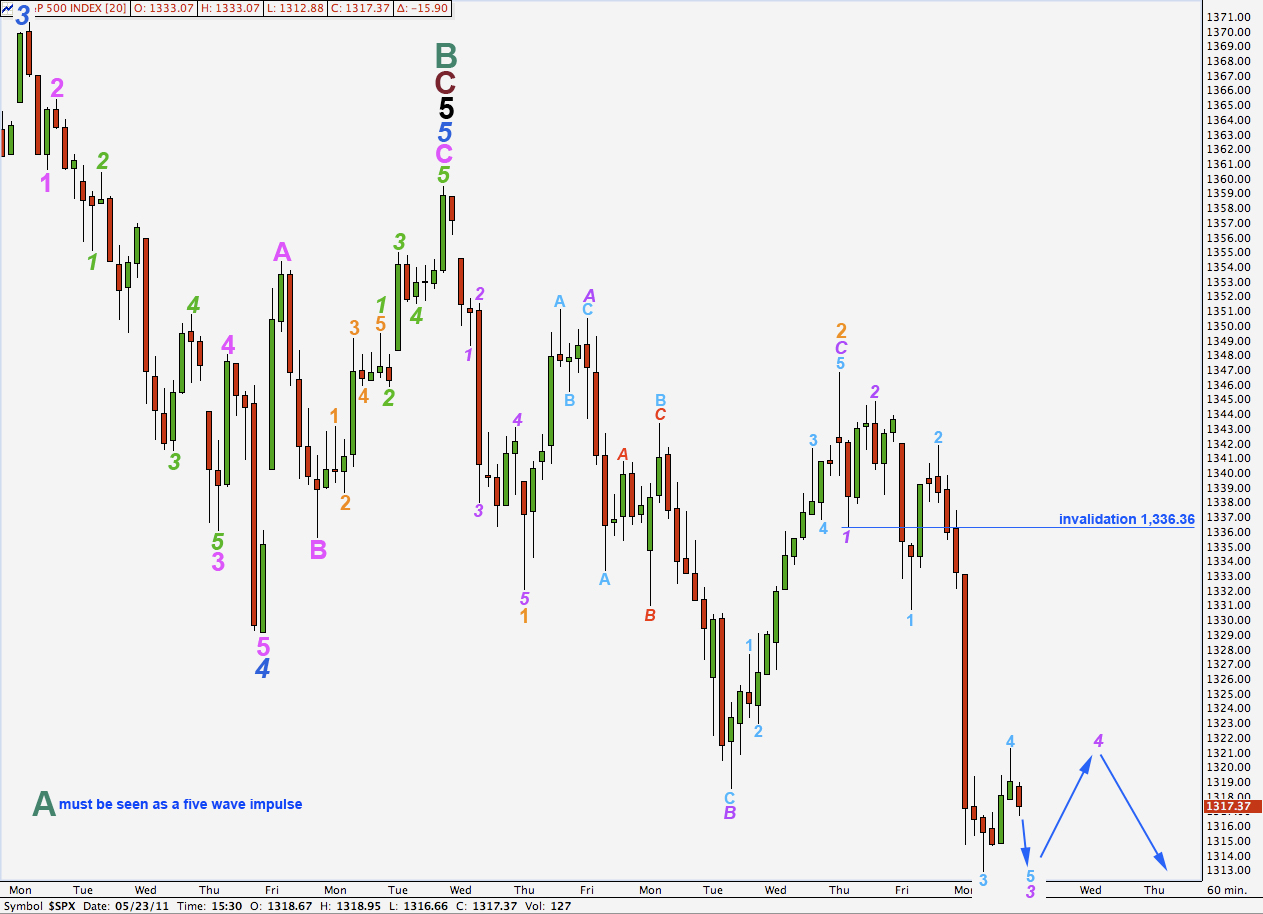
This hourly chart shows the end of a truncated fifth wave to end the diagonal for wave 5 black. Thereafter, downward movement is the very beginning of cycle wave C.
Wave behaviour fits this wave count. A running flat in this position, although a rare structure, does make sense.
Wave 4 purple may not move into wave 1 purple price territory. This wave count would be invalidated (the hourly chart only) with movement above 1,336.36.
Daily Wave Count #3.
This wave count takes us back to the idea that the S&P 500 is within a cycle degree C wave downwards of a larger super cycle expanded flat correction. This was our main count until the end of week analysis.
Again it is possible, just, to see an ending diagonal as having just completed primary wave 2.
Subdivisions do not fit well for this wave count. We must see 1 and 3 pink within 5 blue as zigzags. It is possible to see a zigzag for wave 1 but very difficult for wave 3.
There is a trend channel breach but we would want to see one more day, and a full candle not touching the channel, to use this to call a trend change for this wave count.
This wave count does not fit with any of the indices which have made new all time highs and so has a low probability.
Daily Wave Count #4.
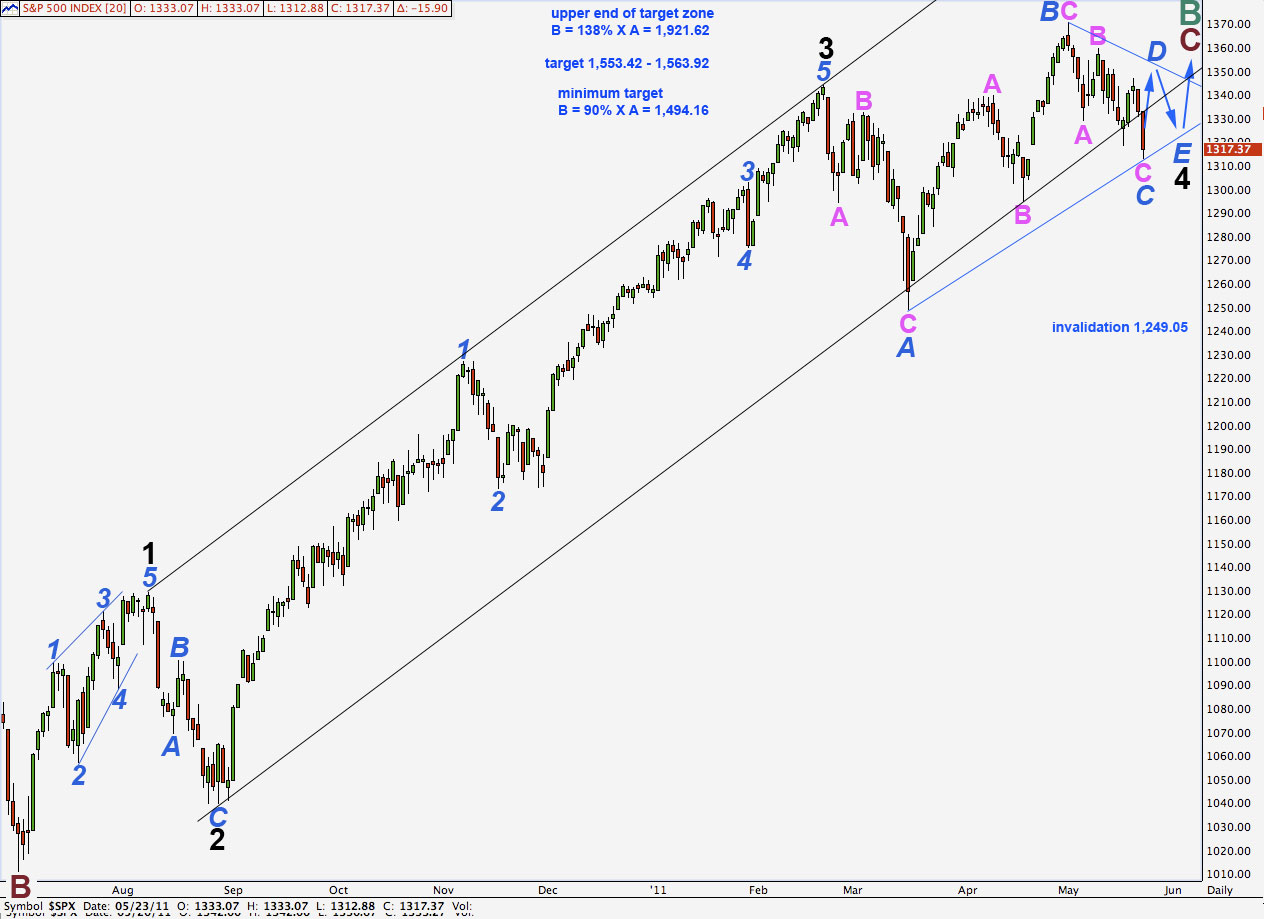
It is possible that we are seeing a fourth wave correction unfold as a triangle.
I have only presented this idea onto the wave count which sees the S&P 500 as within cycle wave B upwards of a flat correction at super cycle degree. We could also chart this idea onto the larger wave count which sees the S&P 500 as within primary wave 2, but then proportionally it looks strange.
Each subwave is a zigzag. Wave C blue probably has a little further down to go, but not much.
D blue should not move beyond the end of B blue above 1,370.59.
C blue should not move beyond the end of A blue below 1,249.05.
When the triangle is complete a final upwards wave is required at minor degree.
This structure may even be able to complete without a huge overshoot of the parallel channel drawn here using Elliott’s first technique. Unfortunately, fourth waves don’t always conform perfectly to parallel channels. That is why Elliott had the second technique of drawing a channel from 2 to 4 and placing a parallel copy on 1 to indicate where 5 may end.
This fourth wave looks out of proportion to its counterpart second wave at black degree. However, it is achieving the guideline of alternation nicely.
So far all subdivisions fit nicely for this wave count.
Daily Wave Count #5.
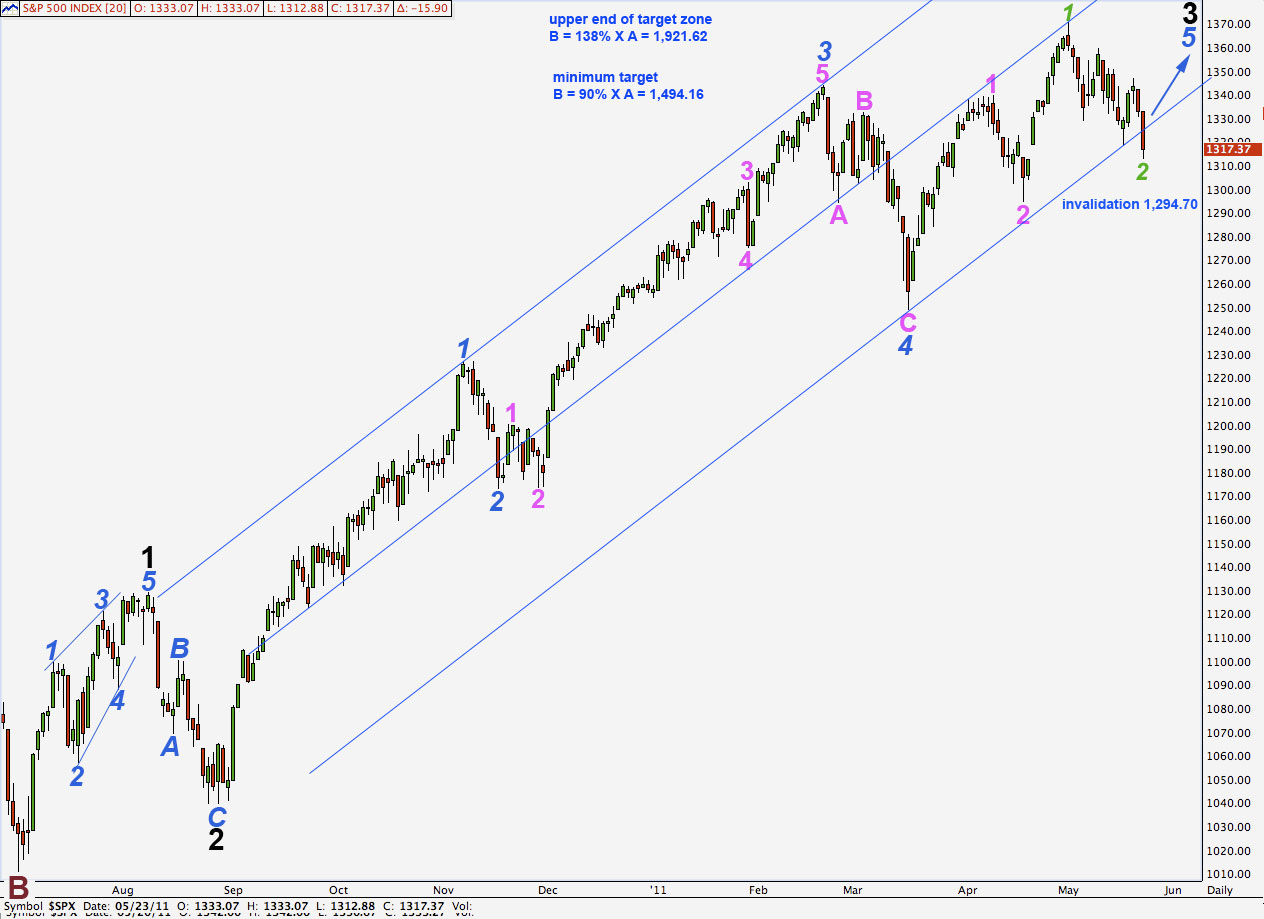
Again seeing upwards movement as within cycle wave B of a super cycle flat correction.
Wave 2 green could be simply moving lower. It needs one final very small move lower (or a truncated fifth wave to end C) before 3 green can begin.
Wave 2 green may not move beyond the start of wave 1 green. This wave count is invalidated with movement below 1,294.70.
The subdivisions fit. The trend channel does not, unless we make it double wide which is not strictly Elliott’s technique.
We don’t have the end to 3 black yet so cannot draw a channel for intermediate degree waves.
Wave 2 green should not be this large and showing up on the daily chart; it is out of proportion to all other waves of sub-minute degree. For this reason this wave count has a low probability.
Daily Wave Count #6.
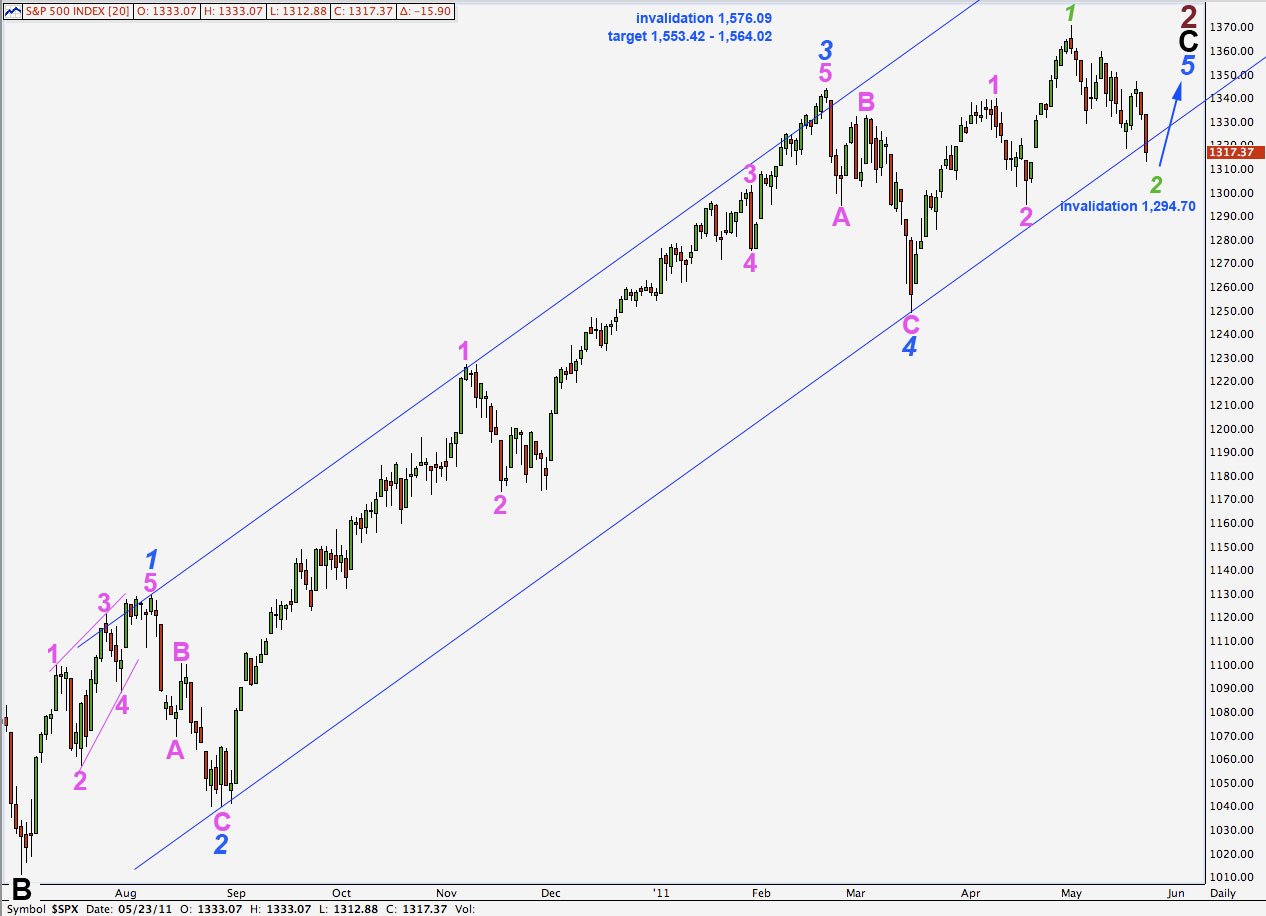
Again, back to the idea that we are in a super cycle expanded flat correction and looking for further upwards movement to end primary wave 2.
This wave count does not fit with any of the indices which have made new all time highs and so has a low probability.
Also, sub-minute (green) wave 2 is too large and out of proportion to all other sub-minute degree waves.
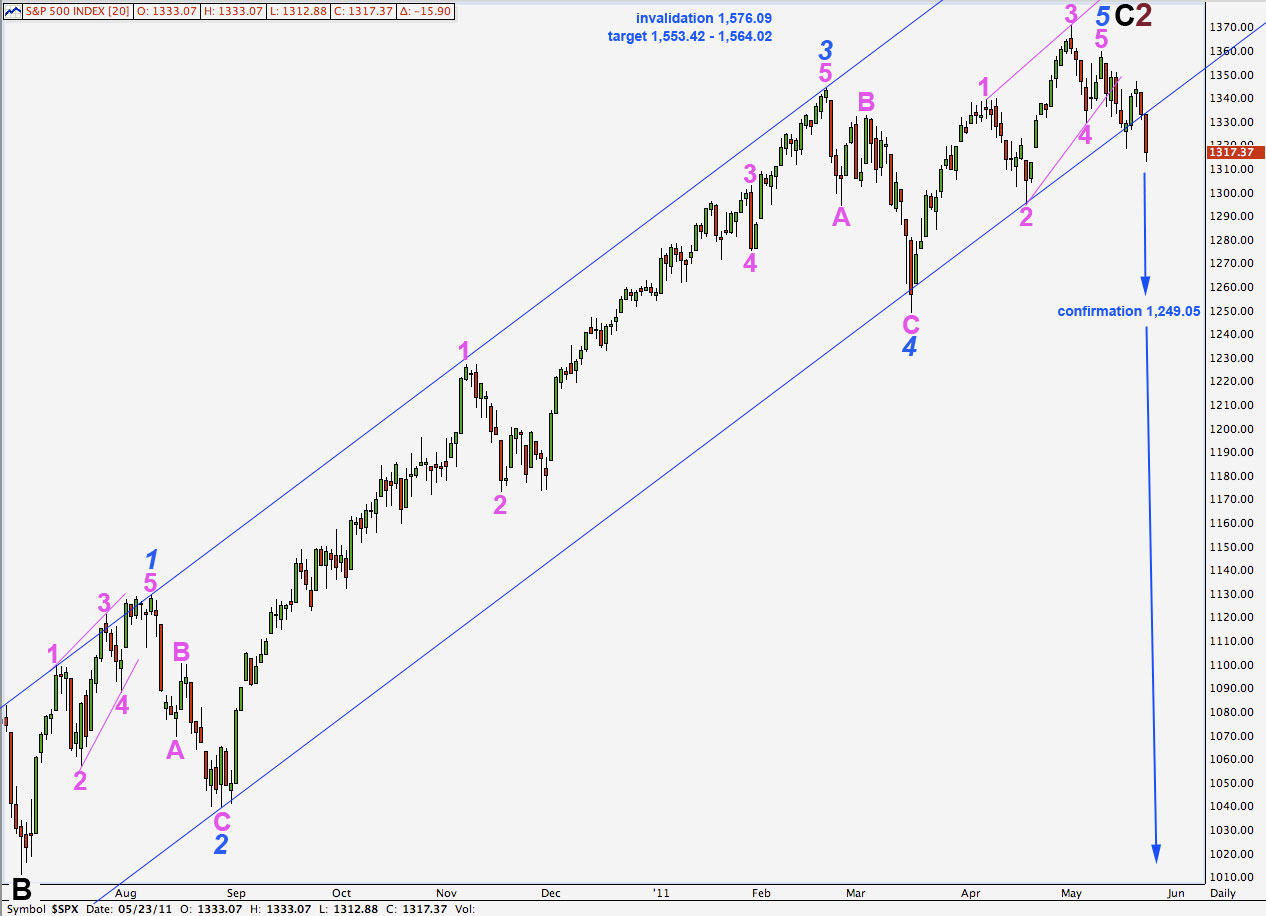
Daily Wave Count #7.
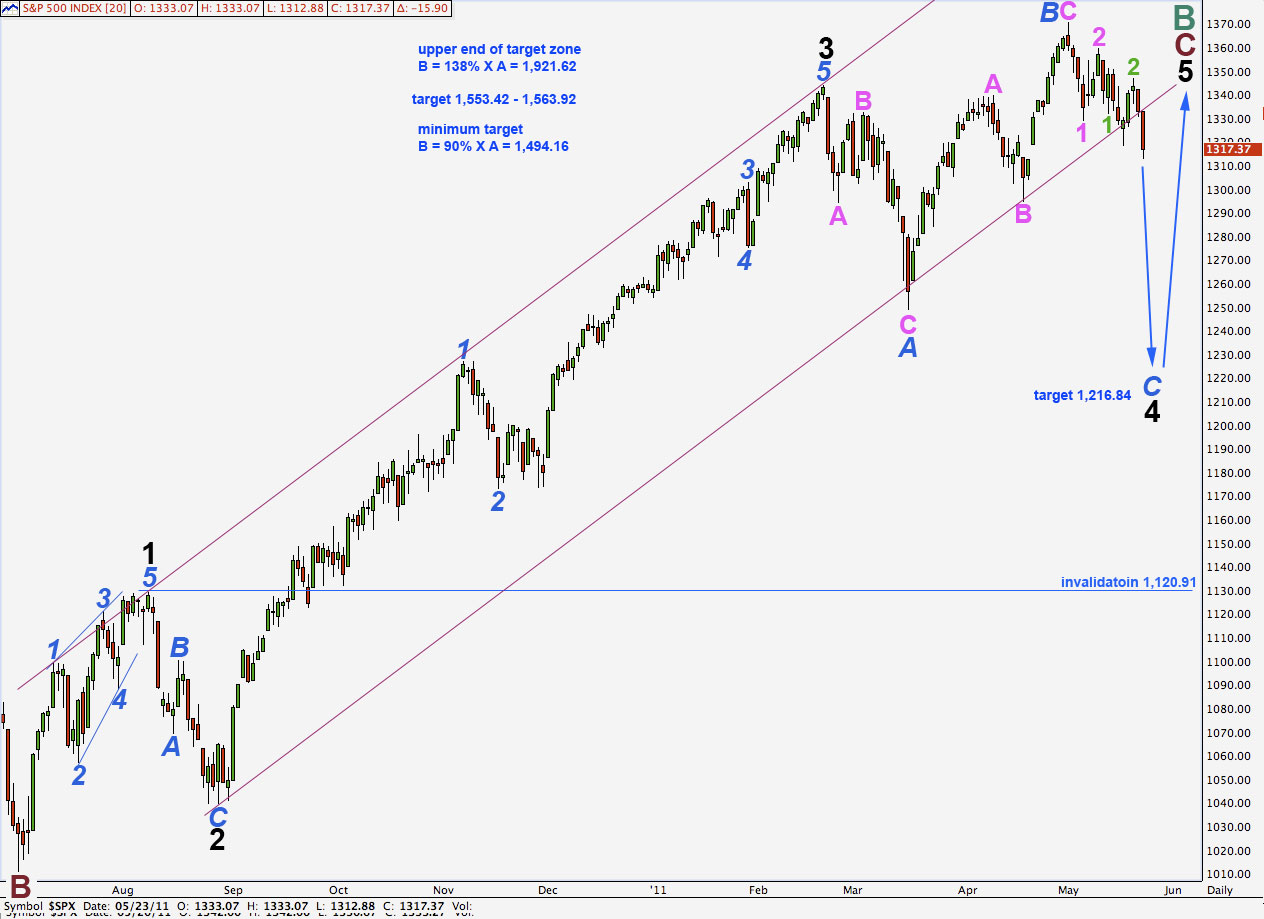
Finally, and most disturbingly, this whole movement since the high at 1,344.07 may be an expanded flat correction at intermediate degree.
The subdivisions fit.
Proportionally this wave count looks a bit strange. Wave 4 black is so much larger than its counterpart 2 black.
It does not fit a trend channel drawn about primary wave C impulse using Elliott’s first technique and indeed we have a channel breach (although the candle is touching the channel, one more candle which does not would be required).
Unfortunately, fourth waves don’t always conform perfectly to parallel channels. As mentioned earlier, that is why Elliott had the second technique of drawing a channel from 2 to 4 and placing a parallel copy on 1 to indicate where 5 may end.
This wave count expects that movement below 1,249.05 is highly likely as otherwise wave 4 black would be a very rare running flat correction. At 1,216.84 wave C blue would reach 1.618 the length of wave A blue.
Wave 4 black may not move into wave 1 black price territory. This wave count is only finally invalidated with movement below 1,120.91.