
Elliott Wave chart analysis for the Silver for 19th May, 2011. Please click on the charts below to enlarge.
I have a few members who are colour blind and in response to their requests to make the labels on the charts more readable I have altered the labels’ font size and made each degree of labeling alternate from oblique to regular font styles. To view the new wave notation table (version 2) go here. Please let me know if the new wave notation makes it easier for you to read the labels on the charts, whether you’re colour blind or not.
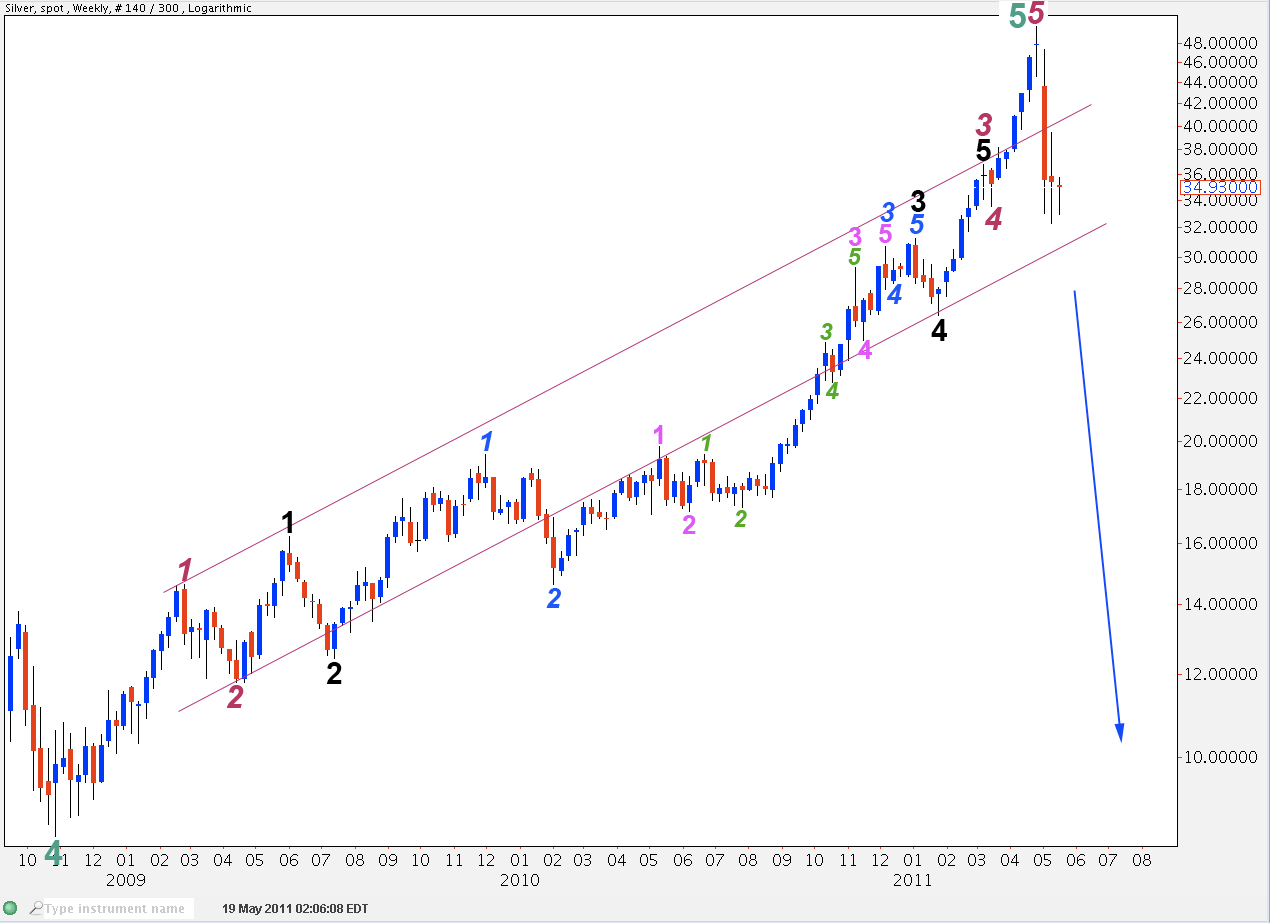
Just to put the 4 hourly chart below in perspective, here is the weekly chart on a logarithmic scale.
There was an all time high at 49.786 on 25th April, 2011. This is labeled the end of a cycle degree wave 5 (teal green).
If this is correct then silver may have had a recent trend change at super cycle degree. However, we would want to see a trend channel confirmation of this very big trend change before calling a generational high in place.
The logarithmic scale allows a channel about this cycle degree fifth wave to be drawn, which better contains this movement. However, the movement is still curved and has a large amount of the middle of the third wave below the channel.
This channel may be used to indicate a trend change at least at cycle degree, but not at super cycle degree. When we see a full candlestick below the channel we may have some confidence that we may have seen a trend change at cycle degree and price should continue downwards for at least a year or more.
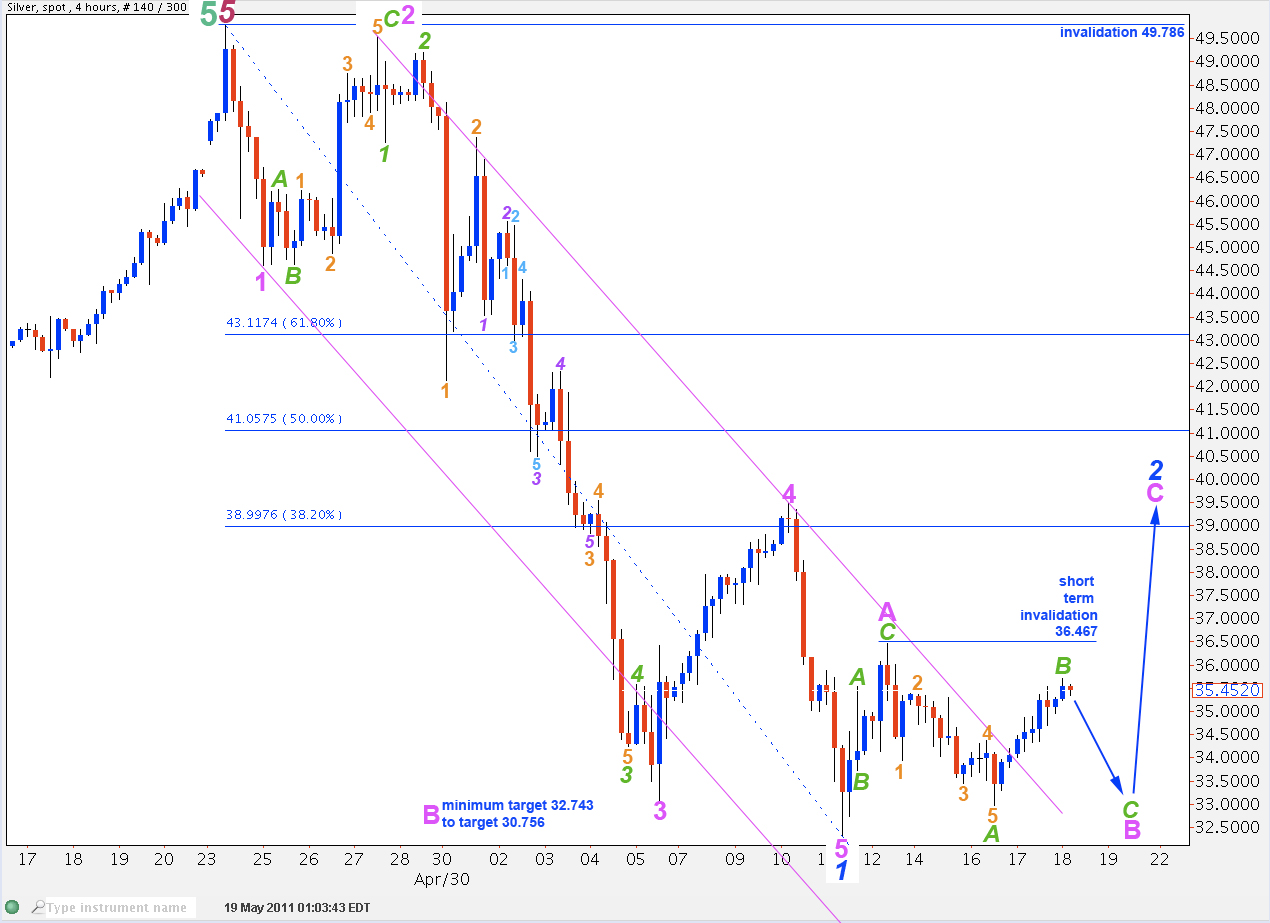
This four hourly chart is updated from last analysis.
Silver has almost, but not quite, reached down to the minimum level required for wave B pink.
Because wave A pink was a three wave structure we may expect wave 2 blue to be a flat correction. The possibility that it may be a triangle is very slight.
Wave B pink may be still in progress as a zigzag. Any further upwards movement of wave B green within it may not move beyond the start of wave A. In the short term this structure as labeled for wave 2 blue is invalidated with movement above 36.467.
Wave C green to end wave B pink must reach at least down to 32.743. At 32.238 wave C green will reach equality with wave A green. It may end here.
At 30.756 wave C pink will be 138% the length of wave A pink. This is the lower end of our target zone and it is the longest most common length of wave B in relation to wave A, within a flat correction.
When wave B pink is complete we should see a trend change for silver and a five wave structure upwards. Wave 2 blue may not move beyond the start of wave 1 blue. This wave count is invalidated with movement above 49.786.