
Elliott Wave chart analysis for WTI Crude for 17th May, 2011. Please click on the charts below to enlarge.
As expected from last analysis oil has moved a little lower.
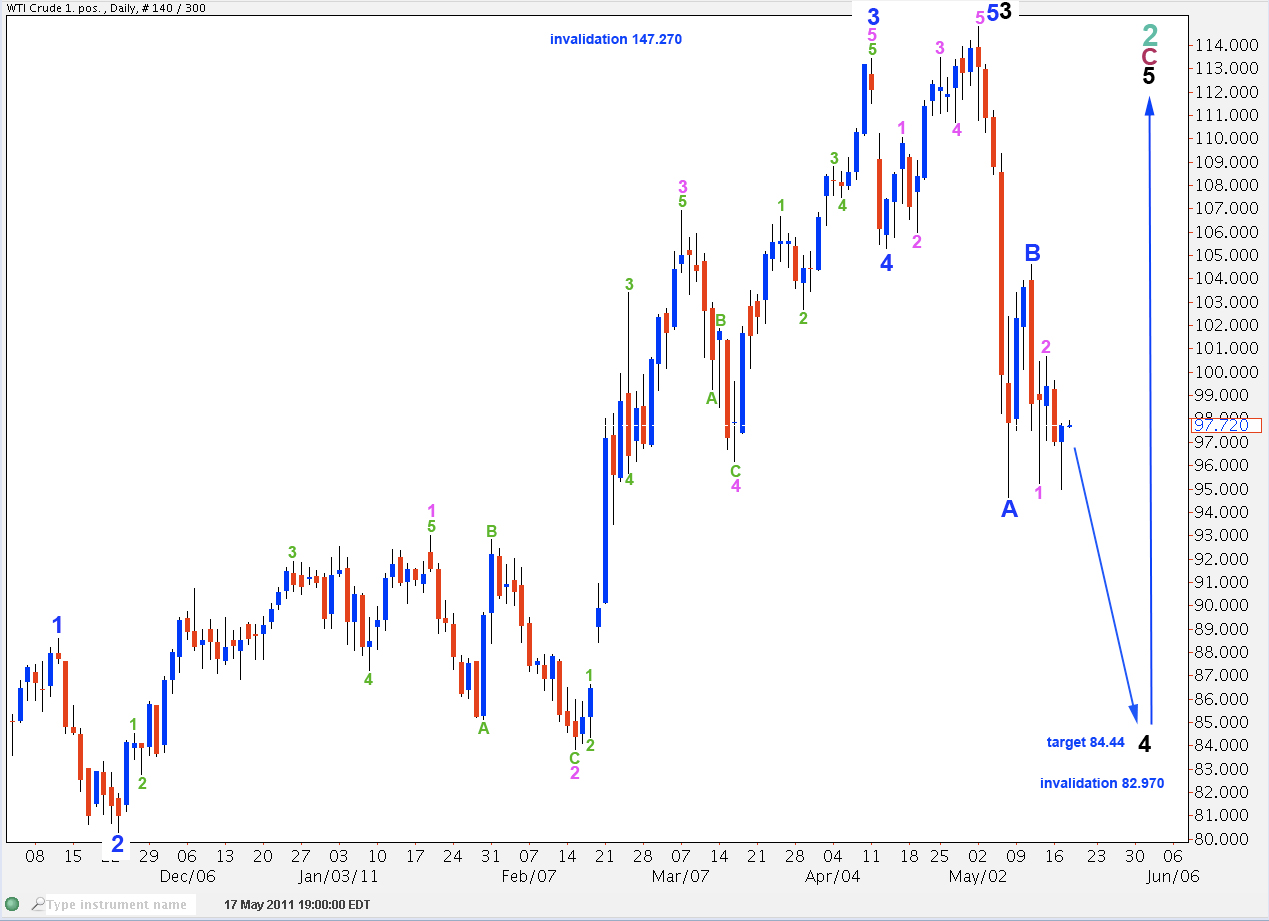
It is extremely likely that wave C blue will at least reach below the end of wave A blue at 94.65. At 84.44 wave C blue will reach equality with wave A blue. Downwards movement may end there and a final fifth wave upwards may begin.
Wave 4 blue may not move into wave 1 blue price territory. This wave count is invalidated with movement below 82.970.
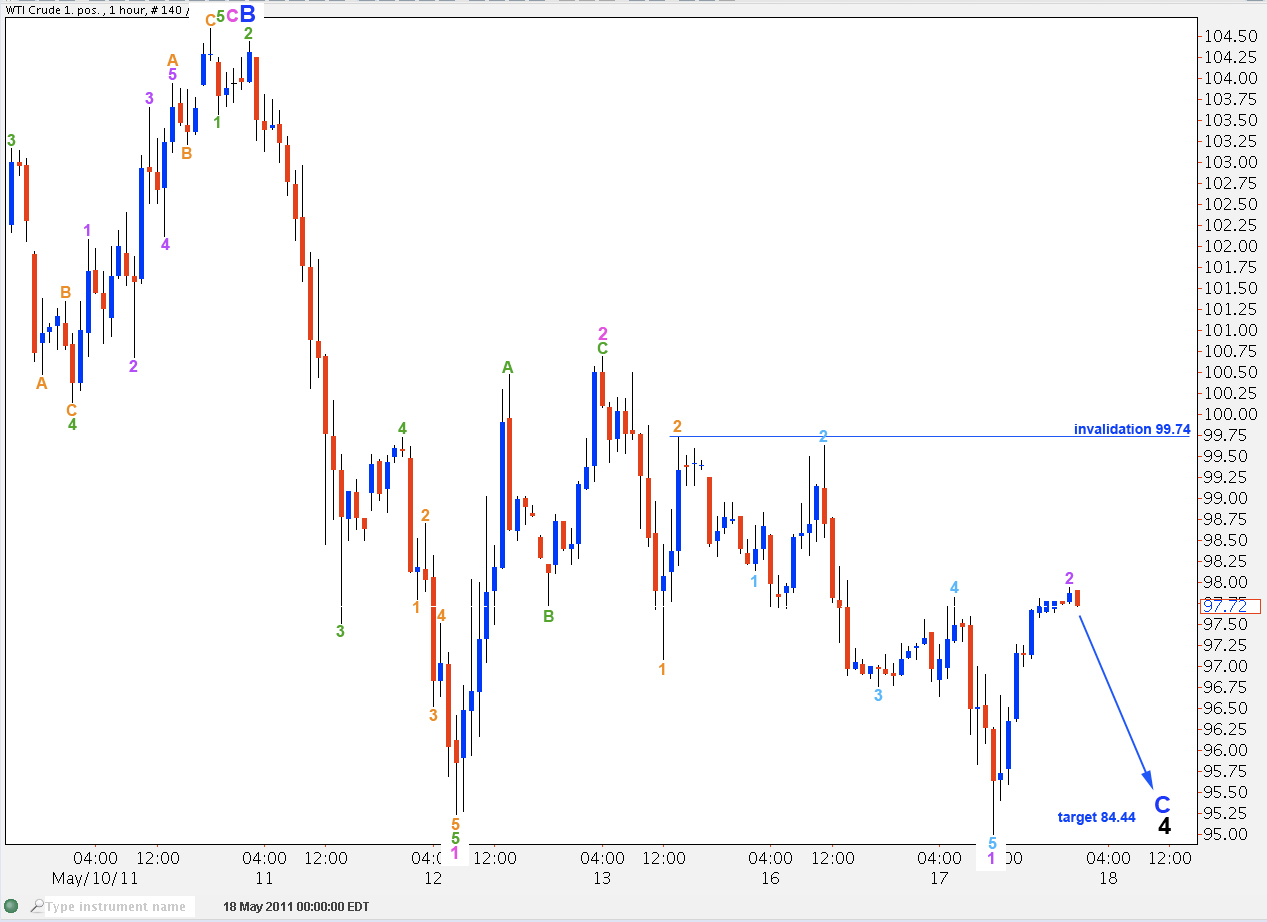
Wave 3 pink within wave C blue has begun more slowly than we would expect it to. Initially this structure looks like a triangle in the early stages, but the slightly lower low of wave 1 purple below the end of wave 1 pink would invalidate a contracting triangle. We would not expect to see a triangle in a second wave position anyway.
Ratios within wave 1 purple within wave 3 orange are: wave 3 aqua is just 0.3 longer than 1.618 the length of wave 1 aqua and wave 5 aqua is just 0.05 short of equality with wave 3 aqua. These excellent ratios indicate this labeling is likely to be correct. There is no alternation in structure between waves 2 and 4 aqua, both are expanded flat corrections, but they do alternate in depth of correction with wave 2 aqua very deep and wave 4 aqua shallow.
Wave 2 purple may not move beyond the start of wave 1 purple. This wave count is invalidated with movement above 99.74.