
Elliott Wave chart analysis for the S&P 500 for 17th May, 2011. Please click on the charts below to enlarge.
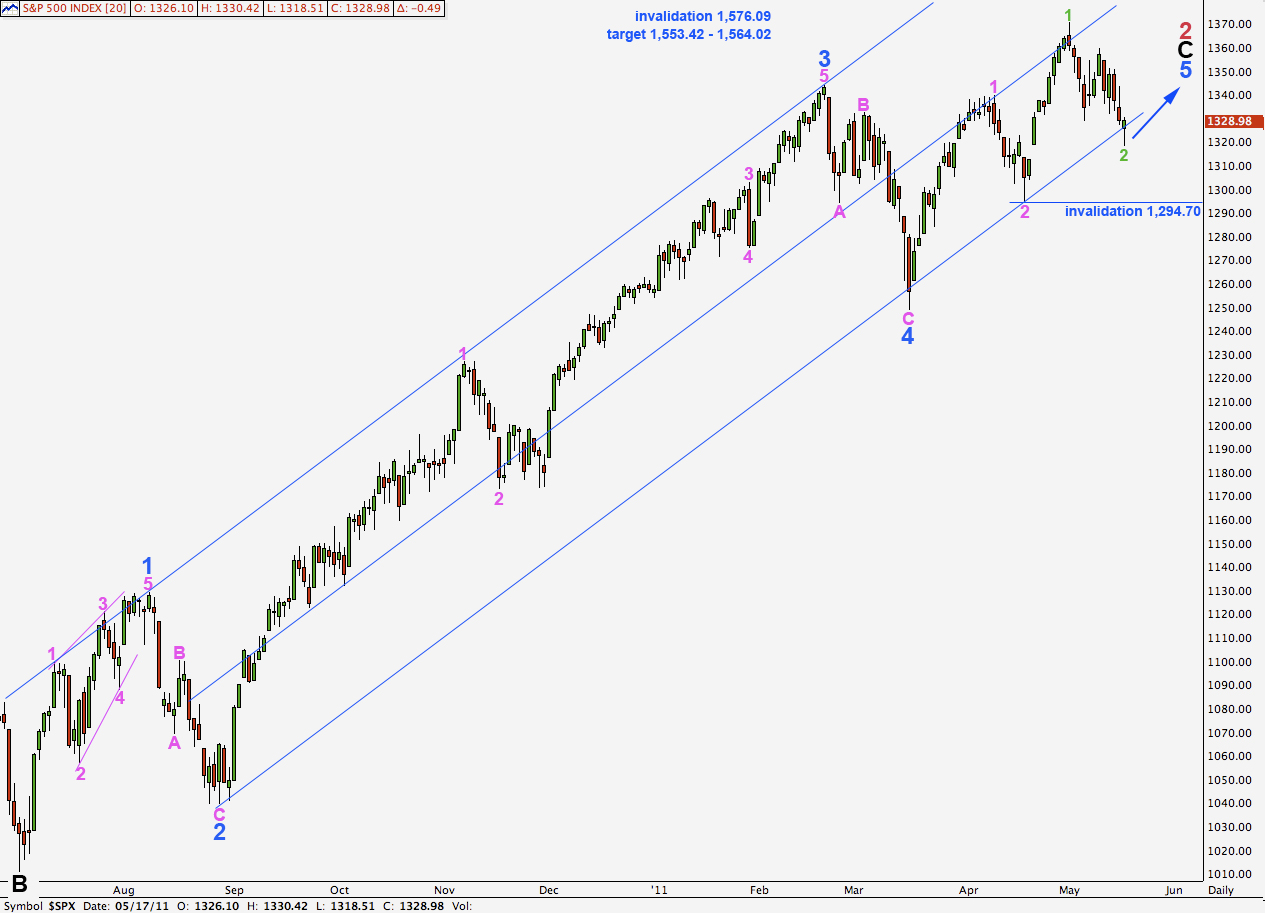
Downwards movement for Monday’s session invalidated the main hourly wave count and confirmed the alternate. This zigzag for wave 2 green has extended lower and now has a small overshoot of the parallel channel containing wave C black upwards. An overshoot is acceptable but a channel breach is not.
Technically wave 2 green may move down to the start of wave 1 green at 1,294.70 but not below. Movement below 1,294.70 would provide strong evidence of a trend change at primary degree.
The structure for wave 5 blue is incomplete. Wave 5 must subdivide into a five wave structure, either an ending diagonal or an impulse. At this stage it looks like only four and requires at least one more wave upwards to complete a five wave structure. It is barely possible that the final fifth wave was truncated but I do have an alternate today for this idea.
Targets remain the same. Wave 5 blue has an extended third wave at pink degree within it. At 1,553.42 wave 5 blue will reach equality with wave 3 blue. At 1,564.02 wave C black will reach equality with wave A black. This is our long held target zone for upwards movement to end.
Main Hourly Wave Count.
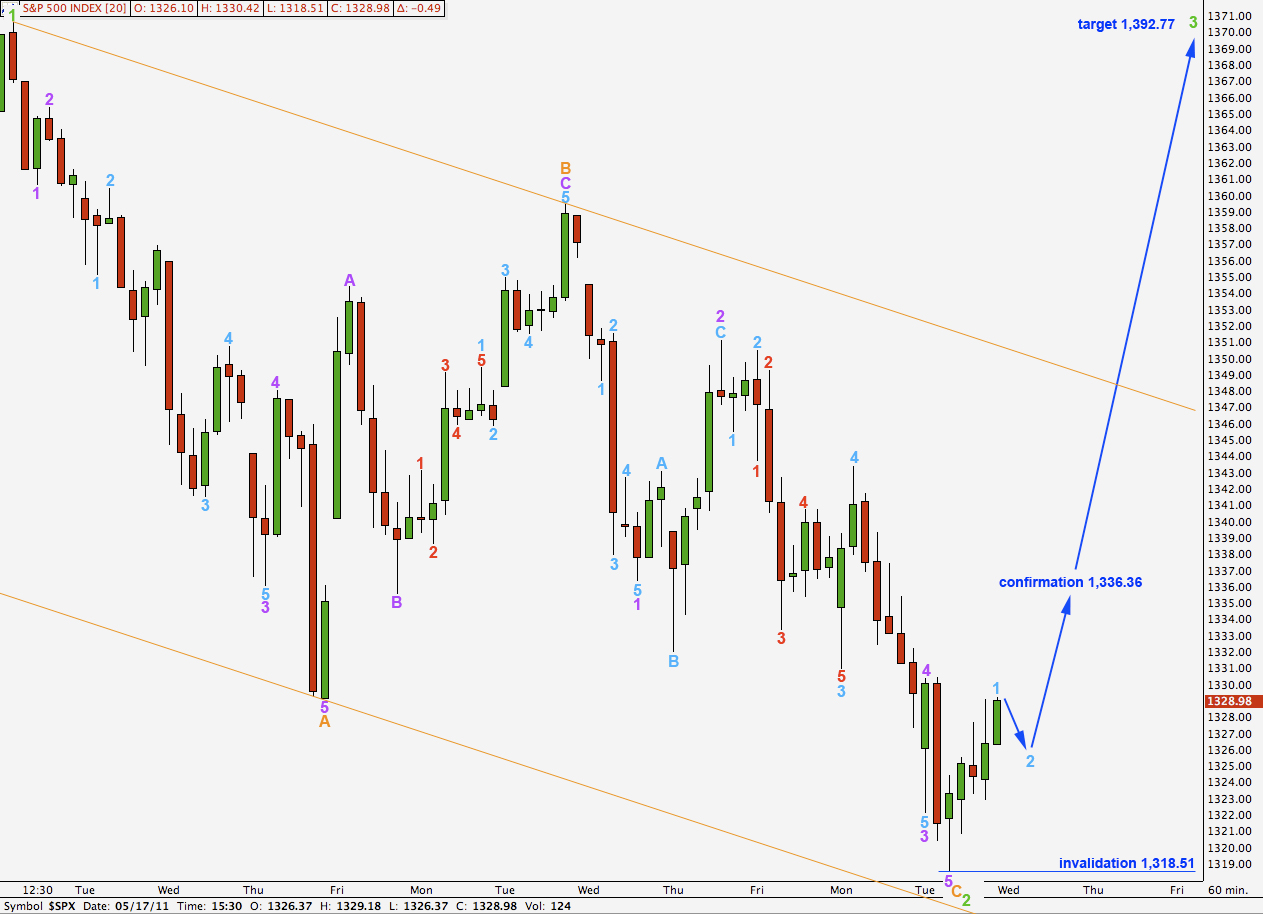
Further downwards movement was expected yesterday to be highly unlikely; the alternate wave count had a very low probability. The problem with low probability occurrences is that they do occur. We always expect the most common outcome but that does not mean we will always get it.
Further downwards movement has lengthened wave C orange. It is now just a bare 0.48 points short of equality with wave A orange.
Ratios within wave C orange are: wave 3 purple has no ratio to wave 1 purple and wave 5 purple is just 0.87 short of 0.382 the length of wave 3 purple.
Ratios within wave 3 purple within wave C orange are: wave 3 aqua is 1.7 points short of equality with wave 5 aqua and wave 5 aqua is 2.32 points short of 4.236 the length of wave 1 aqua.
Ratios within wave 3 aqua within wave 3 purple within wave C orange are: wave 3 red is 1.85 points short of 2.618 the length of wave 1 red and wave 5 red is just 0.09 points short of 0.618 the length of wave 3 red.
Movement above 1,336.36 would provide some confirmation of this wave count as that is where the alternate is invalidated. Further upwards movement above the orange parallel channel would provide trend channel confirmation of a trend change.
If this wave count is confirmed we should expect upwards movement to continue towards 1,392.77 where wave 3 green will reach 1.618 the length of wave 1 green.
Alternate Hourly Wave Count.
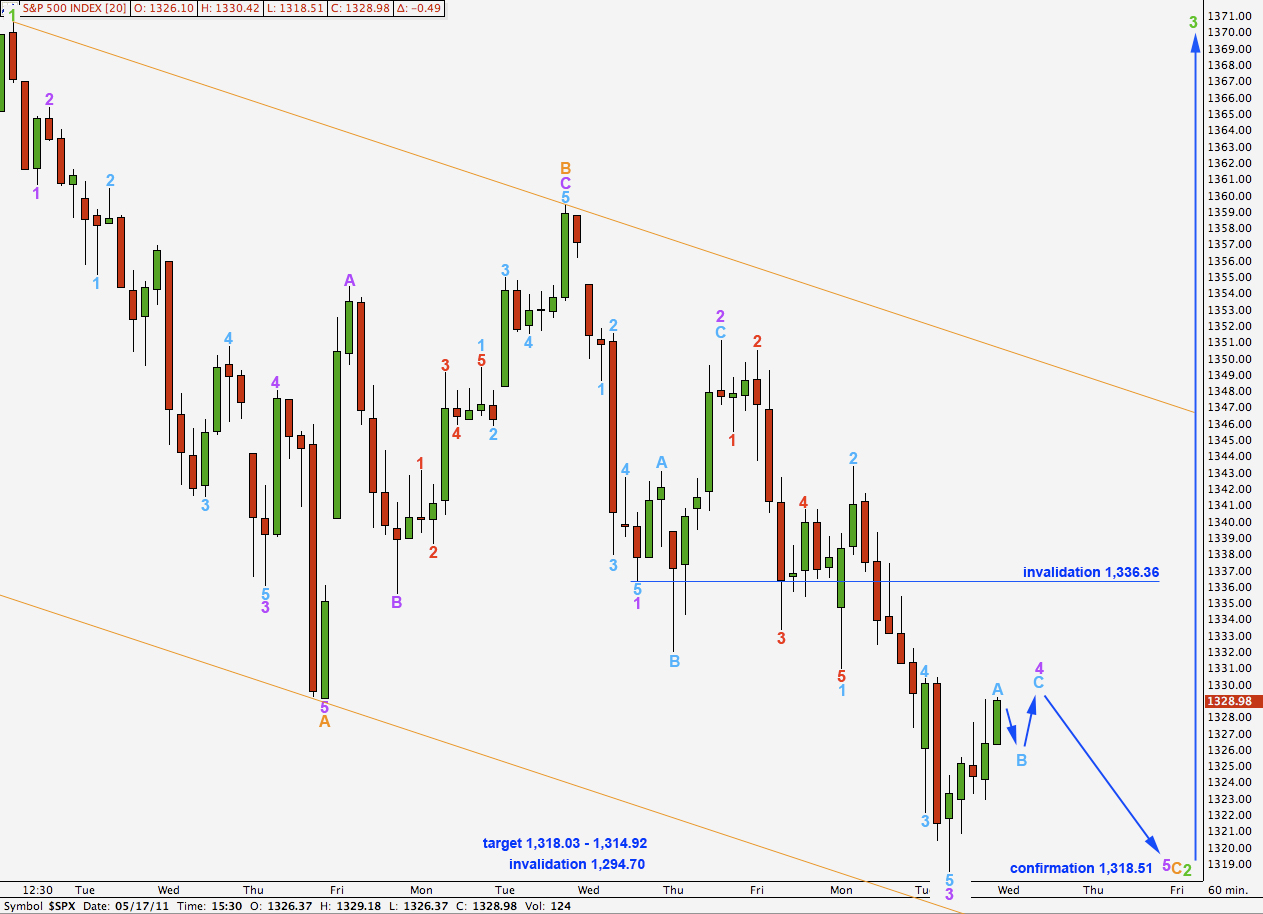
It remains possible that wave C orange is incomplete. While price remains below 1,336.36 this wave count will remain valid.
Wave C orange will reach equality with wave A orange at 1,318.03. This target allows for a very slightly lower low before this trend is over.
Within wave C orange wave 3 purple has no fibonacci ratio to wave 1 purple and at 1,314.92 wave 5 purple would reach 0.618 the length of wave 1 purple.
This target zone would allow for another daily candlestick to overshoot the trend channel on the daily chart before price turns back upwards into the channel for the next wave up. This would be acceptable, as long as we do not see a full candlestick outside the channel.
Ratios within wave 1 purple of wave C orange are: wave 3 aqua has no fibonacci ratio to wave 1 aqua and wave 5 aqua is just 0.36 short of 0.618 the length of wave 1 aqua.
Within wave 2 purple expanded flat correction wave B aqua is a 165% correction of wave A aqua and wave C aqua is 1.51 points longer than 2.618 the length of wave A aqua.
Ratios within wave 3 purple are: wave 3 aqua is 1.12 points longer than equality with wave 1 aqua and wave 5 aqua is 0.49 short of 0.618 the length of wave 1 aqua.
Wave 4 purple is an incomplete zigzag and requires a little further upwards movement. When that is done this wave count expects a final downwards fifth wave to end this structure.
Wave 4 purple may not move into wave 1 purple price territory. This wave count is invalidated with movement above 1,336.36.
Alternate Daily Wave Count.

With the small overshoot of the parallel channel on the daily chart this possibility is one we may want to consider.
It is barely possible that wave 5 blue was over as an ending contracting diagonal with a truncated fifth wave.
It seems very difficult to see waves 1 and 3 pink as zigzags. If they were we would expect them to have a strong three wave look, like the zigzag labeled 5 pink. They do not and are very easily counted as impulses.
If price moves below 1,294.70 our main wave count will be invalidated and we would have a strong trend channel breach on the daily chart. At that stage we may be fairly confident that primary wave 3 may be underway.
Movement above 1,359.44, the end of wave 5 pink, would invalidate this wave count. No second wave correction may move beyond the start of the first wave.