Elliott Wave chart analysis for the Silver for 17th May, 2011. Please click on the charts below to enlarge.
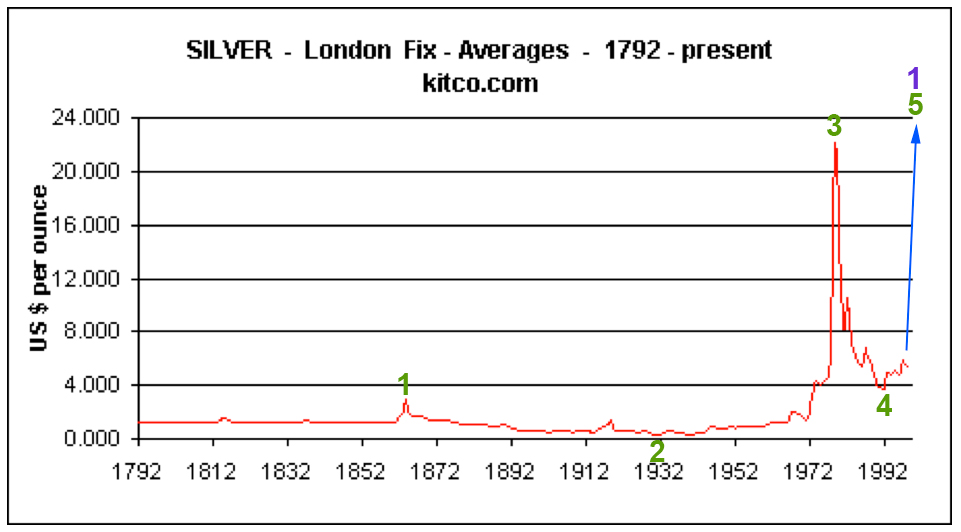
This historic chart from Kitco shows price all the way back to 1792 so we can look at super cycle waves. If my analysis of this is correct then we may have just seen a trend change at grand super cycle degree? That seems a little difficult to believe and I would want confirmation of that trend change before calling an end to such a big wave.
This chart only takes price up to 1993.
We must make an assumption that prior to 1792 prices were lower than 0.254 which was the low in 1932, as wave 2 may not move beyond the start of wave 1. If this assumption is incorrect then we may not have seen an end to a grand super cycle degree wave.
Initially looking at this chart we would expect a final upwards fifth wave to end a five wave structure at grand super cycle degree. And this is what did indeed happened.
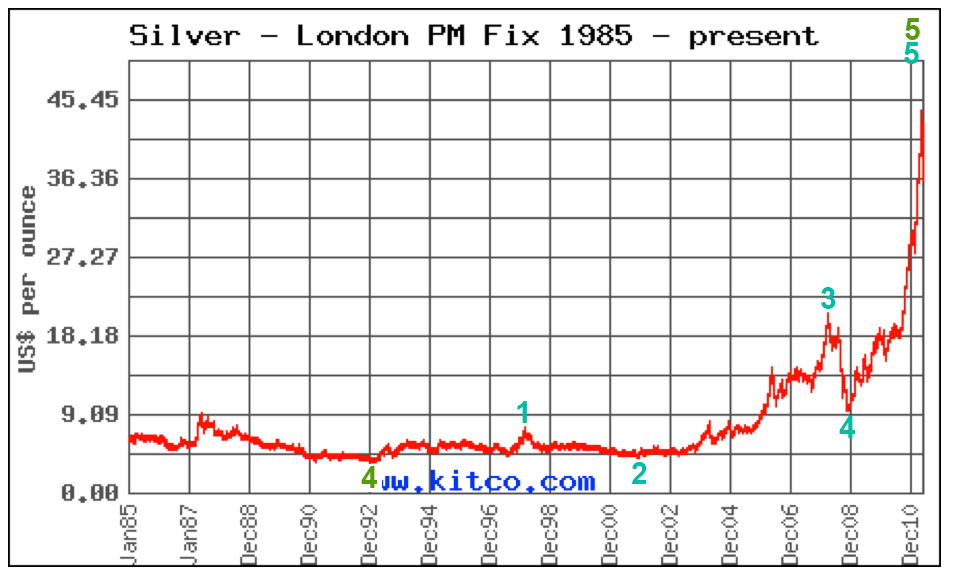
This chart from 1985 to the present shows that last super cycle wave 5 upwards.
Ratios within super cycle wave 5 are: cycle wave 3 is just 0.36 short of 6.854 the length of cycle wave 1 and cycle wave 5 is 4.02 short of 2.618 the length of wave 3.
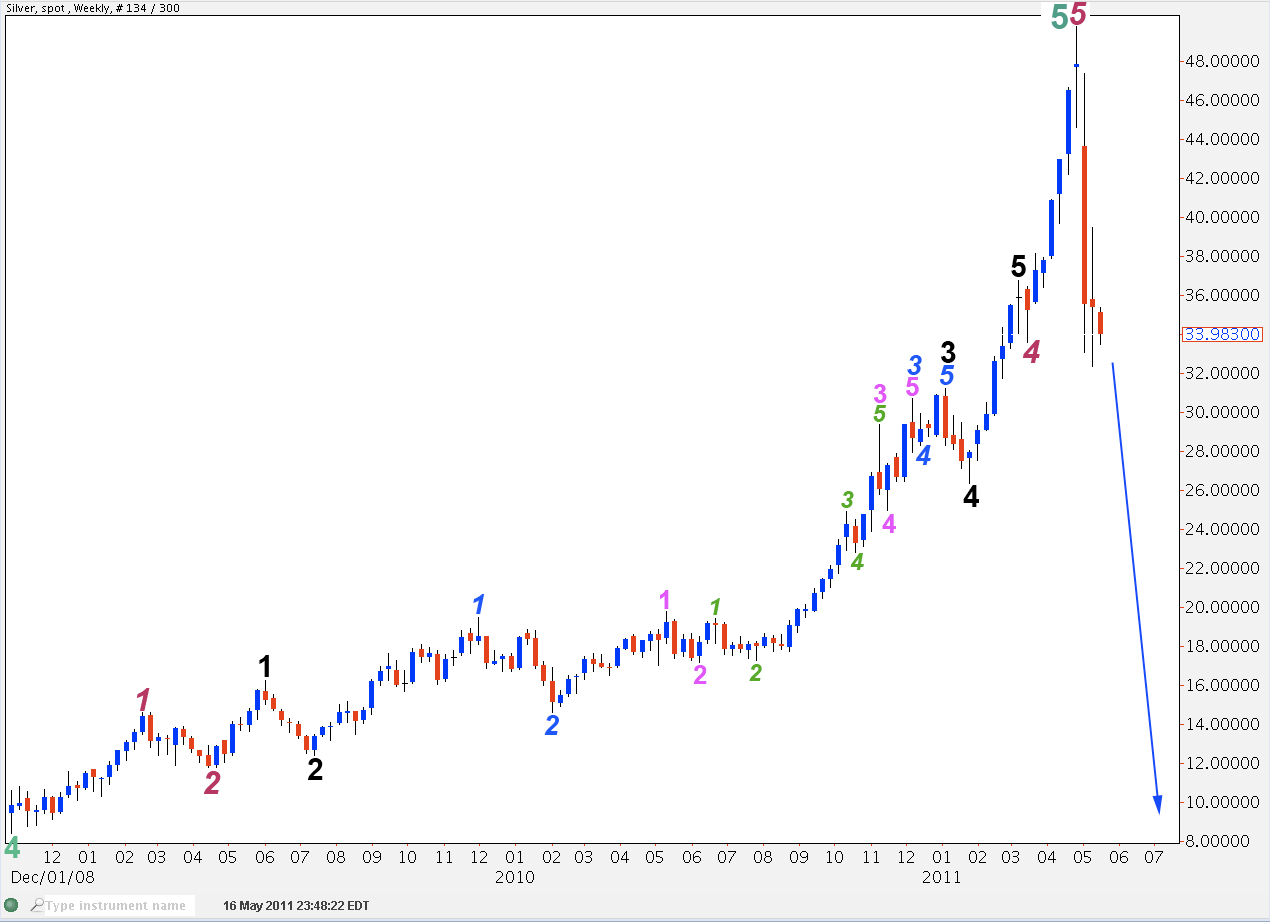
This weekly chart shows all of cycle wave 5 to end super cycle wave 5 to possibly end grand super cycle wave 1.
Ratios within cycle wave 5 are: primary wave 3 is 1.38 short of 4.236 the length of primary wave 1 and primary wave 5 is just 0.02 short of 2.618 the length of wave 1.
Ratios within primary wave 3 are: wave 3 black is 0.01 short of 4.236 the length of wave 1 black and wave 5 black is 1.24 short of 2.618 the length of wave 1 black.
Ratios within black wave 3 are: wave 3 blue is 2.34 short of 2.618 the length of wave 1 blue and wave 5 blue is 0.22 longer than 0.382 the length of wave 1 blue.
Ratios within wave 3 blue are: wave 3 pink is 1.36 short of 2.618 the length of wave 1 pink and wave 5 is just 0.54 longer than equality with wave 1 pink.
Within wave 3 pink there are no fibonacci ratios at green degree.
Some of these ratios are remarkably good at intermediate, primary, and cycle degree. It is surprising that the lower wave degrees ratios are not as good.
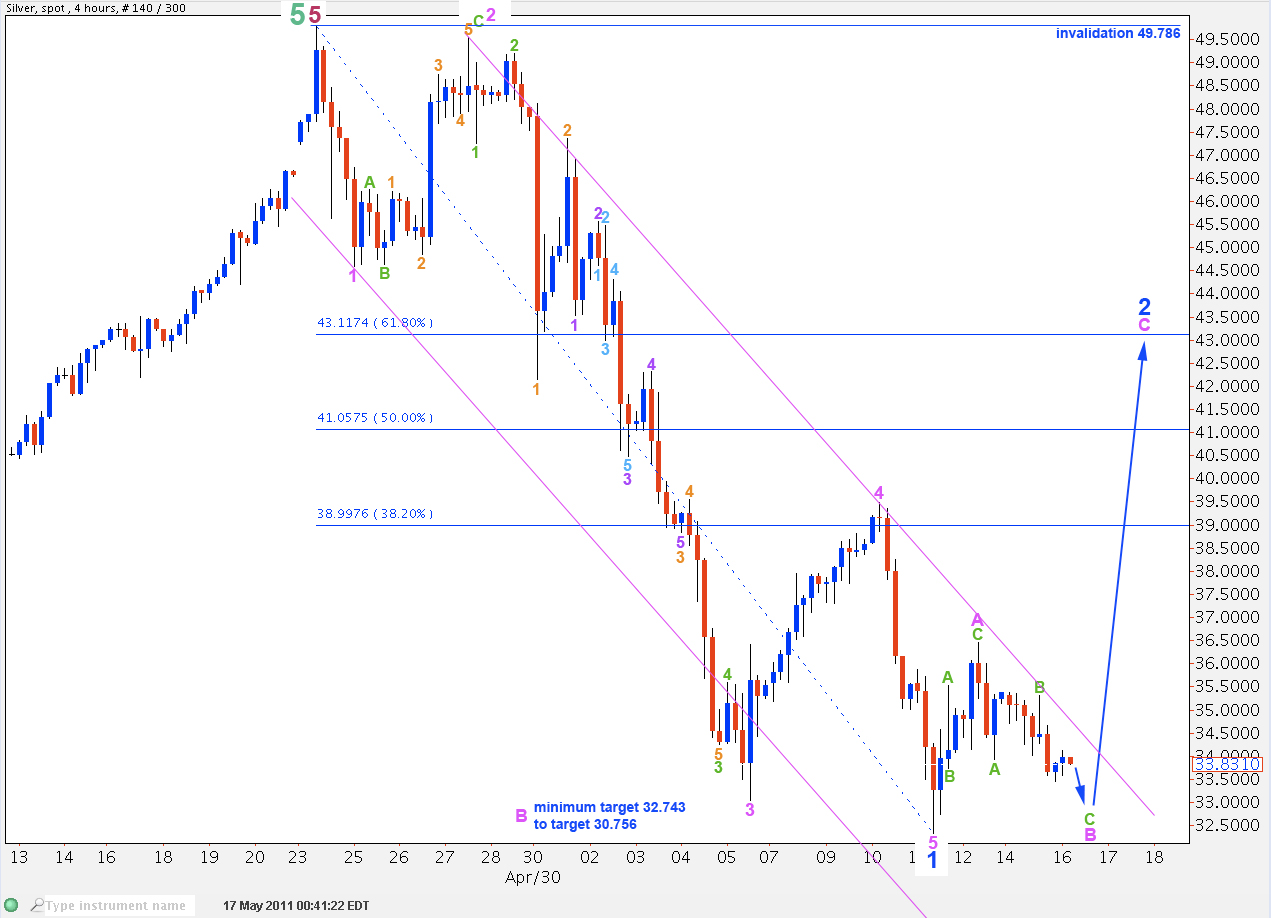
This 4 hourly chart shows downwards movement from the all time high at 49.786 on 24th April, 2011.
It looks like a clear five wave movement.
This parallel channel is drawn from the highs of 2 to 4 pink, and a parallel copy placed on the low of 1 pink. Wave 3 pink has an overshoot of the trend channel. Wave 5 pink ends midway in the channel which is a common place for fifth waves to end.
We would want to see this channel breached to the upside to confirm an end to wave 1 blue. At this stage we do not have confirmation.
This wave count is confirmed by MACD: the strongest reading is for the third wave while wave 4 comes close to the zero line and wave 5 moves lower.
Within wave 1 blue there are no ratios at pink degree.
Ratios within wave 3 pink are: wave 3 green is 0.71 short of 4.236 the length of wave 1 pink and wave 5 pink is 0.254 longer than equality with wave 1 pink.
Ratios within wave 3 green are: wave 3 orange has no fibonacci ratio to wave 1 orange and wave 5 orange is just 0.02 short of 0.618 the length of wave 3 orange.
Ratios within wave 3 orange are: wave 3 purple has no fibonacci ratio to wave 1 purple and wave 5 purple is just 0.12 short of 0.618 the length of wave 1 purple.
Ratios within wave 3 purple are: wave 3 aqua is just 0.02 short of 2.618 the length of wave 1 aqua and wave 5 aqua is 0.23 short of 1.618 the length of wave 1 aqua.
Within wave 2 blue (which is unconfirmed) wave A pink looks most like a three wave structure. Wave 2 blue may be unfolding as a flat correction. Wave B pink should be at least 90% the length of wave A pink and it may be most commonly up to 138% the length of wave A pink. This gives a target of 32.743 (minimum) to 30.756.
When price is within this zone and has a three wave structure downwards then we may expect a trend change and a C wave upward to begin.


