
Elliott Wave chart analysis for Gold for 17th May, 2011. Please click on the charts below to enlarge.
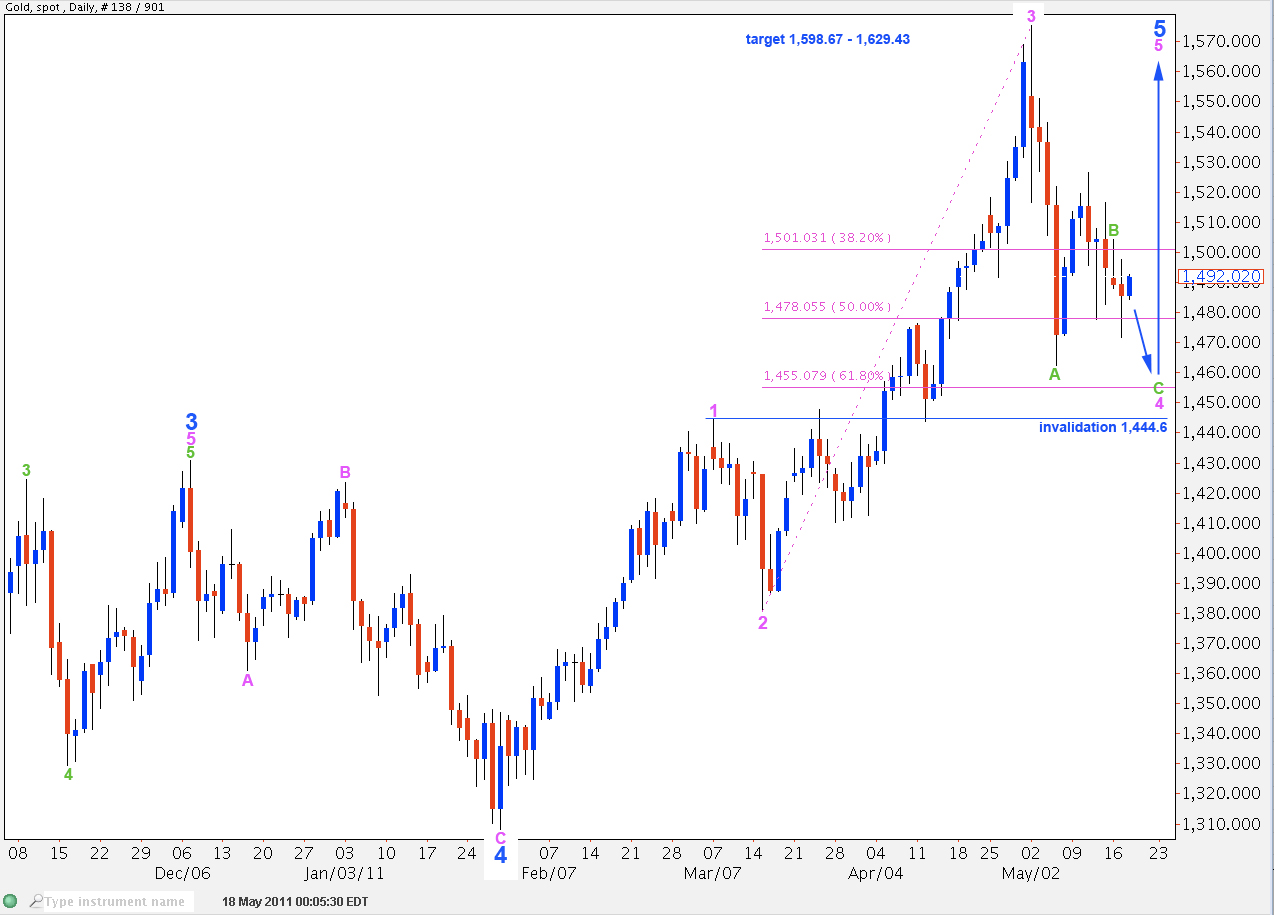
This daily chart shows the last wave upwards to end an intermediate wave 5 to end a primary wave 3. Within wave 5 blue we may be within a fourth wave correction at pink degree.
Wave 4 pink looks like it is subdividing as a zigzag and wave C downwards is incomplete.
It may correct to about the 0.618 fibonacci ratio. Wave 2 pink was a shallow correction and so this would provide nice alternation between the two in terms of depth, but not in terms of structure.
Wave 4 pink may not move into wave 1 pink price territory. This wave count is invalidated with movement below 1,444.6.
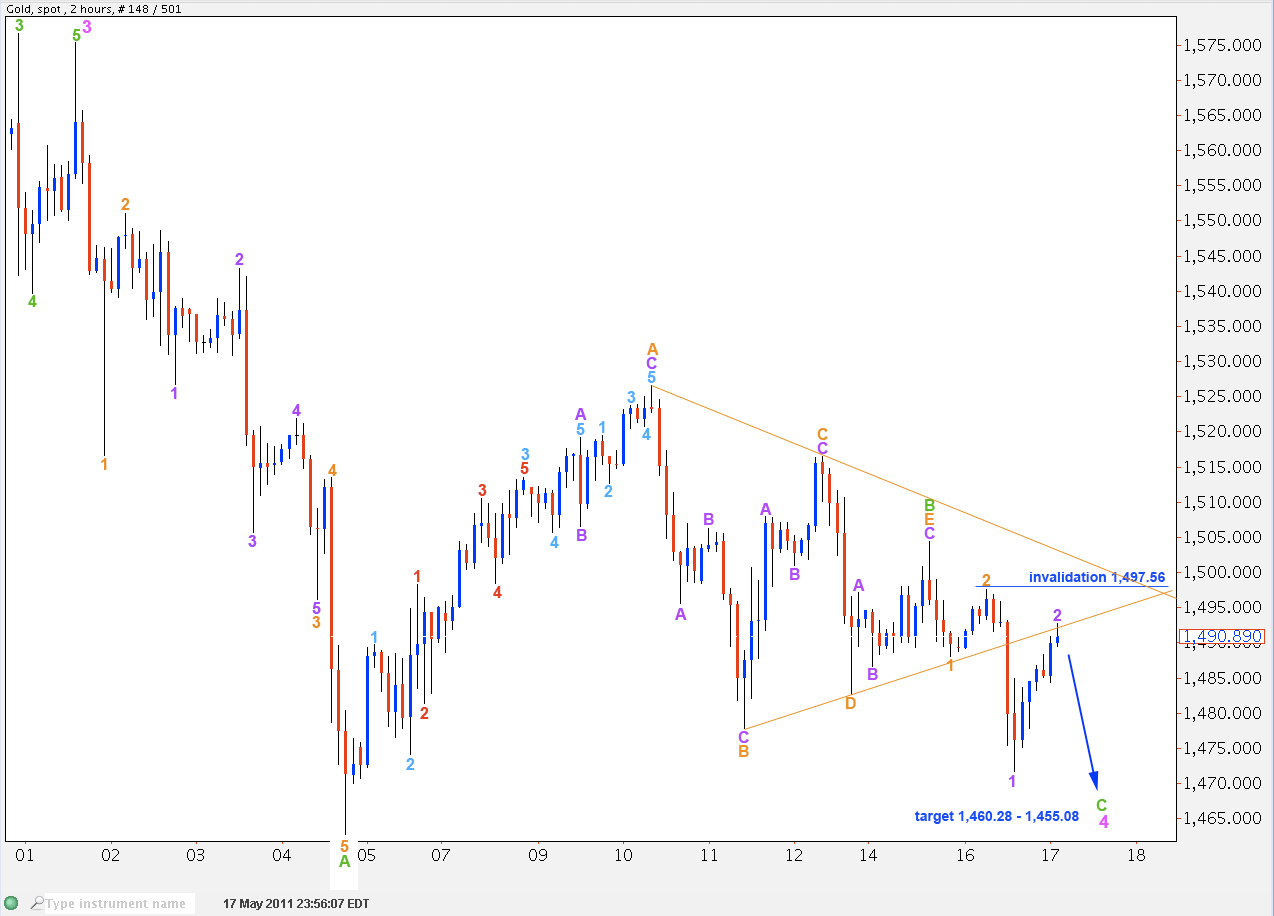
The 2 hourly chart above shows all of wave 4 pink. Wave 3 pink ended in a slight truncation which means that the upwards movement for wave 3 pink has an impulsive count of 9. It also leaves wave A within wave 4 pink as a clear impulse.
Ratios within wave A green are: wave 3 orange is 3.78 short of equality with wave 1 orange and wave 5 orange is 0.92 short of 0.618 the length of wave 3 orange.
Ratios within wave 3 orange of wave A green are: wave 3 purple is 1.76 short of 1.618 the length of wave 1 purple and wave 5 purple is 1.5 short of equality with wave 1. This is a near perfect impulse.
The excellent ratios within this downwards wave give me confidence that this labeling is correct and wave A green downwards was a five wave structure. Therefore, this fourth wave correction is most likely to be a zigzag.
Wave B green is a contracting triangle. Four of the five subwaves are clear zigzags (wave D orange may have been an impulse) and wave E orange is just 0.86 longer than 0.618 the length of its predecessor wave D orange. This triangle meets all rules and guidelines nicely.
We would be expecting a five wave structure downwards for wave C green to end this zigzag for wave 4 pink.
On the hourly chart the downwards wave labeled 1 purple is a very clear five wave impulse. Considering the excellent ratios and clean structures I have seen so far for Gold I would not want to try to see that as a zigzag. So wave C green is most likely unfolding as an impulse with an extended third wave within it.
At 1,460.28 wave C green will reach 0.382 the length of wave A green. At 1,455.08 it will reach the 0.618 fibonacci ratio of wave 1 green. Thus wave C green may end about this target zone.