Elliott Wave chart analysis for the WTI Crude for 16th May, 2011. Please click on the charts below to enlarge.
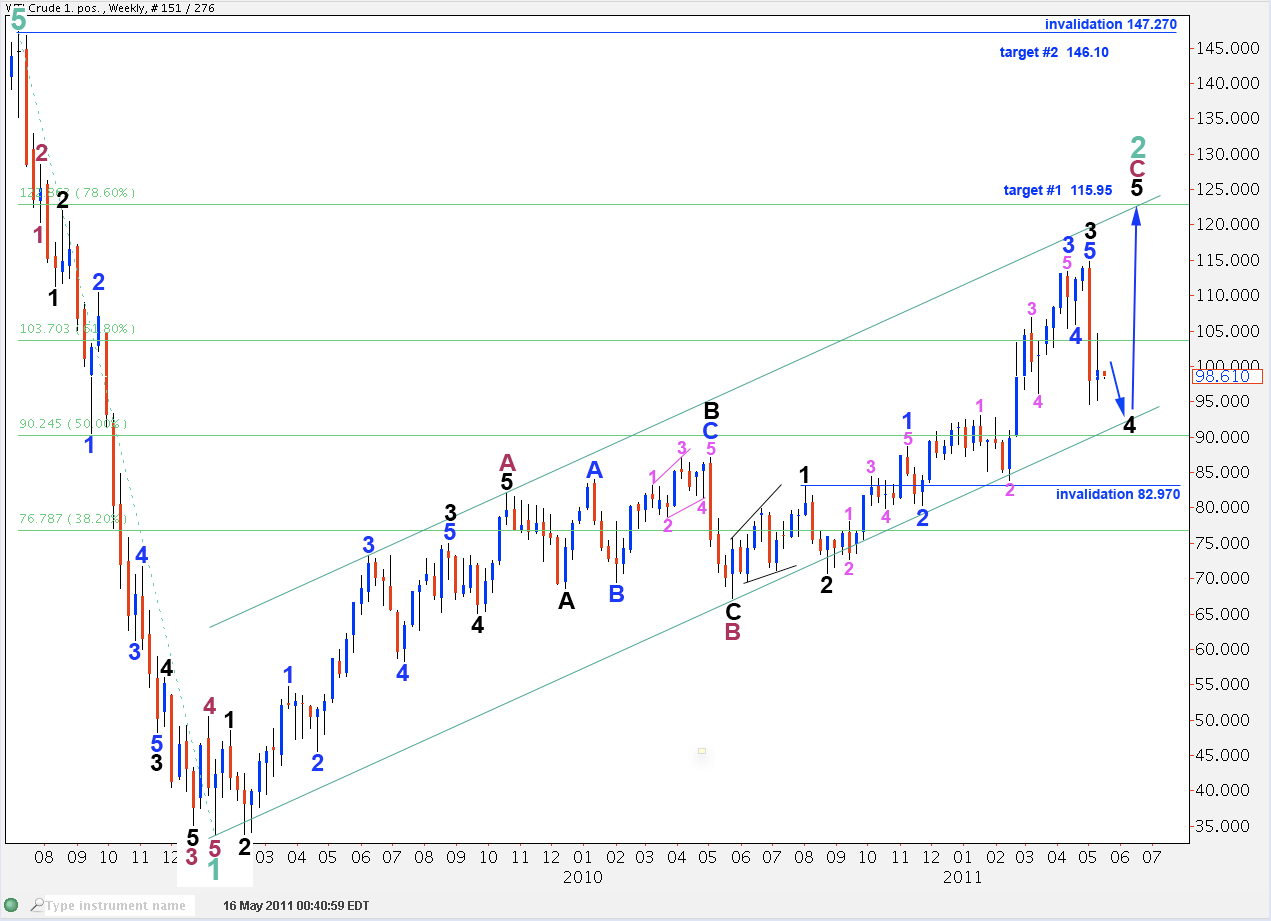
I have started this wave count at the all time high of 147.27. I have data back to the 1970’s which shows a long rise with increased momentum towards the end, which looks like a five wave impulse. So I have labeled this high the end of a cycle wave 5.
Thereafter, the sharp downwards wave looks very impulsive, particularly compared to the following rise which looks very corrective, and this impulsive drop I have labeled a cycle degree wave 1.
This degree of labeling sees cycle wave 1 lasting only 7 months. But cycle wave 2 lasts over 2 years and so this degree may be correct.
Ratios within cycle wave 1 are: primary wave 3 has no ratio to primary wave 1 and primary wave 5 is just 0.62 longer than 0.618 the length of wave 1.
Ratios within primary wave 3 of cycle wave 1 are: wave 3 black is 0.58 longer than 4.236 the length of wave 1 and wave 5 has no ratio to waves 1 or 3.
Ratios within black wave 3 or primary wave 3 of cycle wave 1 are: wave 3 blue is 1.78 short of 1.618 the length of wave 1 blue and wave 5 blue has no fibonacci ratio to either of 1 or 3.
Within cycle wave 2 zigzag upwards primary wave C will reach equality with primary wave A at 115.95. This would allow black wave 5 to make a slightly higher high before a trend change. Alternately, primary wave C will reach 1.618 the length of wave A at 146.10. This would allow an overshoot of the parallel channel containing this zigzag and give the end of this second wave zigzag a typical look.
Ratios within primary wave A are: black wave 3 is 1.28 longer than 2.618 the length of black wave 1 and black wave 5 is 1.6 short of equality with wave 1.
Ratios within wave 3 black of primary wave A are: wave 3 blue has no ratio to wave 1 blue and wave 5 blue is just 0.99 short of equality with wave 3 blue.
Primary wave B is an expanded flat correction. Black wave B is a 138% correction of black wave A and black wave C is 1.69 short of 1.618 the length of black wave A.
Within black wave B flat correction within primary wave B, blue wave B is a 94% correction of blue wave A and blue wave C has no ratio to wave A.
Within primary wave C black wave 3 is 2.66 longer than 2.618 the length of black wave 1.
Ratios within black wave 3 within primary wave C are: blue wave 3 has no fibonacci ratio to blue wave 1 and blue wave 5 is 1 longer than 0.236 the length of blue wave 3.
Ratios within blue wave 1 of black wave 3 are: pink wave 3 is just 0.11 short of 1.618 the length of pink wave 1 and there is no adequate ratio between pink wave 5 and either of 3 or 1.
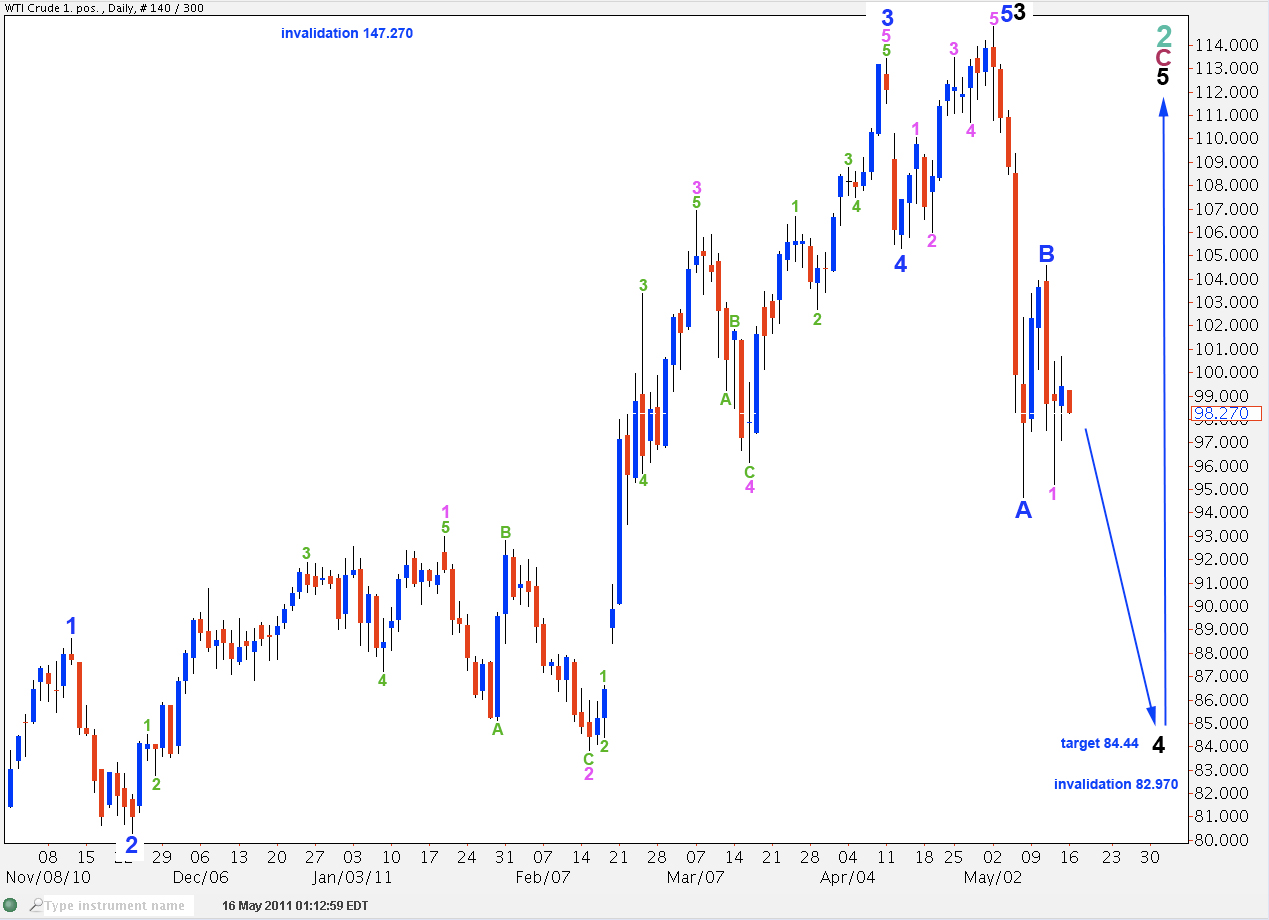
The daily chart shows the end of primary wave C.
Ratios within blue wave 3 are: wave 3 pink is 2.54 longer than 1.618 the length of blue wave 1 and there is no ratio between pink wave 5 and either of 1 or 3.
Ratios within pink wave 1 of blue wave 3 are: wave 3 green has no fibonacci ratio to wave 1 green and wave 5 green is just 0.28 short of 0.618 the length of wave 3 green.
Within wave 2 pink flat correction within wave 3 blue wave C green is 1.11 longer than equality with wave A green.
Ratios within wave 3 pink within wave 3 blue are: wave 3 green is just 0.03 short of 6.854 the length of wave 1 green (an unusual fibonacci ratio obtained by dividing a fibonacci number by its fourth predecessor), and wave 5 green is 0.98 short of 0.618 the length of wave 3 green.
Within wave 4 pink zigzag wave C green is just 0.47 longer than 0.618 the length of wave A green.
Ratios within wave 5 pink of wave 3 blue are: wave 3 green is just 0.38 short of 0.618 the length of wave 1 green and wave 5 green is 0.18 short of equality with wave 3 green.
Ratios within wave 5 blue are: wave 3 pink is just 0.19 short of 1.618 the length of wave 1 pink and wave 5 pink is just 0.63 short of equality with wave 1 pink. This is an almost perfect impulse.
It would be reasonable to expect wave 4 black is unfolding as a zigzag and that wave C blue may reach equality with wave A blue at 84.44.
When wave 4 black is complete then price should turn upwards for a final intermediate (black) degree wave to most likely make new highs towards targets on the weekly chart.
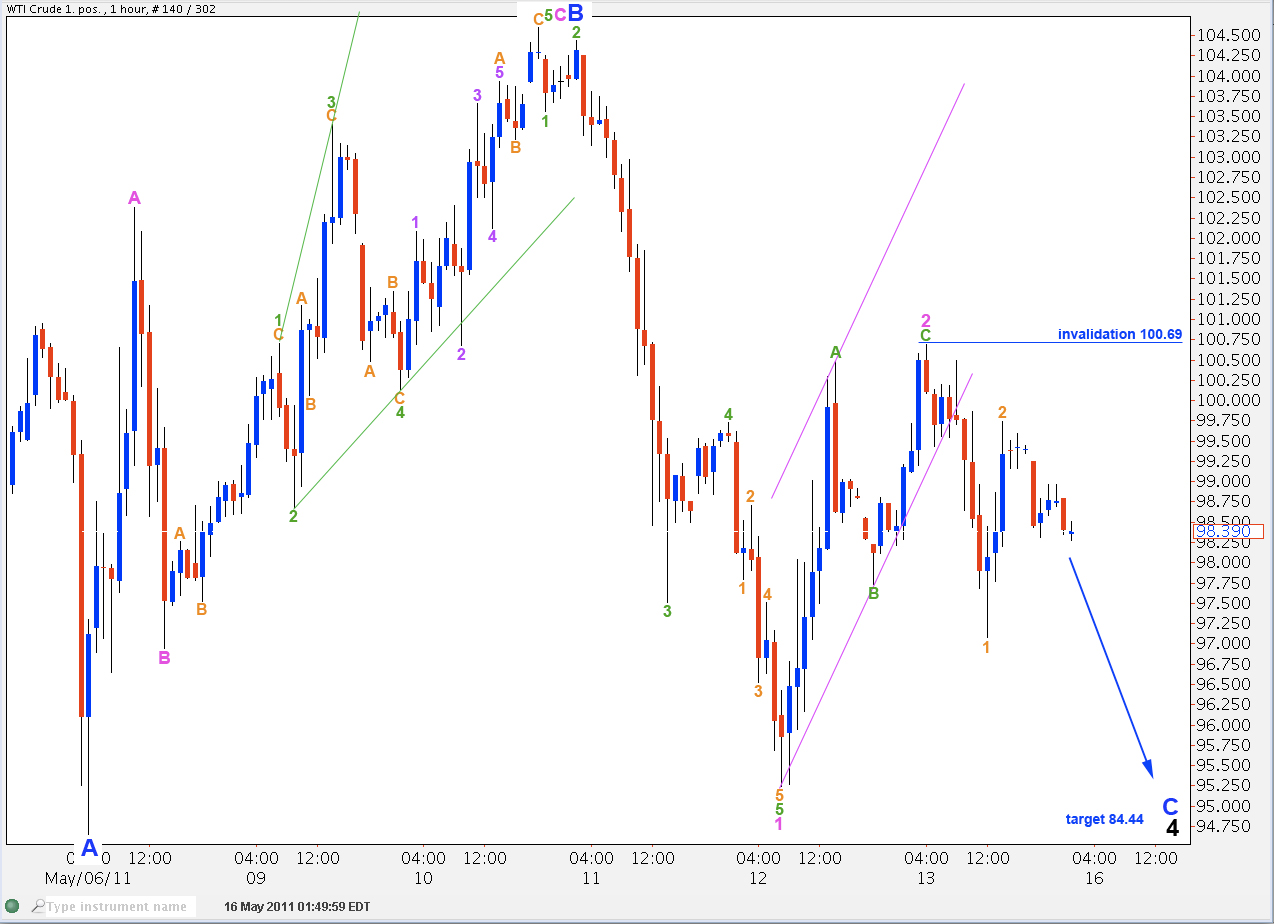
The hourly chart shows all of wave B blue and wave C blue so far of this zigzag downwards for wave 4 black.
Within wave B blue zigzag wave C pink is just 0.07 short of equality with wave A pink. There is nice alternation between waves A and C pink; wave A is a simple impulse and wave C is an ending diagonal.
Ratios within wave 1 pink downwards are: wave 3 green is just 0.13 longer than 6.854 the length of wave 1 green and wave 5 green is just 0.21 longer than 0.618 the length of wave 3 green.
Wave 2 pink zigzag may be over, and with a very clear trend channel breach of the small parallel channel drawn around it, we may expect that the zigzag is complete.
There is a possibility that wave 2 pink may continue sideways as a combination. The following wave downwards labeled 1 orange looks most like a 3 wave structure. This may also be labeled an X wave zigzag of a combination. Movement above 100.69 would see this alternate idea as correct. At that stage the invalidation point would necessarily move up to 104.60 but we would expect further sideways movement.
Wave 1 green of wave 3 pink may be unfolding as a leading diagonal because the first wave down looks like a zigzag. If this diagonal unfolds in this position then we may expect an extended third wave at green degree to follow it.
Overall we would be expecting this downwards trend to continue for about another week.
If this wave count is correct then we may see a trend change coming up in about a week or so for oil.
This wave count has some remarkably good fibonacci ratios within it. I have been struck by the close fibonacci ratios of both gold and now oil. Almost perfect Elliott wave structures can be seen. This means that a good wave count really should be able to provide often very accurate targets (not always, but more often than not).
I will publish gold tomorrow and silver thereafter, as soon as they are done. I will endeavour to update oil for you after the New York close on Tuesday.


Hi Lara,
Are the WTI historical charts with updated wave counts in another location or have you quit following this market?
Thanks, David
David,
The WTI analysis is now on the Elliott Wave Gold website. Here are the links:
US OIL: http://elliottwavegold.com/category/us-oil/
US OIL HISTORICAL: http://elliottwavegold.com/category/us-oil-historical/
Lara,
Thanks for these additional charts and counts. I much appreciate the added value. I hope your promo week is very successful.
Gene Heil