
Elliott Wave chart analysis for Gold for 16th May, 2011. Please click on the charts below to enlarge.
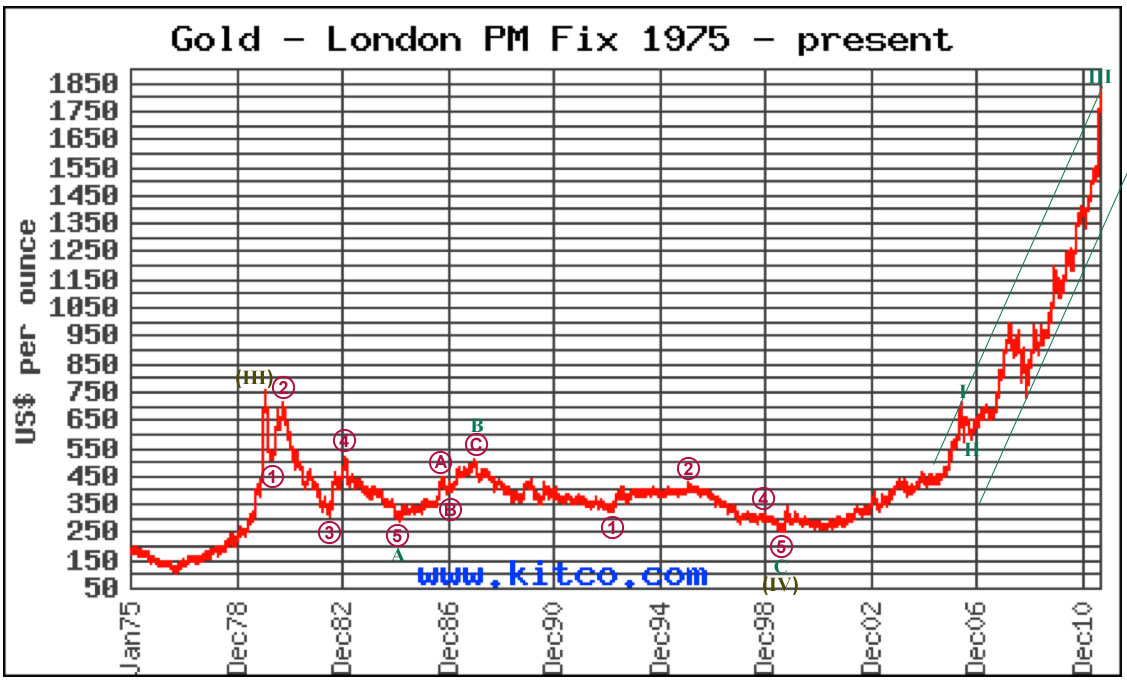
Olive labels are super cycle and teal green labels are cycle.
There are some remarkably good fibonacci relationships in this analysis.
Cycle wave A ending Feb 1985 lasted a fibonacci 54 months. Cycle wave B ending Dec 1987 was a 50% correction of wave A and lasted a fibonacci 34 months. Cycle wave C is 234.61 in length and is just 3.16 longer than 0.618 the length of cycle A, and lasted 141 months, just 3 short of a fibonacci 144.
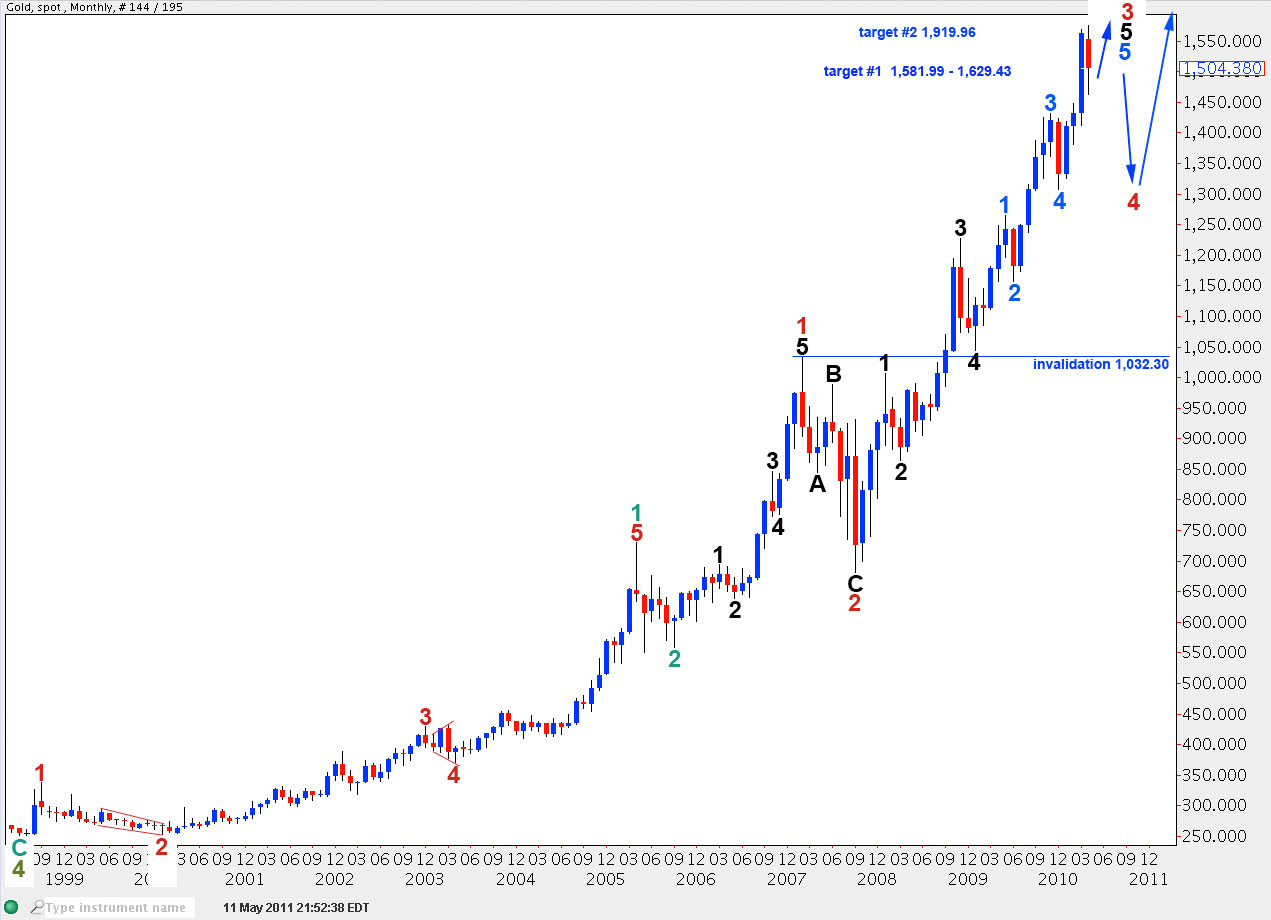
Within cycle degree wave 1 ratios between primary (maroon) waves are: primary 3 has no fibonacci ratio to primary 1 and primary 5 is just 10.6 short of 4.236 the length of primary wave 1.
Primary 1 lasted a fibonacci 2 months. Primary wave 3 lasted 35 months, one month longer than a fibonacci 34. Primary wave 5 lasted 24 months and is not close enough to 21 for a fibonacci relationship.
Within cycle wave 3 primary wave 1 was 473 long and lasted 17 months. If primary wave 3 is 2.618 the length of wave 1 price will rise to 1,919.96. This is a second target for primary 3 to end.
Within primary wave 3 ratios between intermediate (black) waves are: wave 3 black has no fibonacci ratio to wave 1 black. If wave 5 black reaches 1.618 the length of wave 1 black price would rise to 1,629.43. This is the first target for primary wave 3 to end.
Within primary wave 3, this wave count sees gold in intermediate wave 5 and within that in minor (blue) wave 5.
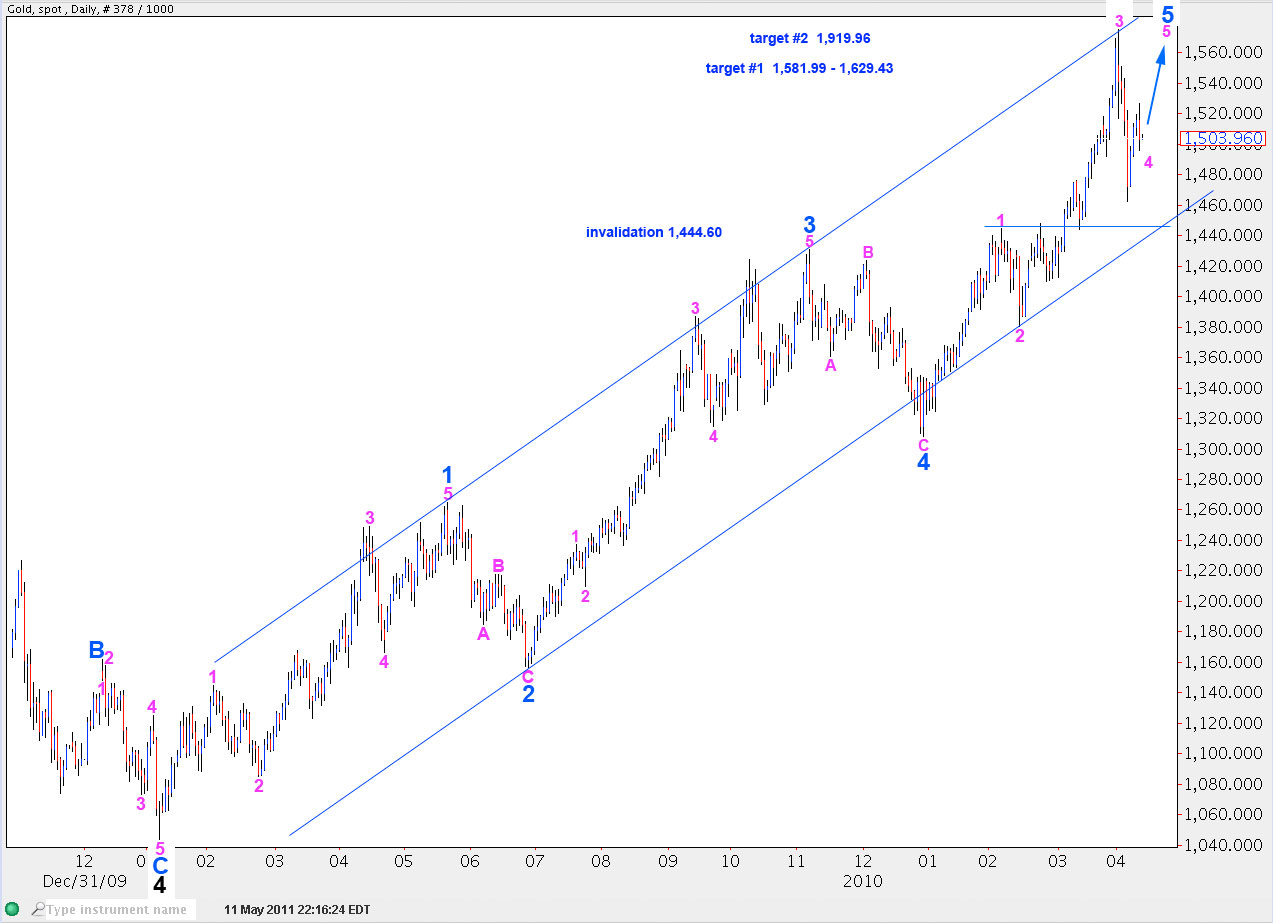
Within blue wave 5 pink wave 4 is completing, possibly as a triangle. Thereafter, one final upwards wave should end primary wave 3 and then gold may be due for a large trend change at primary degree.
Wave 3 blue has no fibonacci ratio to wave 1 blue and they are not close enough to equality either. This indicates that it is more than likely that we shall see a ratio between wave 5 blue and either of 3 or 1. Wave 5 blue will reach equality with wave 3 blue at 1,581.99. This is the lower end of the first target zone.
Within wave 5 blue wave 3 pink has no fibonacci ratio to wave 1 pink. Again, this indicates that it is more than likely that wave 5 pink will exhibit a ratio to either of 1 or 3 pink. If wave 4 pink was a zigzag and was over at 1,462.27 then wave 5 pink will reach equality with wave 1 pink at 1,598.67. This price point is within the first target zone.
However, a cursory look at the hourly chart shows a triangle likely to be forming. If this triangle holds and remains valid then we shall have a very high probability of price moving upwards about 49.07 when it is over.
At this stage it looks like the triangle is moving higher for wave D. It may take another day or two to complete.