
Elliott Wave chart analysis for the S&P 500 for 12th May, 2011. Please click on the charts below to enlarge.
Price has remained below 1,359.44 and we may see both of yesterday’s hourly wave counts still valid, with slight adjustments.
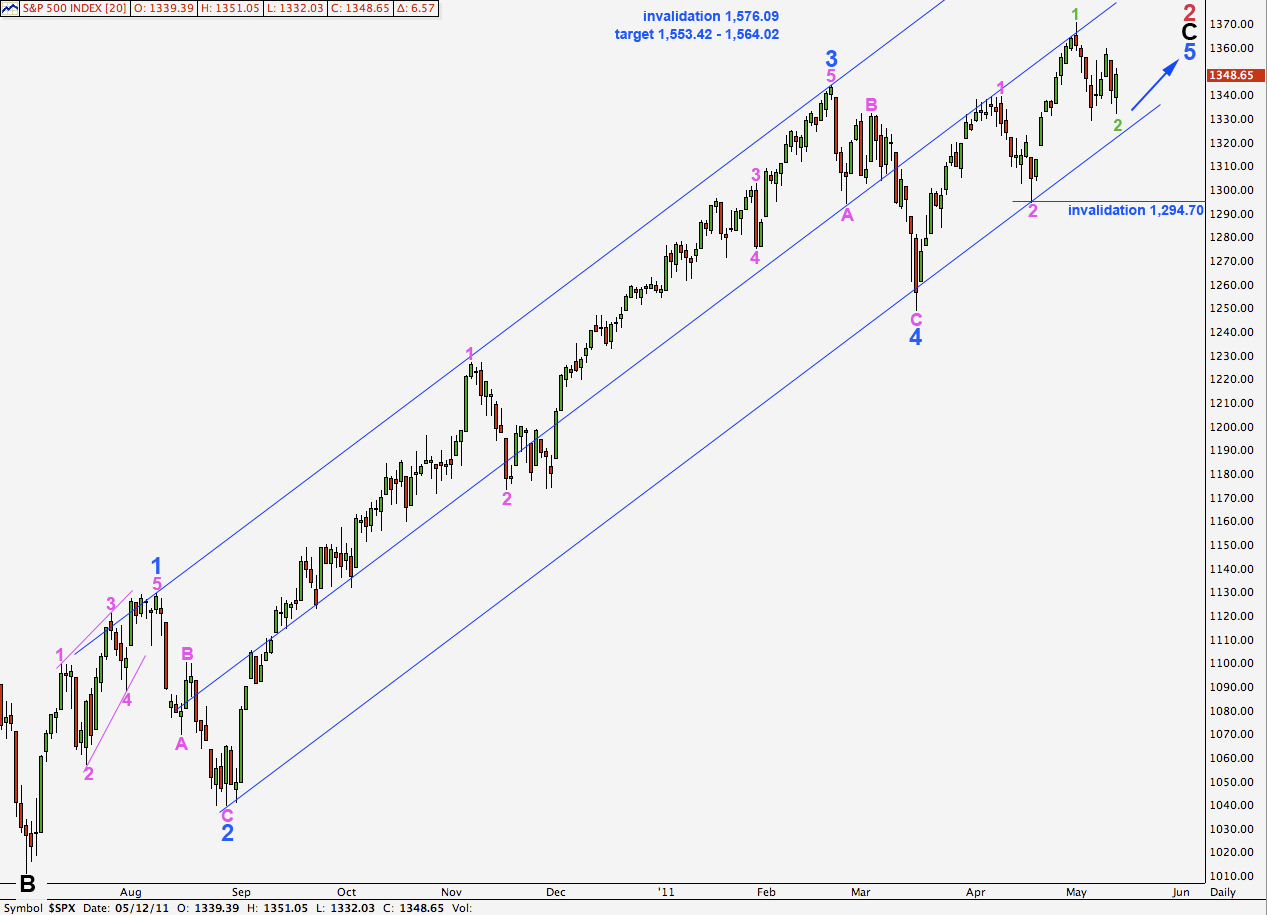
It is increasingly likely that this second wave correction is over now and so I have swapped the main and hourly wave counts over today to reflect this.
When this correction is over we will expect new highs as a third wave within a third wave moves upwards.
Any further downwards movement is likely to be contained within the parallel channel drawn here on the daily chart.
The target for primary wave 2 to end remains the same. At 1,564.02 wave C black will reach equality with wave A black. At 1,553.42 wave 5 blue will reach equality with wave 3 blue.
Main Hourly Wave Count.
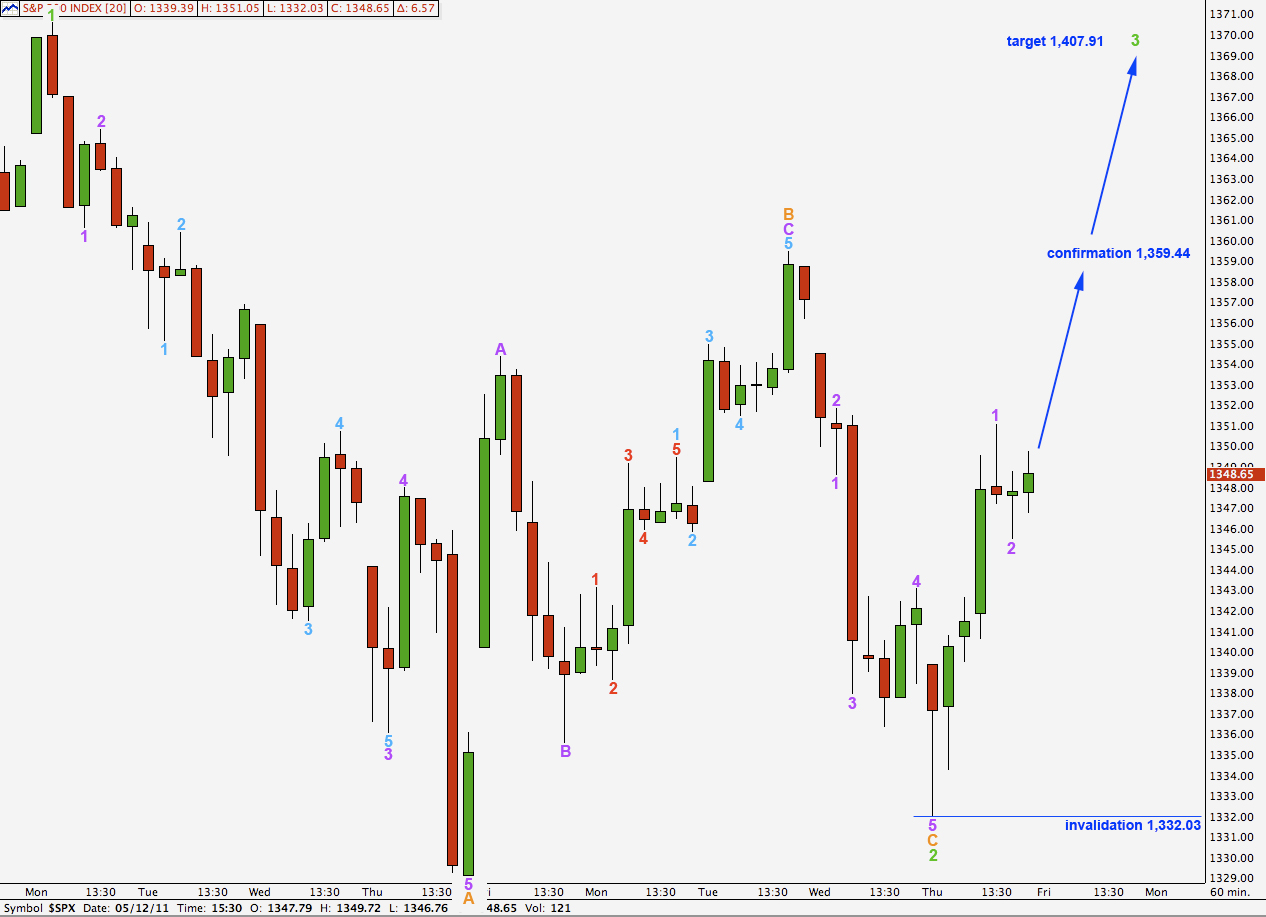
With slightly lower movement we may still see wave C orange as a complete five wave impulse and now waves 2 and 4 within it have nice alternation. The ratio between waves 1 and 5 purple is slightly better: wave 5 is just 0.2 longer than equality with wave 1.
Wave C orange now has a fibonacci ratio to wave A orange: it is just 1.82 points longer than 0.618 the length of wave A.
Despite the truncation this wave count has good proportions and the structures are complete.
Upwards movement labeled wave 1 purple is a very clear five wave impulse on the hourly chart.
Wave 2 purple may not move beyond the start of wave 1 purple. This wave count is invalidated with movement below 1,332.03.
We may consider movement above 1,359.44 confirmation of this wave count. At that stage it would be extremely likely that a third wave is underway. At 1,407.91 wave 3 green would reach equality with wave 1 green.
Alternate Hourly Wave Count.
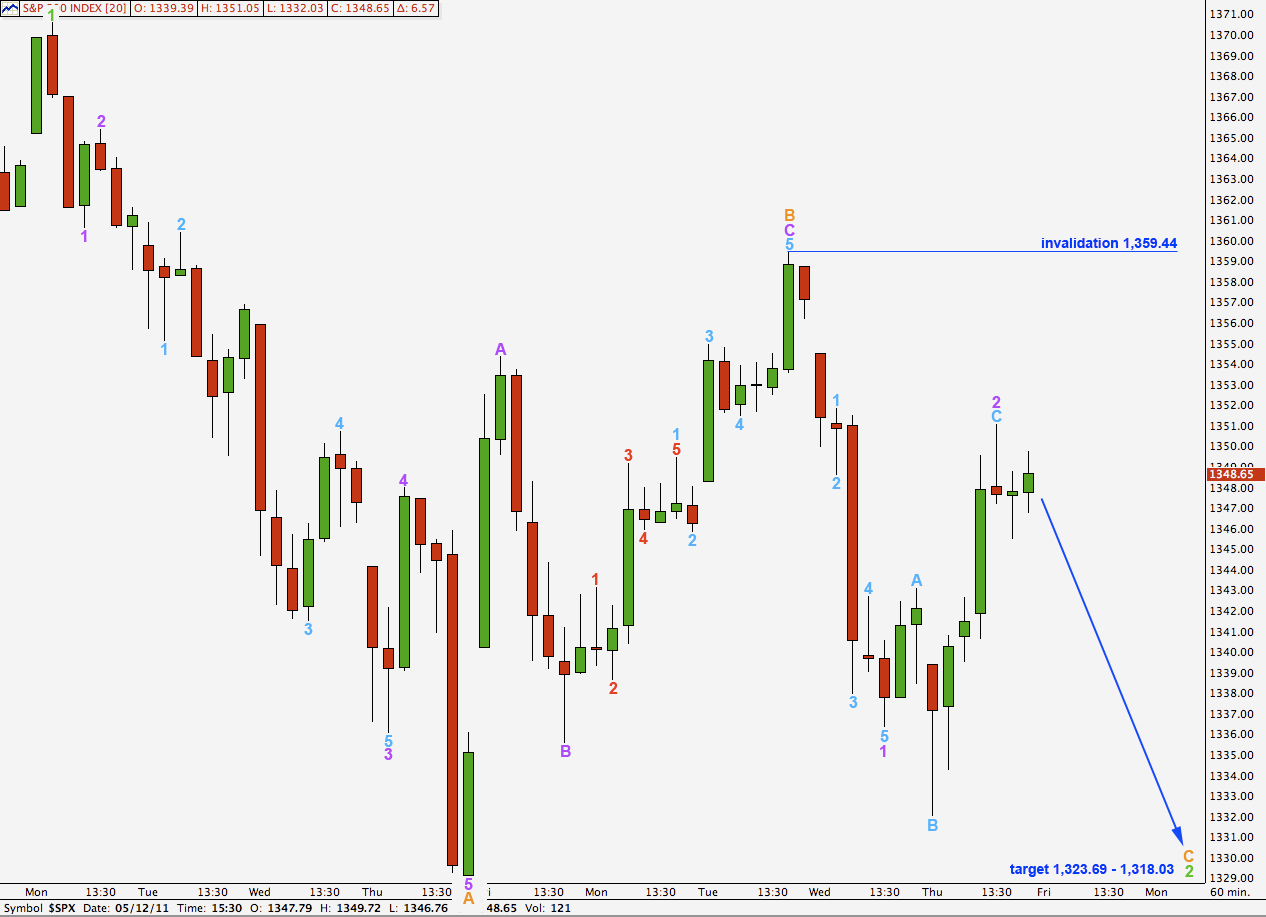
This wave count now looks less likely today as the correction for wave 2 purple looks out of proportion to what we would expect.
At 1,318.03 wave C orange will reach equality with wave A orange. At 1,323.69 wave 2 green will reach the 0.618 fibonacci ratio of wave 1 green. This is our target for downwards movement to end. The upper end of this range is more likely if price finds strong support at the parallel channel on the daily chart.
Wave 2 may not move beyond the start of wave 1. This wave count is invalidated with movement above 1,359.44.