
Elliott Wave chart analysis for the S&P 500 for 11th May, 2011. Please click on the charts below to enlarge.
Movement below 1,349.44 confirmed out first alternate hourly wave count. This was the only wave count which remained valid of the three yesterday. Thereafter, it expected further downwards movement.
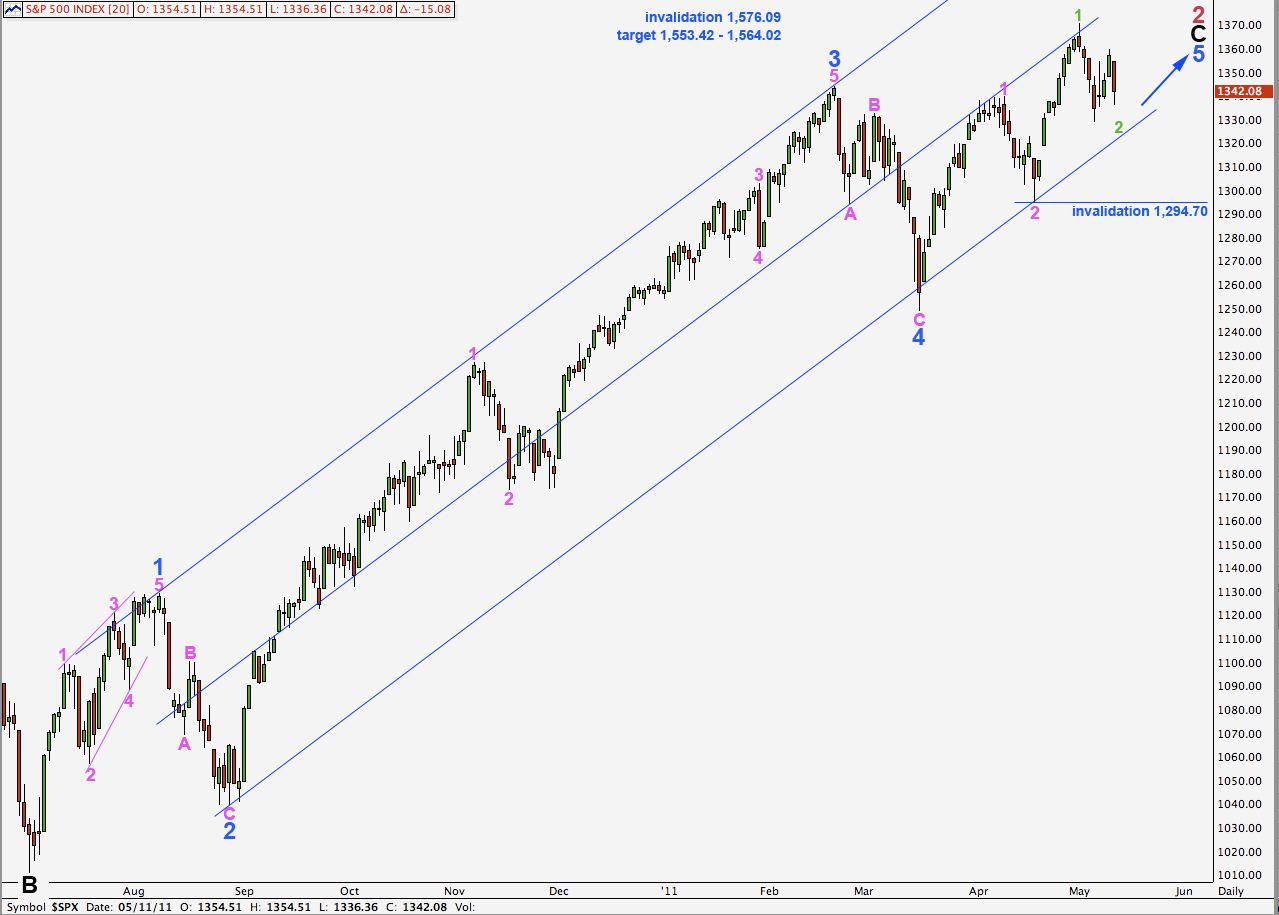
Wave 2 green now has a good three wave look on the daily chart. It is technically possible for this zigzag to be over already, with a truncated C wave. If it is not over we should know fairly quickly when markets open tomorrow as the next wave down would be a third wave within wave C.
When this correction is over the next move should be a third wave of a third wave upwards.
Any further downwards movement is likely to be contained within the parallel channel drawn here on the daily chart.
The target for primary wave 2 to end remains the same. At 1,564.02 wave C black will reach equality with wave A black. At 1,553.42 wave 5 blue will reach equality with wave 3 blue.
Main Hourly Wave Count.
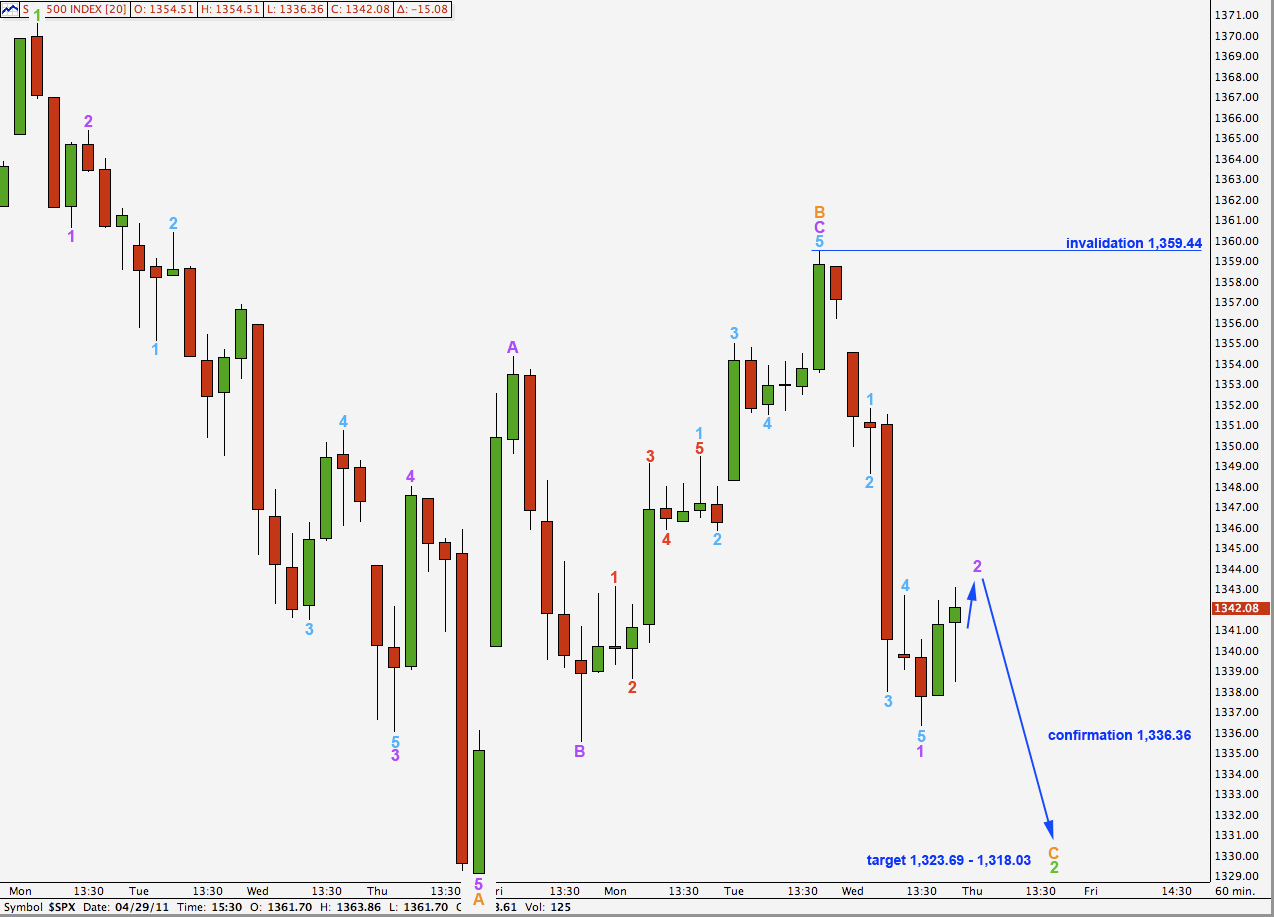
The only difference between this main hourly wave count and the alternate is the degree of labeling.
Downwards movement is a five wave impulse. Ratios within wave 1 purple are: wave 3 aqua has no fibonacci ratio to wave 1 aqua and wave 5 aqua is just 0.36 points short of 0.618 the length of wave 1 aqua.
At 1,318.03 wave C orange will reach equality with wave A orange. At 1,323.69 wave 2 green will reach the 0.618 fibonacci ratio of wave 1 green. This is our target for downwards movement to end. The upper end of this range is more likely if price finds strong support at the parallel channel on the daily chart.
Wave 2 purple is likely either over already or very soon to be over. The next move should occur quickly, providing us with clarity, if this wave count is correct.
Wave 2 may not move beyond the start of wave 1. This wave count is invalidated with movement above 1,359.44.
Alternate Hourly Wave Count.
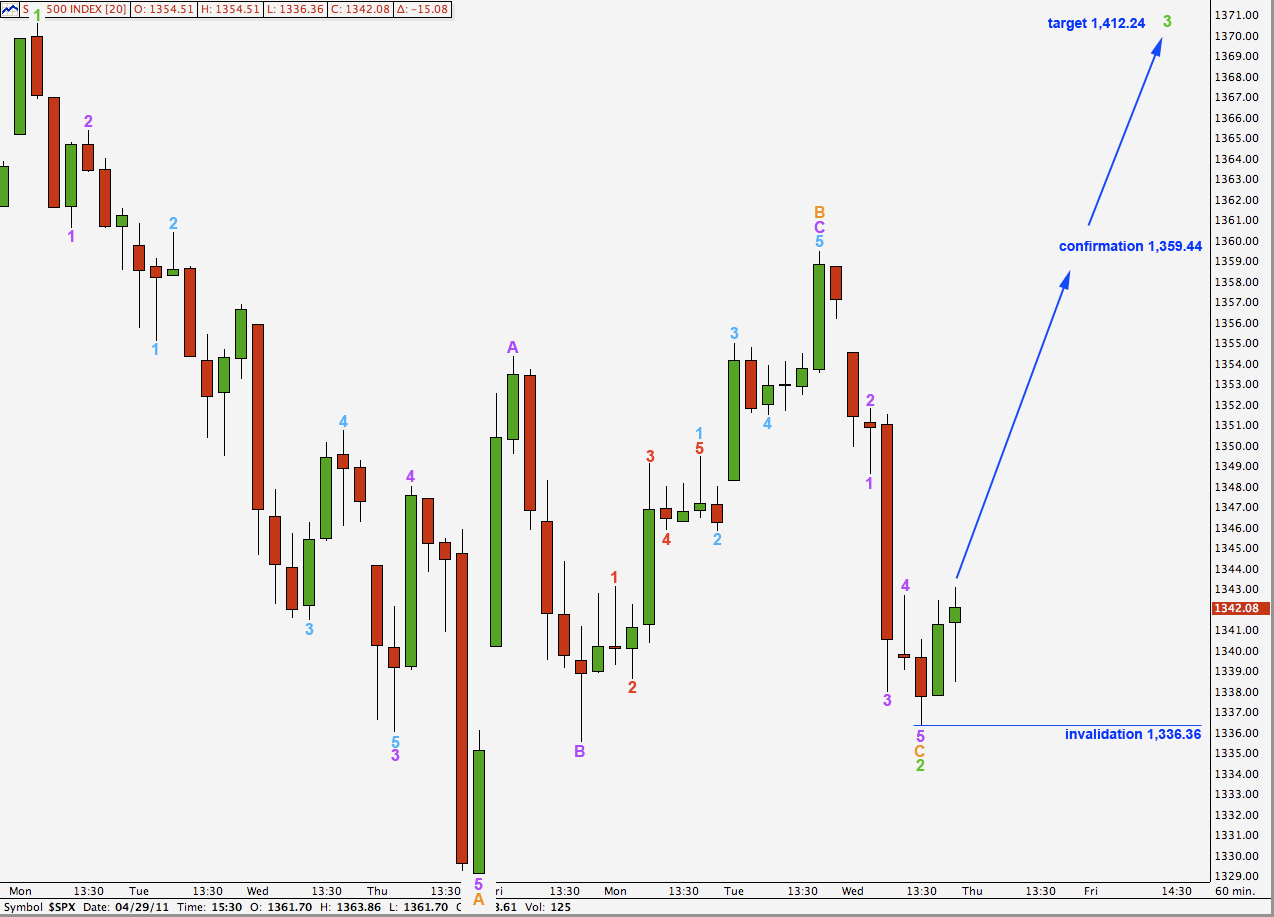
If we move the degree of labeling up one degree we may have seen an end to this second wave zigzag with a truncated C wave.
There is no adequate fibonacci ratio between waves A and C orange.
Any second wave correction within wave 3 green may not move beyond the start of the first. This wave count is invalidated with movement below 1,336.36.
Movement above 1,359.44 would confirm this wave count. At that stage we would expect price to continue to rise to the mid to short term target of 1,412.24 where wave 3 green would reach equality with wave 1 green.