Elliott Wave chart analysis for the S&P 500 for 5th May, 2011. Please click on the charts below to enlarge.
Downwards movement into wave 1 pink price territory, below 1,339.46, has invalidated our hourly and daily wave counts for recent movement. This may not be a fourth wave correction.
By simply moving the degree of labeling down one degree within the last wave up and the current downwards wave, we may be seeing an extended third wave develop at pink (minute) degree within wave 5 blue.
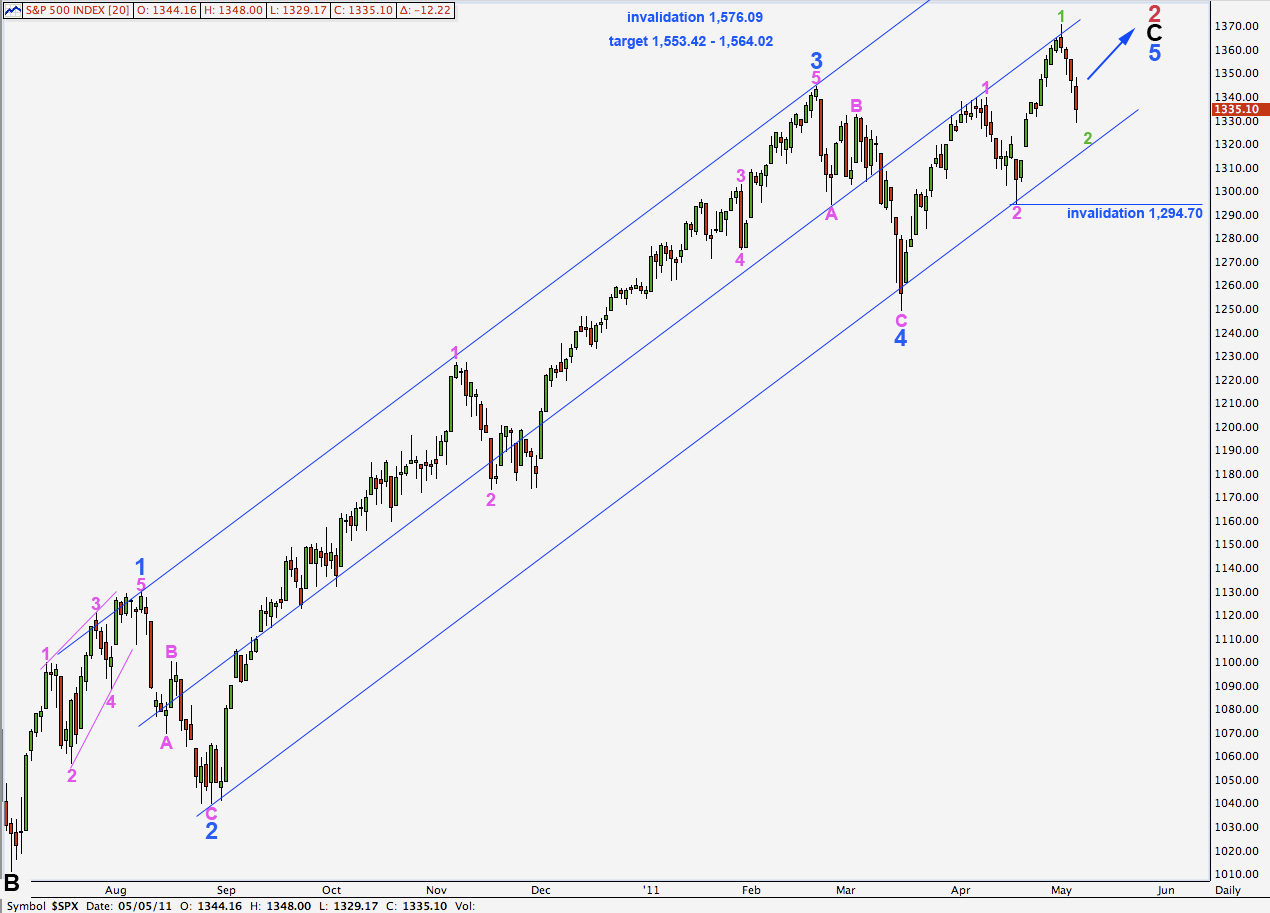
This means that upwards movement has a lot further to go than we expected yesterday and the original target of 1,553.42 to 1,564.02 is looking highly likely. This is where wave 5 blue will reach equality with wave 3 blue and wave C black will reach equality with wave A black.
If price rises as high as 1,485.16 then the alternate historic wave count must be considered. It will then be possible that we may see new all time highs from the S&P before a trend change and a strong downwards wave.
The upper invalidation point for this wave count is at 1,576.09.
Wave 2 green may not move beyond the start of wave 1 green. This wave count is invalidated with movement below 1,294.70.
We would expect the lower edge of the parallel channel drawn here to provide strong support for downwards movement.
By making this channel a double wide channel we may also expect the midline to provide resistance to upwards movement and if price breaks through this in the middle of the third wave up it may thereafter provide support for downwards corrections.
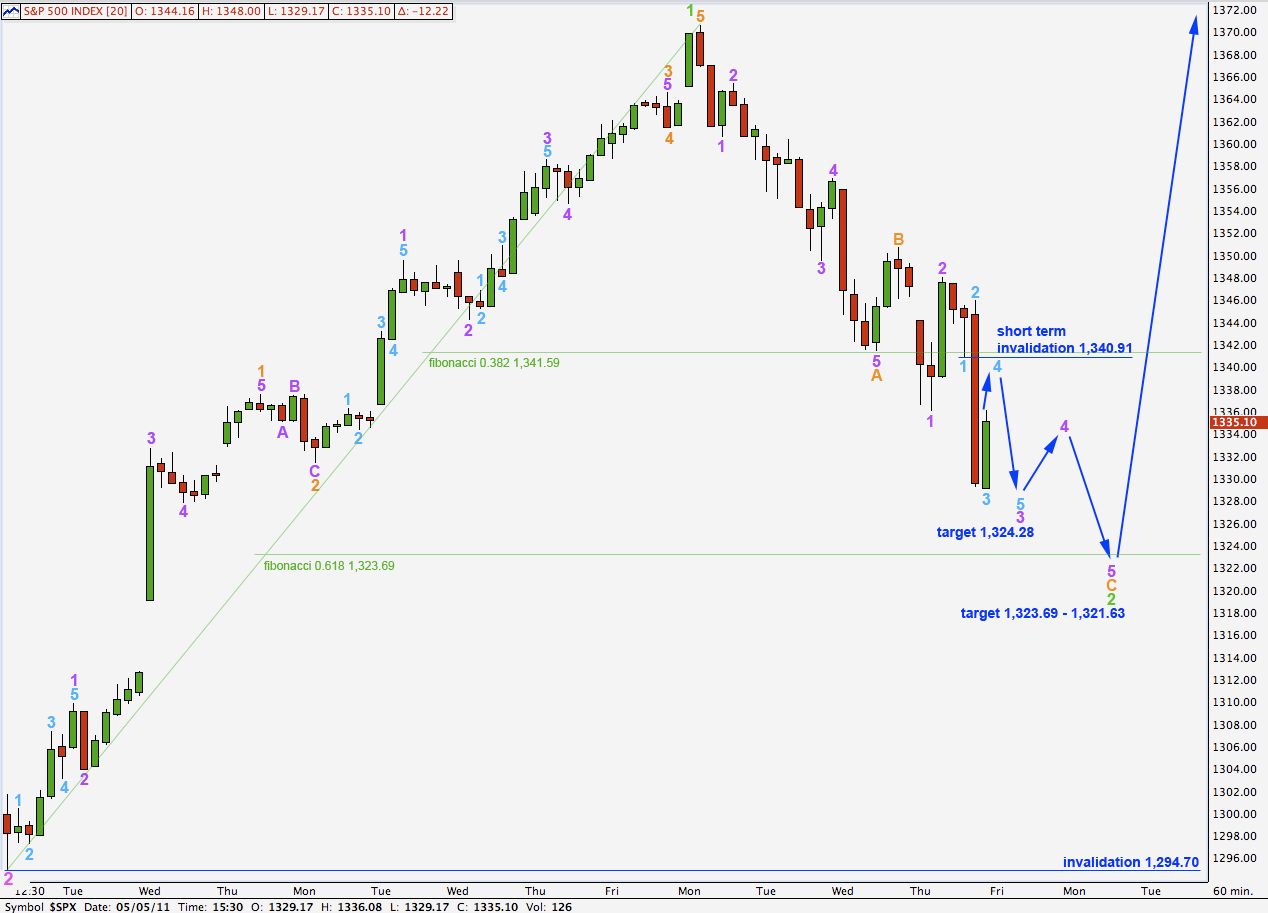
The subdivisions for today’s hourly chart are the same as yesterday, except the degree of labeling is one degree lower.
Downwards movement is not yet complete. Wave 2 green is most likely unfolding as a zigzag and so far the count is 9 which requires 2 more to be 11 and corrective.
At 1,321.63 wave C orange will reach equality with wave A orange. This is just below the 0.618 fibonacci ratio of wave 1 green, a common place for second wave corrections to end.
In the short term wave 4 aqua may move a little higher before it is complete. Wave 4 aqua may not move into wave 1 aqua price territory. This wave count is invalidated in the short term with movement above 1,340.91.
A final fifth wave down at aqua degree will end wave 3 purple. This may end about 1,324.28 if wave 3 purple reaches 1.618 the length of wave 1 purple.
Thereafter, wave 4 purple should unfold as a three wave structure upwards (or a triangle) which may not move into wave 1 purple price territory above 1,336.05.
A final fifth wave for wave 5 purple should end this structure. This may take another couple of days or so.
Movement below 1,294.70 would invalidate this wave count.
If the main daily wave count is invalidated with movement below 1,294.70 then this is at this stage the only valid explanation that I can see.
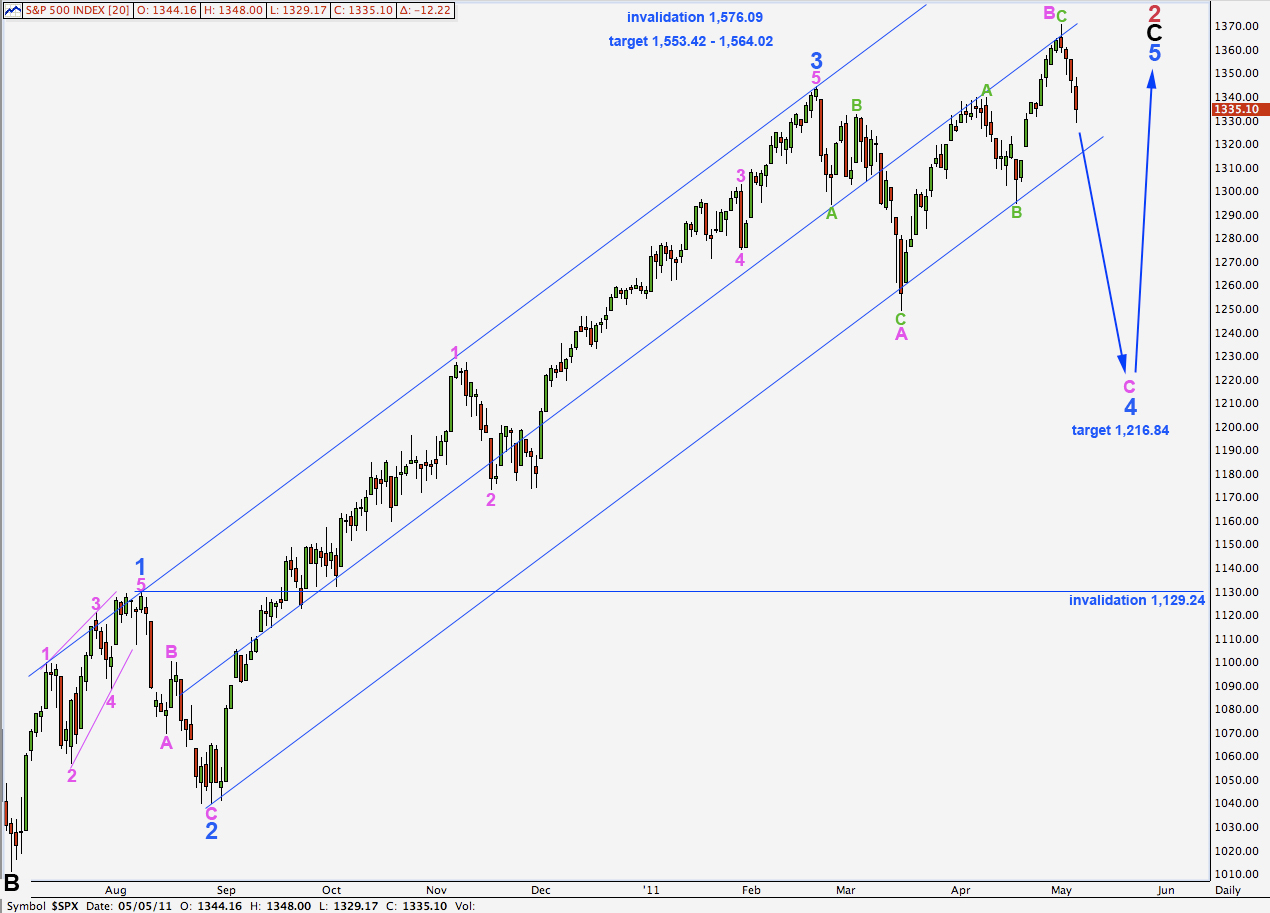
Wave 4 blue may be extending as an expanded flat correction. We would expect wave C pink to end beyond the end of wave A pink below 1,249.05. At 1,216.84 wave C pink would reach 1.618 the length of wave A pink.
This wave count may be technically correct, but it would look extremely strange, even stranger than the third wave we already have. This wave count requires significant movement outside of the parallel channel which contains the impulse for wave C black, and this would indicate a trend change at primary degree and not just a correction at minor degree.
Alternately, wave 4 blue could be a running flat correction where C pink fails to move below the end of wave A pink, but I don’t think upwards pressure is strong enough to force a correction into the same direction as the main trend, the opposite scenario is more believable. Even a running flat would require at least a reasonable sized channel breach and so it is scarcely more realistic than an expanded flat.
I am presenting this wave count for us today to illustrate why I do not consider it to be realistic. When we look at it on the daily chart, with arrows showing where price would be expected to move for this structure to complete in a typical fashion, it becomes clearer that it is not a serious contender.


Lara,
This may seem odd, but I have seen an alternate count that I am curious about. It sees Minor 3 as ending where you have Pink 1 of Minor 3 ending. Minor 4 ends where you have Pink 2 of minor 3 ending. It then has the rest of the move , starting with your Pink wave 2 as a long ending diagonal for Minor 5 (your Minor 3 top at 1344 would be minute 1 of Minor 5, your Minor 4 at 1249 would be minute 2 of Minor 5, etc.)
At first glance, it appears that all subwaves of this proposed Minor 5 subdivide into three wave structures.
If you do not have time to look at this, no worries. It just seemed interesting because it solves the problem of the odd look of Minor 3. Also with so many three wave structures recently, a diagonal seems like a good fit.
Thanks again for all your analysis.
Peter
Based on futures your invalidation point on the upside will be hit at open….thoughts….