
Elliott Wave chart analysis for the S&P 500 for 4th May, 2011. Please click on the charts below to enlarge.
The S&P has moved lower during Wednesday’s session to almost reach our target for wave 4 pink to end.
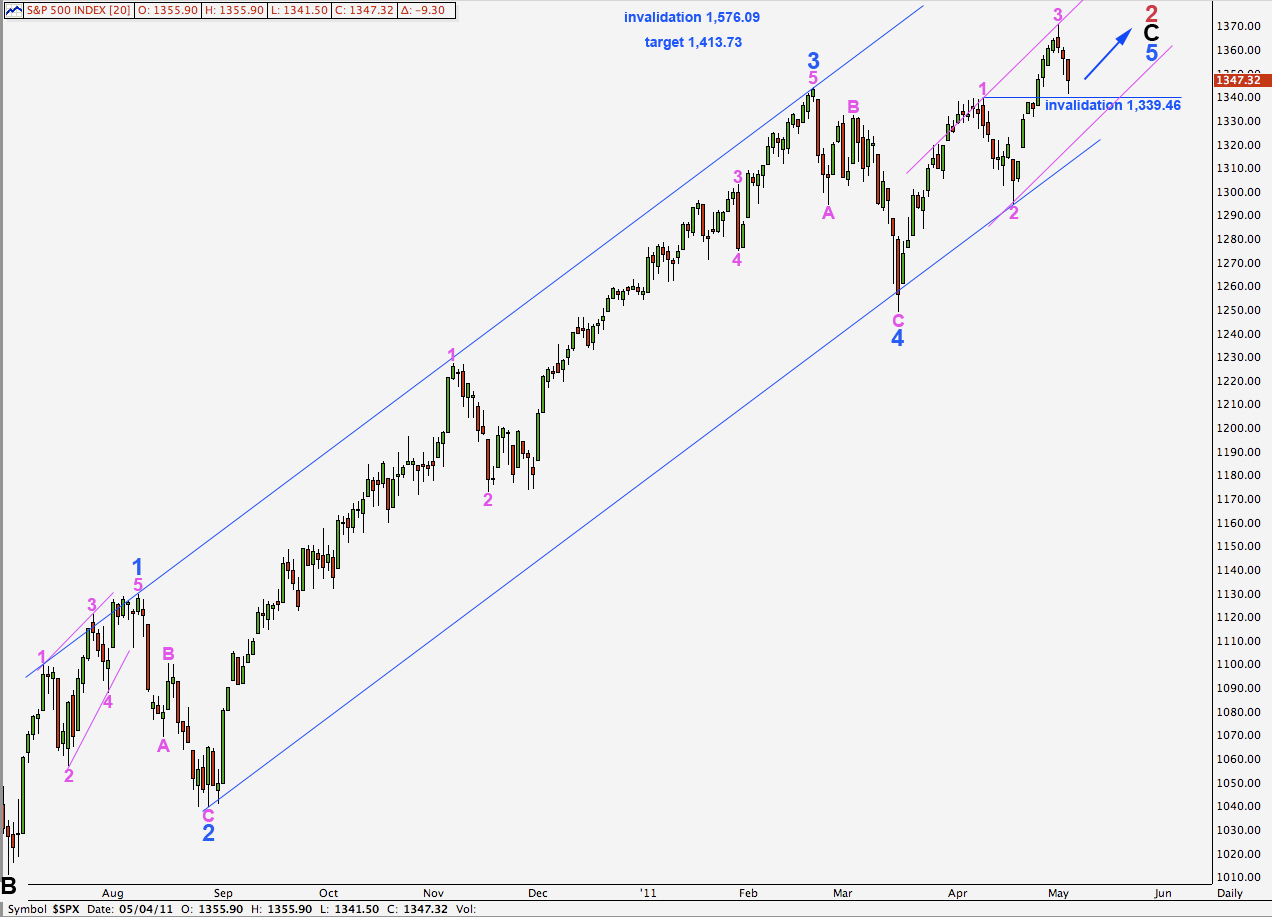
It is technically possible, but unlikely, that wave 4 pink is over as a brief simple zigzag. We shall use an alternate wave count for this possibility; this alternate has a low probability of being correct. This would also give no alternation in either structure or depth of correction between waves 2 and 4 pink. However, on the daily chart the structure for wave 5 blue, if the last pink wave 5 moves up from here, would have a decent look to it.
Our main hourly wave count expects further sideways movement yet before this fourth wave correction is complete. At this stage we may expect it to be either a triangle, regular flat, or a combination with the first structure as a regular flat.
Wave 2 pink was 7 days in duration. We may expect wave 4 pink to be about the same. At this stage it has only lasted 3 days.
Wave 4 pink may not move into wave 1 pink price territory. This wave count is invalidated with movement below 1,339.46.
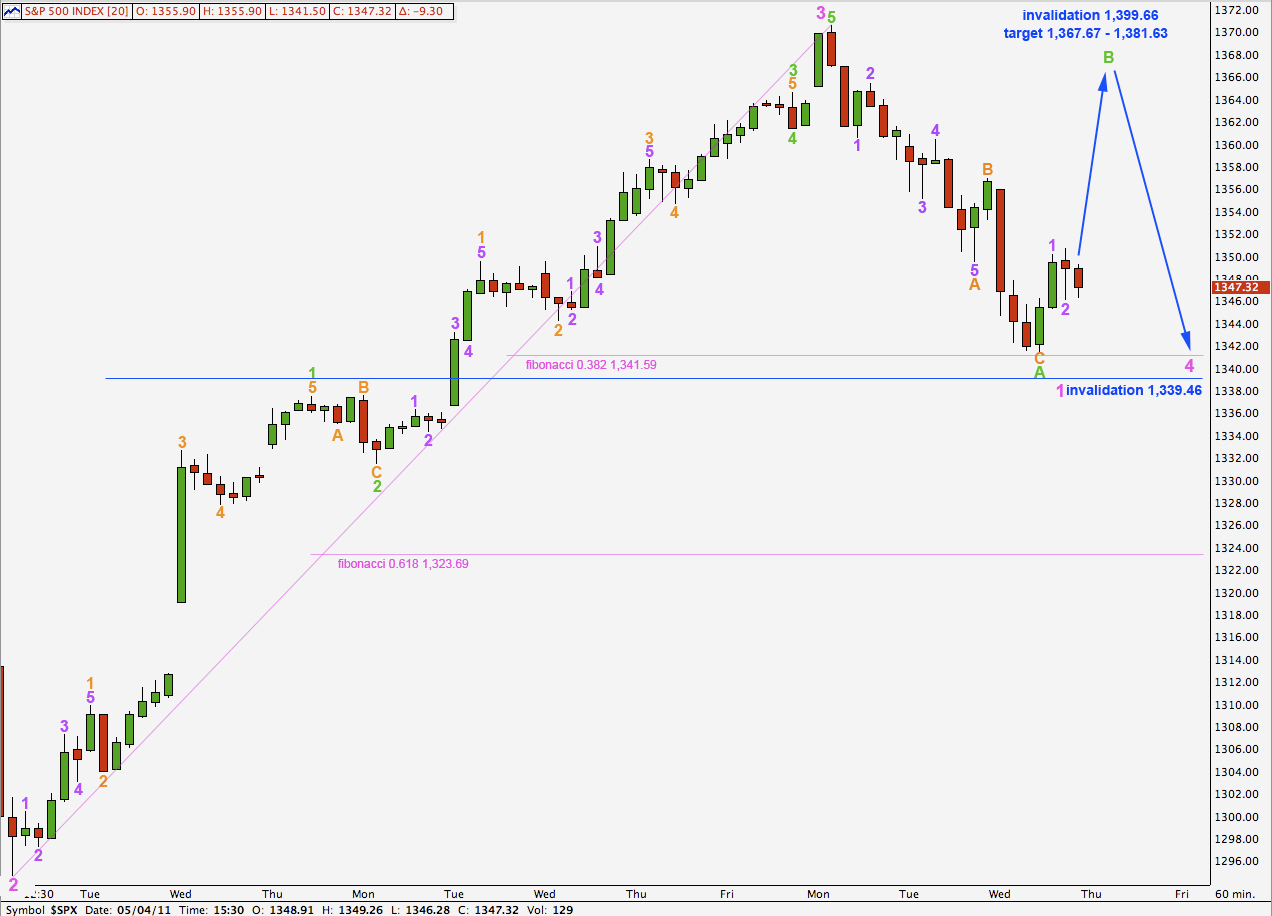
I have moved the degree of labeling for recent movement down one degree. Although the target for wave 4 pink to end was almost reached this downwards movement may be only wave A green of wave 4 pink. This would work well if wave 4 pink is unfolding as a triangle, or even as a regular flat.
If wave 4 pink is a flat correction then wave B green must reach at least 90% the length of wave A. This is achieved at 1,367.67.
The most common length of wave B to A within a flat is 100% to 138%. This is achieved at 1,370.58 to 1,381.63.
Wave B within a flat should not be longer than twice the length of wave A. Movement above 1,399.66 would eliminate an expanded flat for wave 4 pink. At that stage upwards movement would be seen as wave 5 pink and wave 4 would have to be over.
If wave B green does not reach up to 90% of A we will most likely be seeing a triangle unfold for wave 4 pink. A common length for subwaves of triangles is close to 80% of the wave prior. This would be achieved at 1,364.76.
Wave 4 pink may not move into wave 1 pink price territory. This wave count is invalidated with movement below 1,339.46.
The structure and length of this next upwards wave will provide clues as to the structure of wave 4 pink.
Alternate Hourly Wave Count.
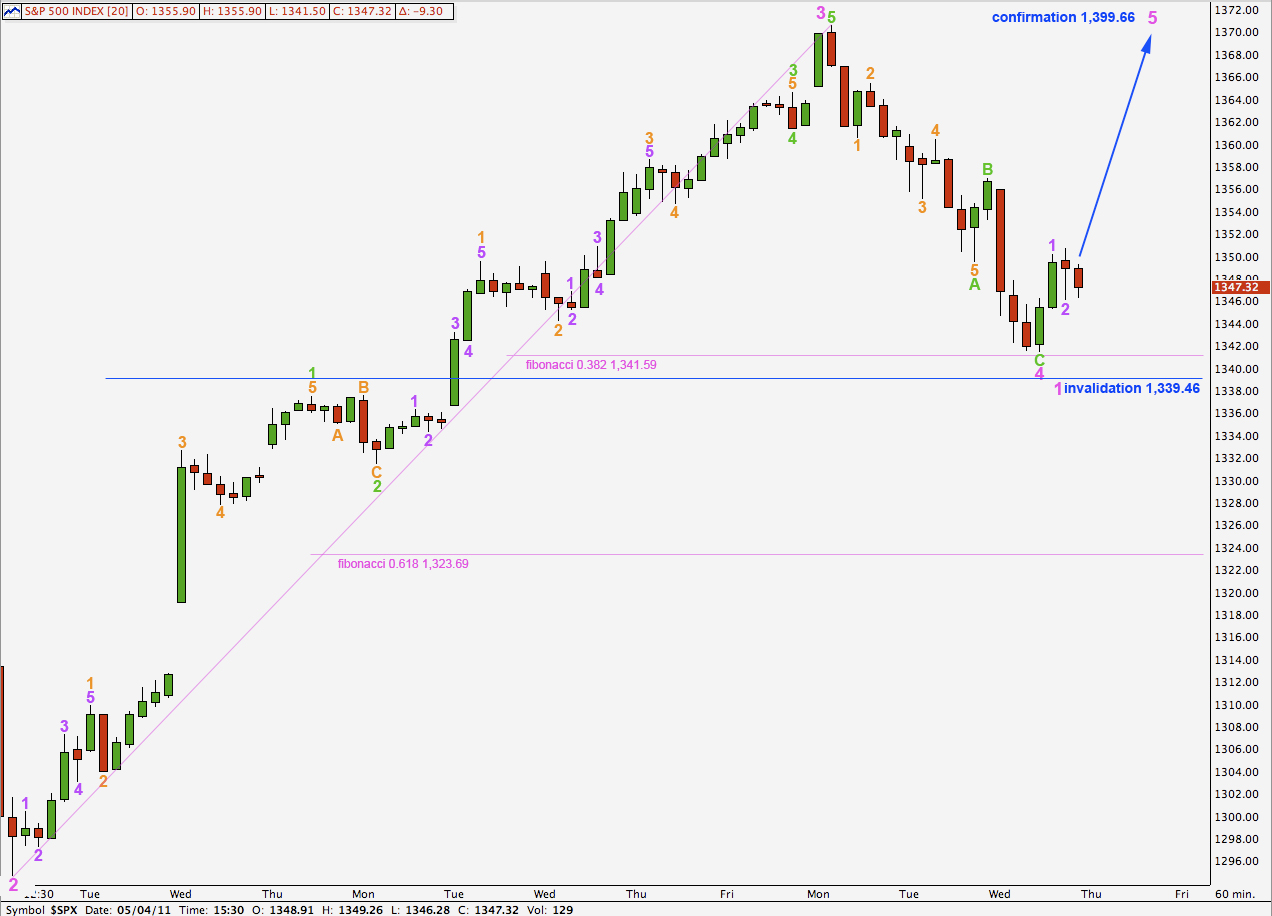
We have a satisfactory zigzag downwards which has barely fallen short of the 0.382 fibonacci ratio. It is technically possible that wave 4 pink was over here.
To compound the problem of a lack of clarity, if wave 5 pink unfolds as an ending diagonal then the next wave upwards would be a zigzag.
We may only confirm this wave count if either upwards movement makes a new high and is a very clear five wave impulse, or if upwards movement reaches above 1,399.66.
At this stage we must keep this alternate possibility in mind.