
Elliott Wave chart analysis for the S&P 500 for 2nd May, 2011. Please click on the charts below to enlarge.
Both wave counts on the hourly chart were invalidated during Monday’s session.
Downwards movement is either a fourth wave correction at green degree, which may be over, or a fourth wave correction at pink degree, which has most likely just begun. We have two hourly wave counts for these two possibilities and we may use confirmation and invalidation points to work with these.
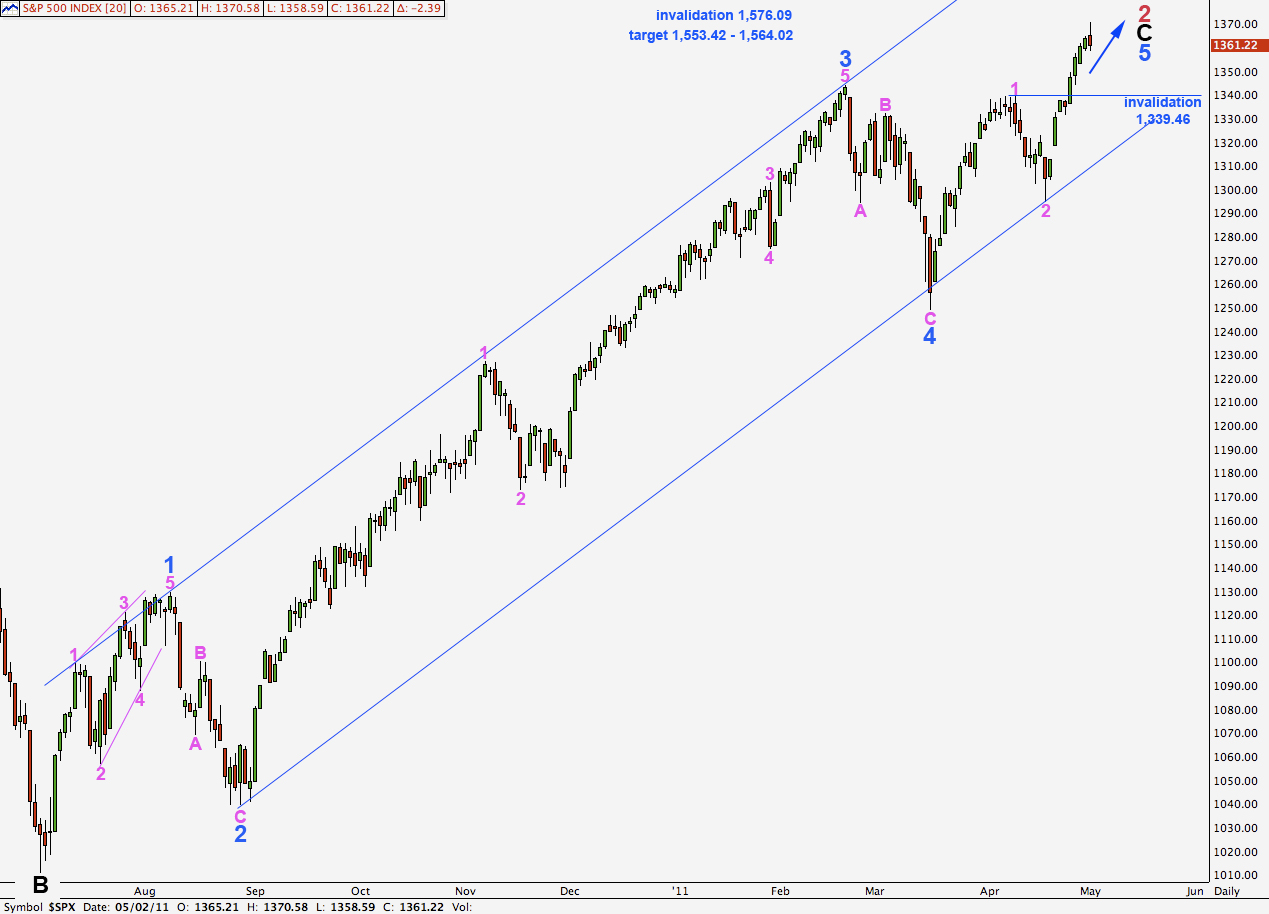
Wave 4 pink may not move into wave 1 pink price territory below 1,339.46.
At 1,553.42 wave 5 blue will be extended and will reach equality with wave 3 blue. Within an impulse, two of the three actionary waves may be extended and here the first wave at blue degree is not, so both 3 and 5 may be.
At 1,564.02 wave C black will reach equality with wave A black. This is a common relationship between waves A and C of a zigzag and so this is a highly likely place for upwards movement to end.
Main Hourly Wave Count.
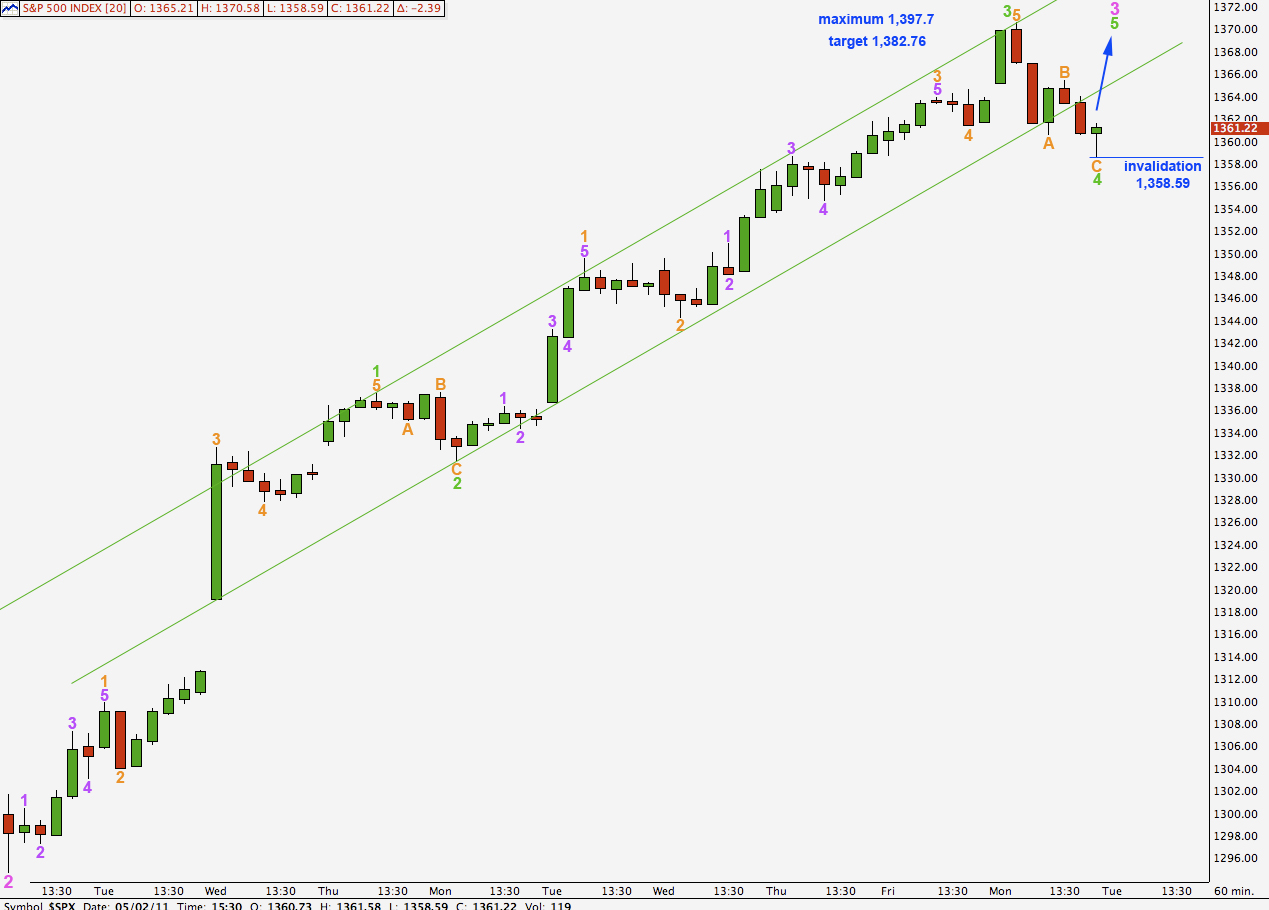
This main wave count is our main count only because we should assume that the trend remains the same, until proved otherwise.
For this wave count wave 3 green is 3.68 points short of equality with wave 1 green. Wave 5 green would reach 0.618 the length of wave 3 green at 1,382.76. Wave 5 green may not be longer than equality with wave 3 green and would achieve its maximum length at 1,397.7.
Ratios within wave 3 green are: wave 3 orange is 1.54 points longer than equality with wave 1 orange and wave 5 orange has no fibonacci ratio to either of 3 or 1.
Ratios within wave 3 orange of wave 3 green are: wave 3 purple is just 0.22 points short of 1.618 the length of wave 1 purple and wave 5 purple is 1.28 points short of equality with wave 3 purple.
Wave 4 green is here labeled as a simple zigzag. If it was over at 1,358.59 then wave C orange is just 0.63 points longer than 0.618 the length of wave A orange.
There is nice alternation between waves 2 and 4 green: wave 2 green is a flat and wave 4 green is a zigzag.
This wave count expects one final upwards wave before we see a correction of any reasonable degree. Because wave 4 green has overshot the trend channel drawn here using Elliott’s technique we may see an overshoot on the opposite side of the channel for the end of wave 5 green.
Movement below 1,358.59 would invalidate this wave count. If this occurs we should use the alternate wave count below.
Alternate Hourly Wave Count.
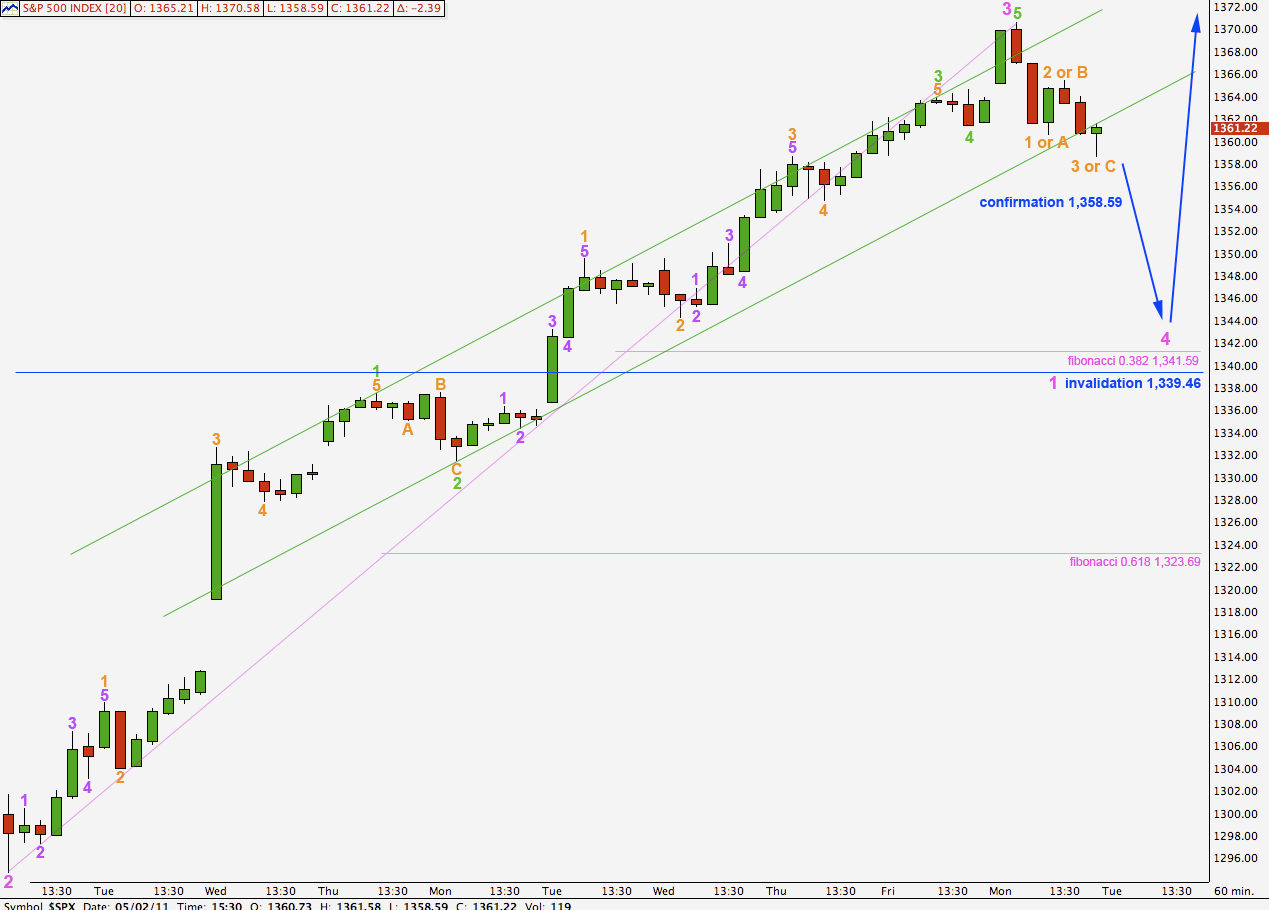
It is possible that Monday’s downwards movement was the start of a fourth wave correction at minute (pink) degree.
Movement below 1,358.59 would invalidate the main hourly wave count and so confirm this alternate.
Downwards movement is either 1-2-3 within green wave A of wave 4 pink, or it may also be A-B-C to end green wave A within pink wave 4.
Pink wave 2 was a simple zigzag. Pink wave 4 is more likely to be a flat, triangle or combination. Wave A green within it is highly likely to subdivide into a three wave structure.
Wave B green may make a new high beyond the start of wave A and so there is no upwards invalidation point. This would be the case for an expanded flat or a running triangle.
Wave 4 pink is most likely to take price to about the 0.382 fibonacci ratio of wave 3 pink at 1,341.59.
Wave 4 pink may not move into wave 1 pink price territory. This wave count is invalidated with movement below 1,339.46.