Elliott Wave chart analysis for the S&P 500 for 28th April, 2011. Please click on the charts below to enlarge.
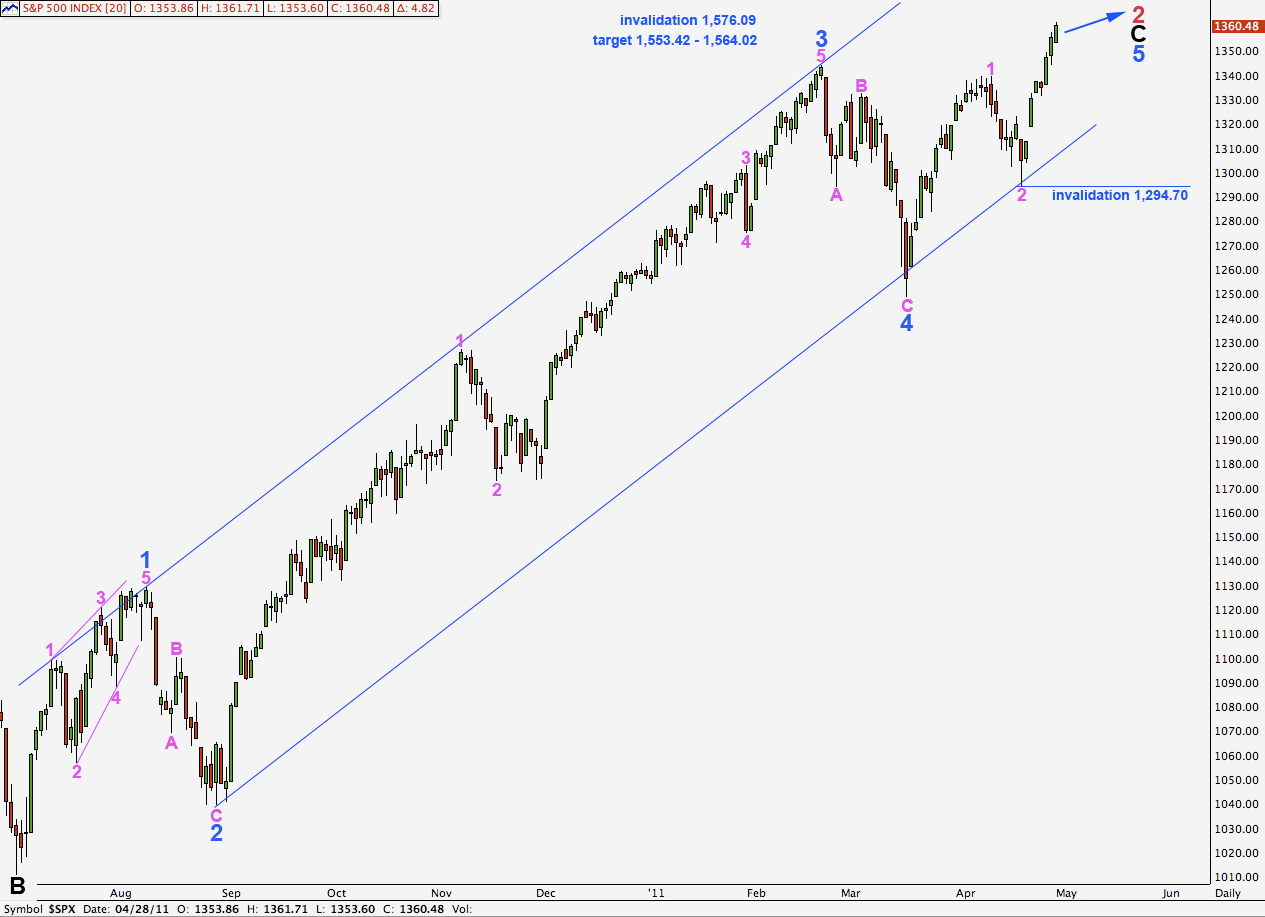
The S&P continues to rise towards our target after, again, failing to make any depth on corrections.
The structure of wave 3 pink on the hourly chart count can barely be considered complete. It is highly likely that it will continue moving higher for a few days yet before we see a correction of any reasonable size.
The upcoming fourth wave correction at pink degree may not move into wave 1 pink price territory below 13,444.
At 1,553.42 wave 5 blue will be extended and will reach equality with wave 3 blue. Within an impulse, two of the three actionary waves may be extended and here the first wave at blue degree is not, so both 3 and 5 may be.
At 1,564.02 wave C black will reach equality with wave A black. This is a common relationship between waves A and C of a zigzag and so this is a highly likely place for upwards movement to end.
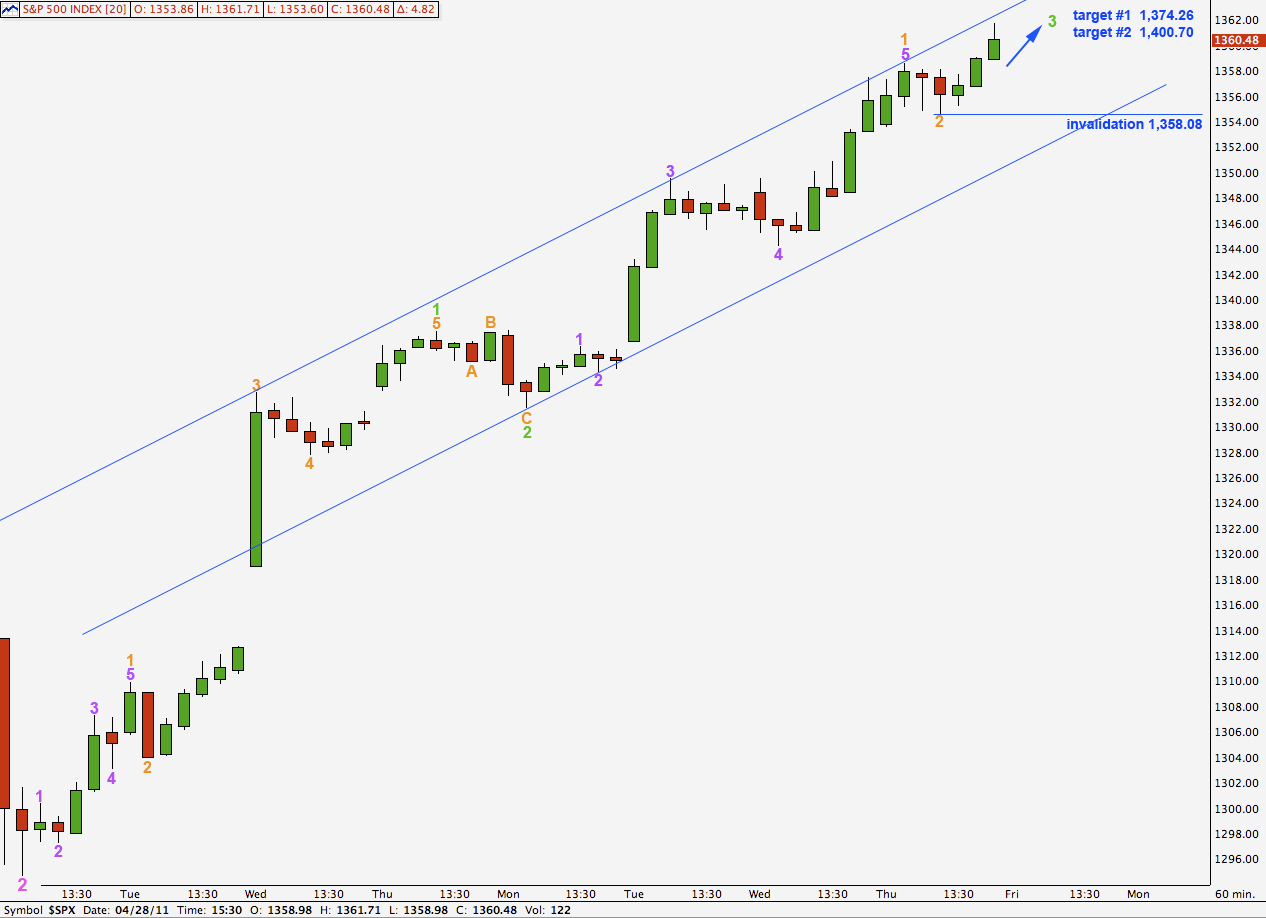
Main Hourly Wave Count.
This wave count remains the most likely of our two hourly wave counts. MACD has not reached a new high reading from the end of wave 1 green and we would expect it to do so once the middle of the third wave is reached.
This hourly wave count expects an increase in upwards momentum as the middle of wave 3 pink is reached.
At 1,374.26 wave 3 green will reach equality with wave 1 green. This target may be too low.
At 1,400.70 wave 3 green will reach 1.618 the length of wave 1 green. This target may be more likely for this wave count.
At this stage now that wave 2 orange is complete we may not expect movement below 1,358.08 as any second wave correction within wave 3 orange may not move beyond the start of the first.
The blue parallel channel drawn here is not Elliott’s technique, it is a best fit. We may expect price to remain within this channel or possible to overshoot the upper edge if the middle of the third wave has enough momentum.
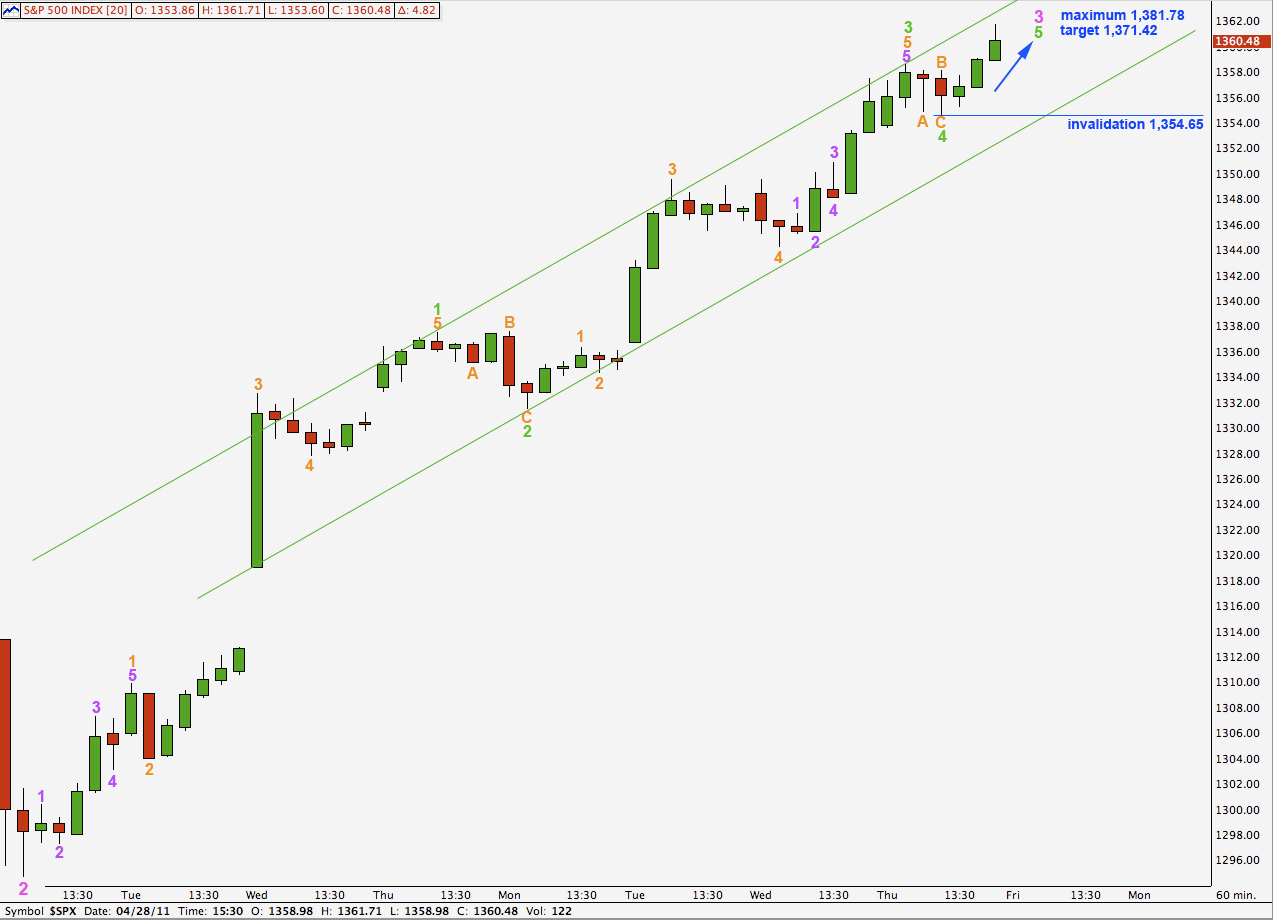
Alternate Hourly Wave Count.
This wave count does not agree with MACD. The third wave at green degree here is over and was just 0.69 points longer than 0.618 the length of wave 1 green.
The final upwards wave for wave 5 green may not be longer than equality with wave 3 green as wave 3 may not be the shortest. This gives us a maximum upwards limit for wave 3 pink with this wave count at 1,381.78.
At 1,371.42 wave 5 green will reach 0.618 the length of wave 3 green.
This wave count is invalidated with movement below 1,354.65.


Lara,
Just wondering at what price minute 3 of Minor 5 will exceed the length of minute 1. It seems that upward momentum is slowing, and if minute 3 ends up shorter than minute 1 (which, I believe, was the case in both Minor 1 and Minor 3 of Wave C), then wouldn’t minute 5 need to be shorter than minute 3? Would this in turn rule out your alternate S&P count in the historical analysis?
Thanks,
Peter
You are correct, if pink (minute) 3 does not exceed the length of pink 1 then my alternate historic analysis will not be able to reach the minimum upwards price point it requires. It would be invalidated.
Pink 3 reaches pink 1 at 1,385.11 (I am calculating pink 1 from 1,249.05 to 1,339.46; 90.41 points in length). So if the larger fourth wave correction begins before this point is reached then we have an earlier end to primary wave 2 approaching.
If however we reach 1,385.11 before a larger fourth wave correction begins then the possibility of new all time highs for the S&P will remain.
Thank you for the quick response. I will keep these target levels in mind as this unfolds.