
Elliott Wave chart analysis for the S&P 500 for 27th April, 2011. Please click on the charts below to enlarge.
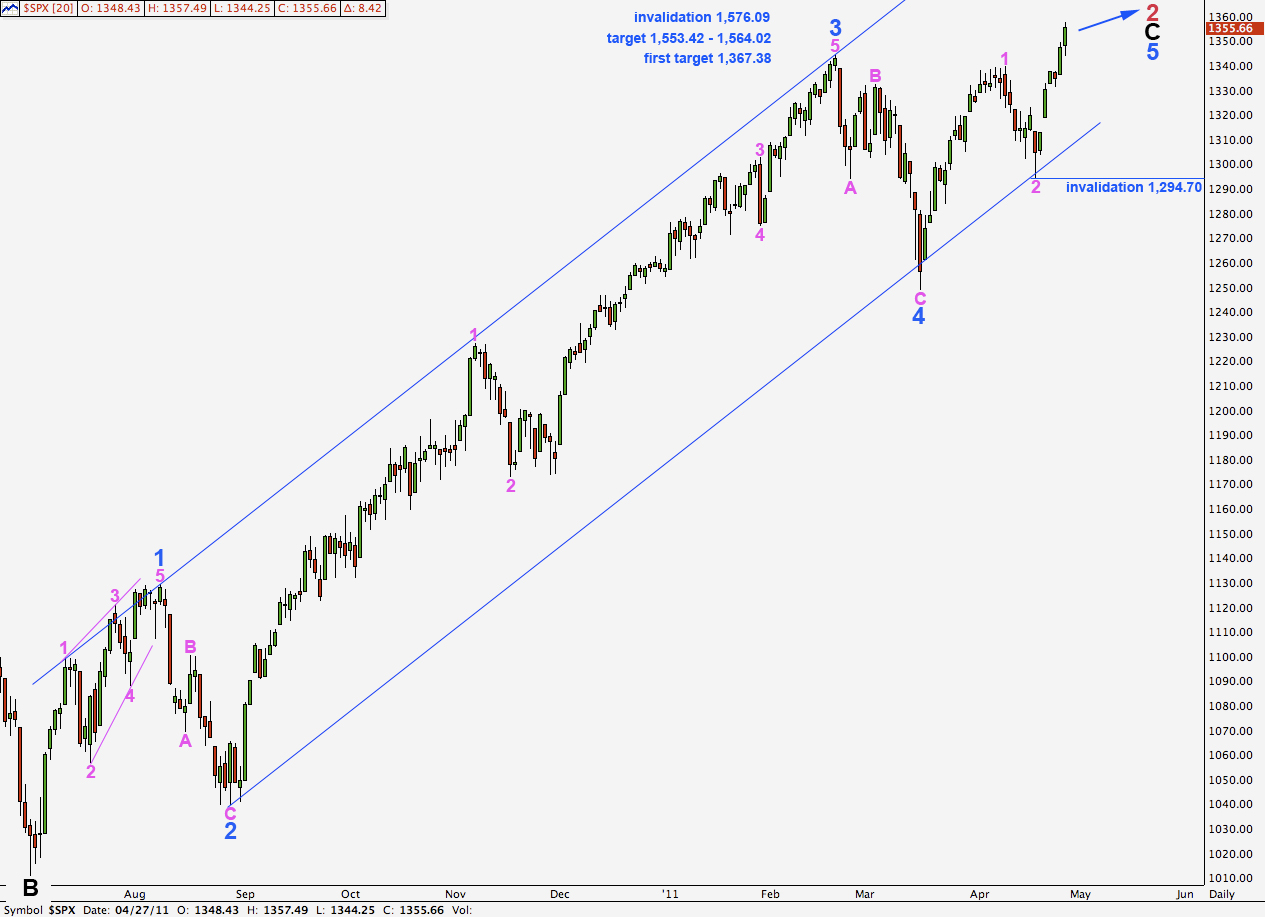
As expected the S&P continues to rise. The first target at 1,367.38 now looks hopelessly low. This structure for wave 5 blue must complete as a clear five wave structure on the daily chart. So far it is only looking like a three.
At 1,553.42 wave 5 blue will be extended and will reach equality with wave 3 blue. Within an impulse, two of the three actionary waves may be extended and here the first wave at blue degree is not, so both 3 and 5 may be.
At 1,564.02 wave C black will reach equality with wave A black. This is a common relationship between waves A and C of a zigzag and so this is a highly likely place for upwards movement to end.
If price rises to 1,485.16 then it is possible for the S&P to make a new all time high. For an explanation of this alternate wave count please see the historical analysis alternate here
Main Hourly Wave Count.
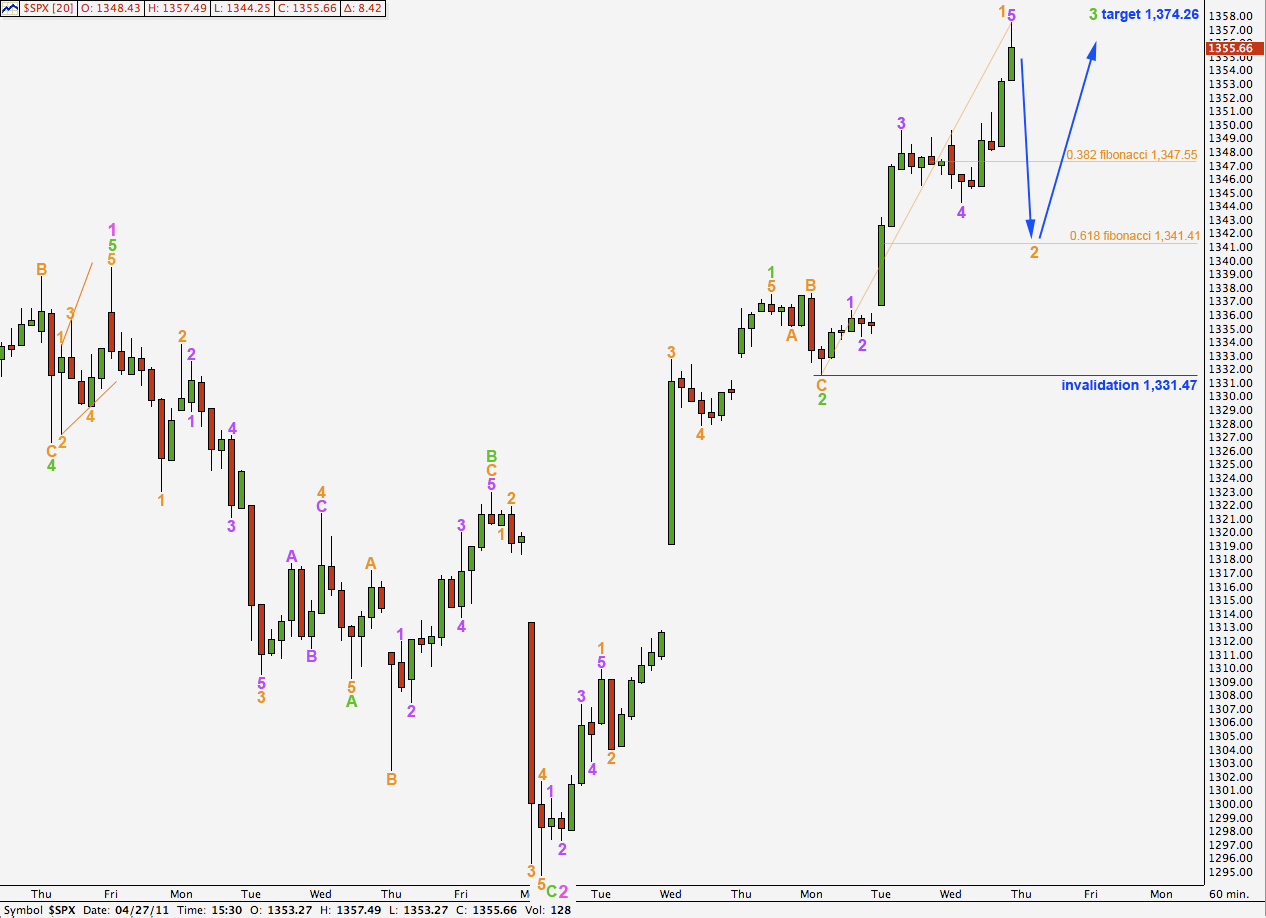
This was yesterday’s alternate and now it looks like the more likely of the two, so today it is our main wave count.
This wave count sees only wave 1 within wave 3 green as complete. Wave 2 orange may not move beyond the start of wave 1 orange. This wave count is invalidated with movement below 1,331.47.
At 1,374.26 wave 3 green will reach equality with wave 1 green. This is the next target for this wave to end, which may take another 2 or 3 sessions.
Wave 2 orange may correct to about the 0.168 fibonacci ratio of wave 1 orange at 1,341.41.
Ratios within wave 1 orange of wave 3 green are: wave 3 purple has no fibonacci ratio to wave 1 purple and wave 5 purple is just 0.58 points longer than 1.618 the length of wave 3 purple.
Alternate Hourly Wave Count.
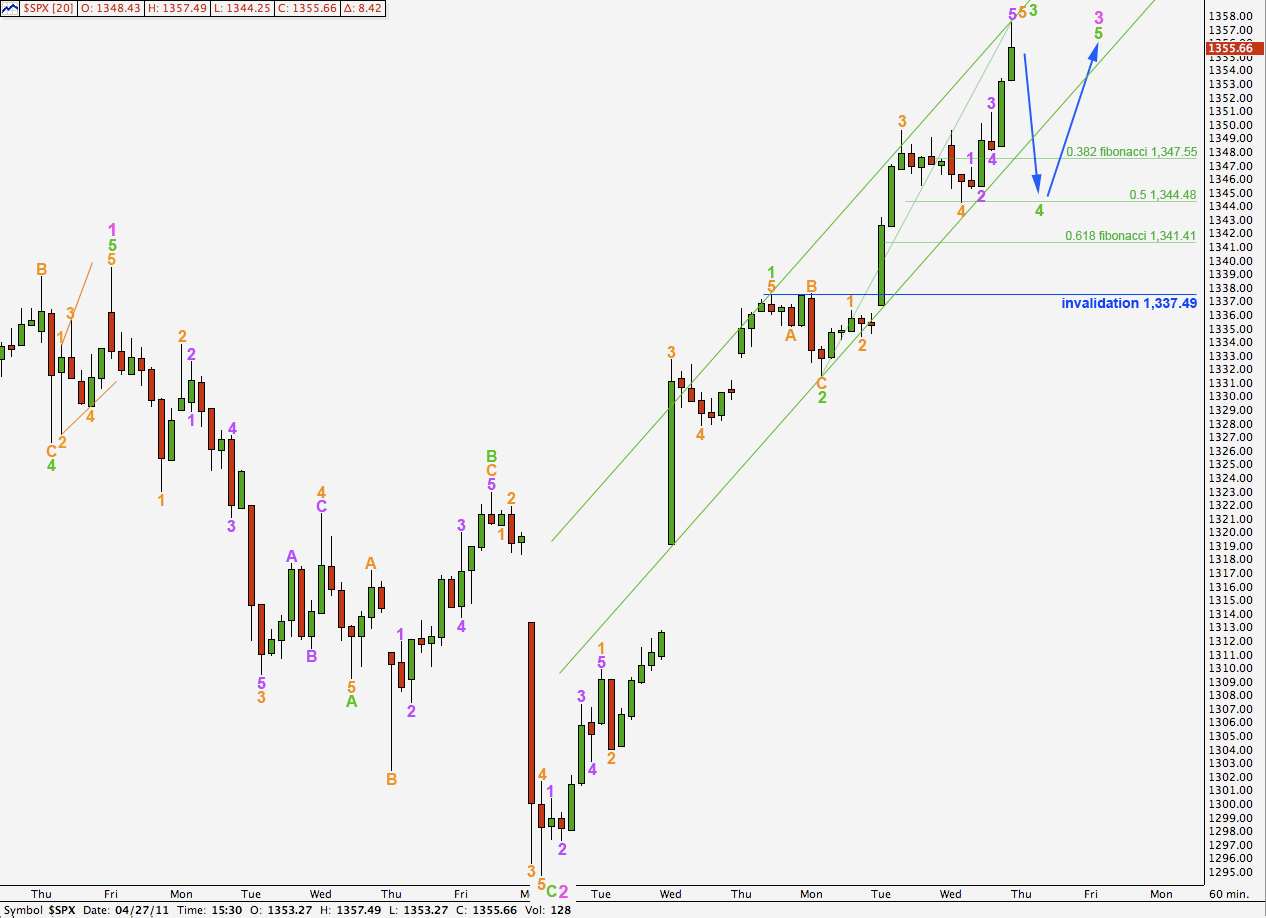
It is possible that wave 3 green of wave 3 pink is over. If this wave count is correct then the next small correction would be a fourth wave.
If wave 4 green corrects to about the fourth wave of one lesser degree it will end about the 0.5 ratio of wave 3 green which is at 1,344.48.
Wave 3 green is here just 0.42 points longer than 0.618 the length of wave 1 green.
Thereafter, further upwards movement for wave 5 green may only be a maximum of 26.02 points in length as wave 5 green may not be longer than equality with wave 3 green.
Wave 4 green may not move into wave 1 green price territory. This wave count is invalidated with movement below 1,337.49.
We may use Elliott’s channeling technique to show where waves 4 and 5 green may end.