
Elliott Wave chart analysis for the S&P 500 for 26th April, 2011. Please click on the charts below to enlarge.
Upwards movement was very impulsive on the hourly chart and so our alternate hourly wave count was confirmed.
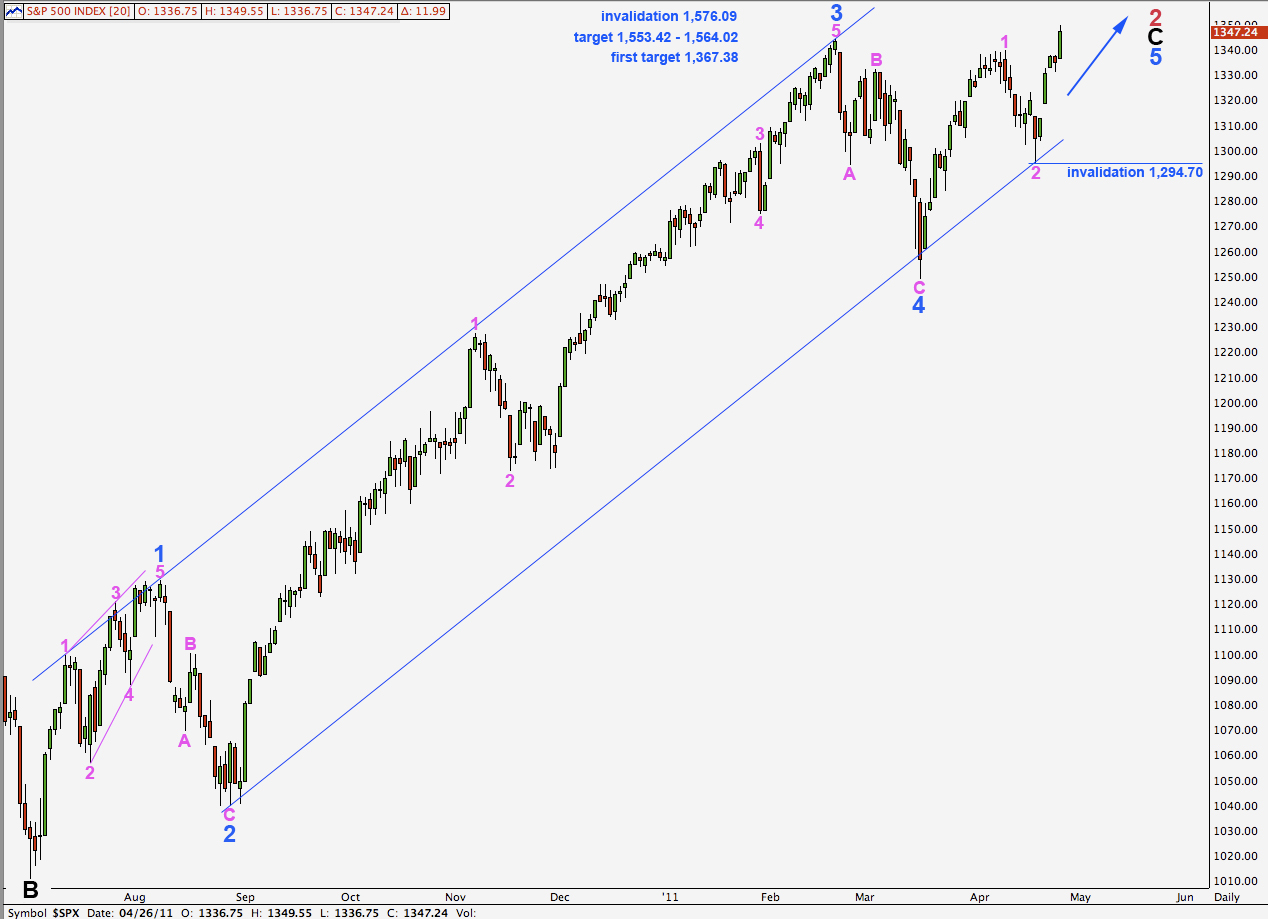
We expect further upwards movement before wave 3 pink within wave 5 blue is complete.
Wave 5 blue is unfolding as a simple five wave impulse.
Targets for wave 5 blue to end wave C black and so to end primary wave 2 zigzag remain the same.
At 1,367.38 wave 5 blue will reach equality with wave 1 blue. This lower target is looking less likely at this stage.
At 1,553.42 wave 5 blue will reach equality with wave 3 blue. At 1,564.02 wave C black will reach equality with wave A black.
Again we have two hourly wave counts for tomorrow. They both expect further upwards movement. Their targets and invalidation points differ.
Main Hourly Wave Count.
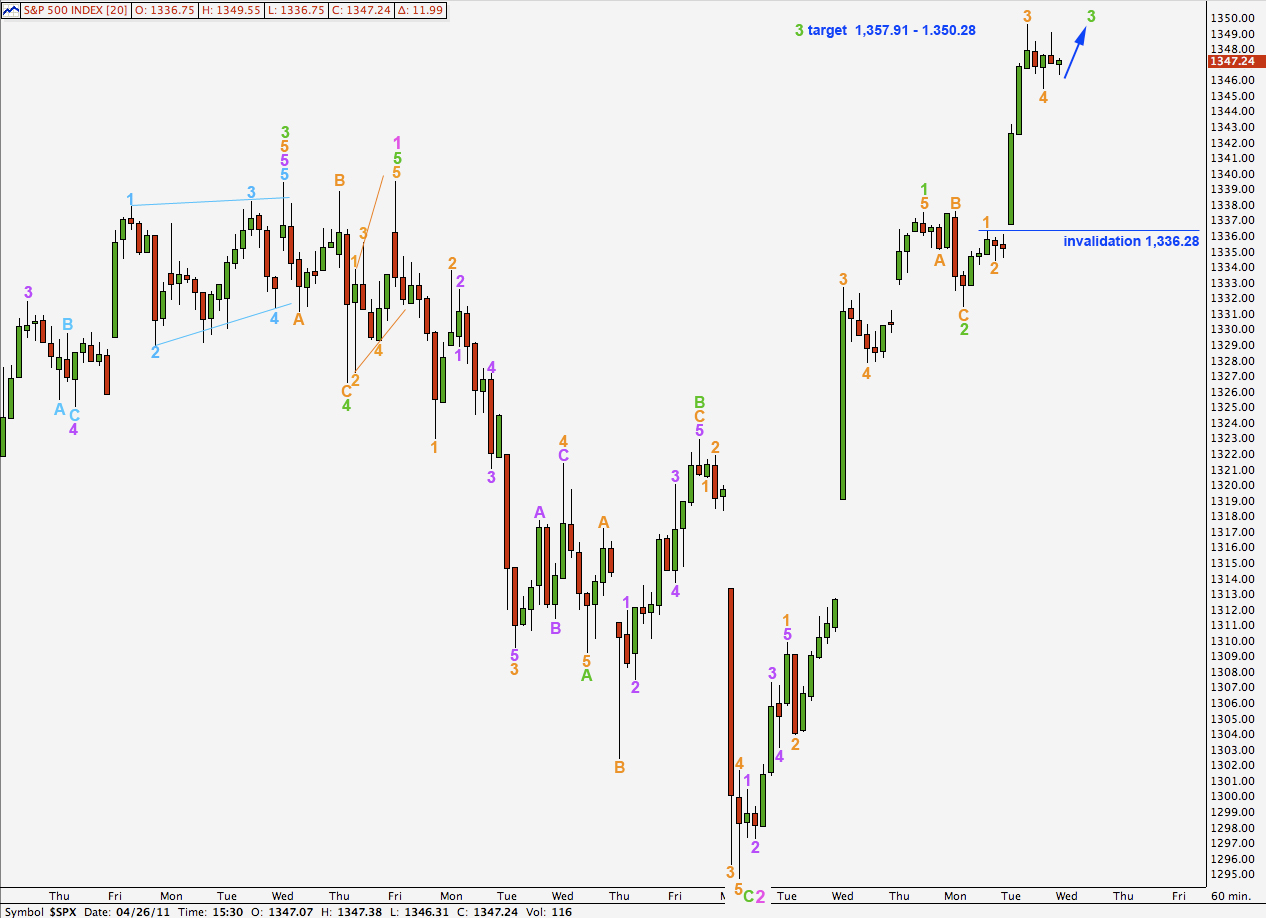
This main hourly wave count sees wave 3 green as almost complete.
At 1,350.28 wave 5 orange will reach equality with wave 1 orange. There is no ratio between waves 3 and 1 orange and so it is more likely that we shall see a ratio between wave 5 orange and either of 3 or 1.
At 1,357.91 wave 3 green will reach 0.618 the length of wave 1 green.
Any further downwards extension of wave 4 orange may not move into wave 1 orange price territory. This wave count is invalidated with movement below 1,336.28.
Alternate Hourly Wave Count.
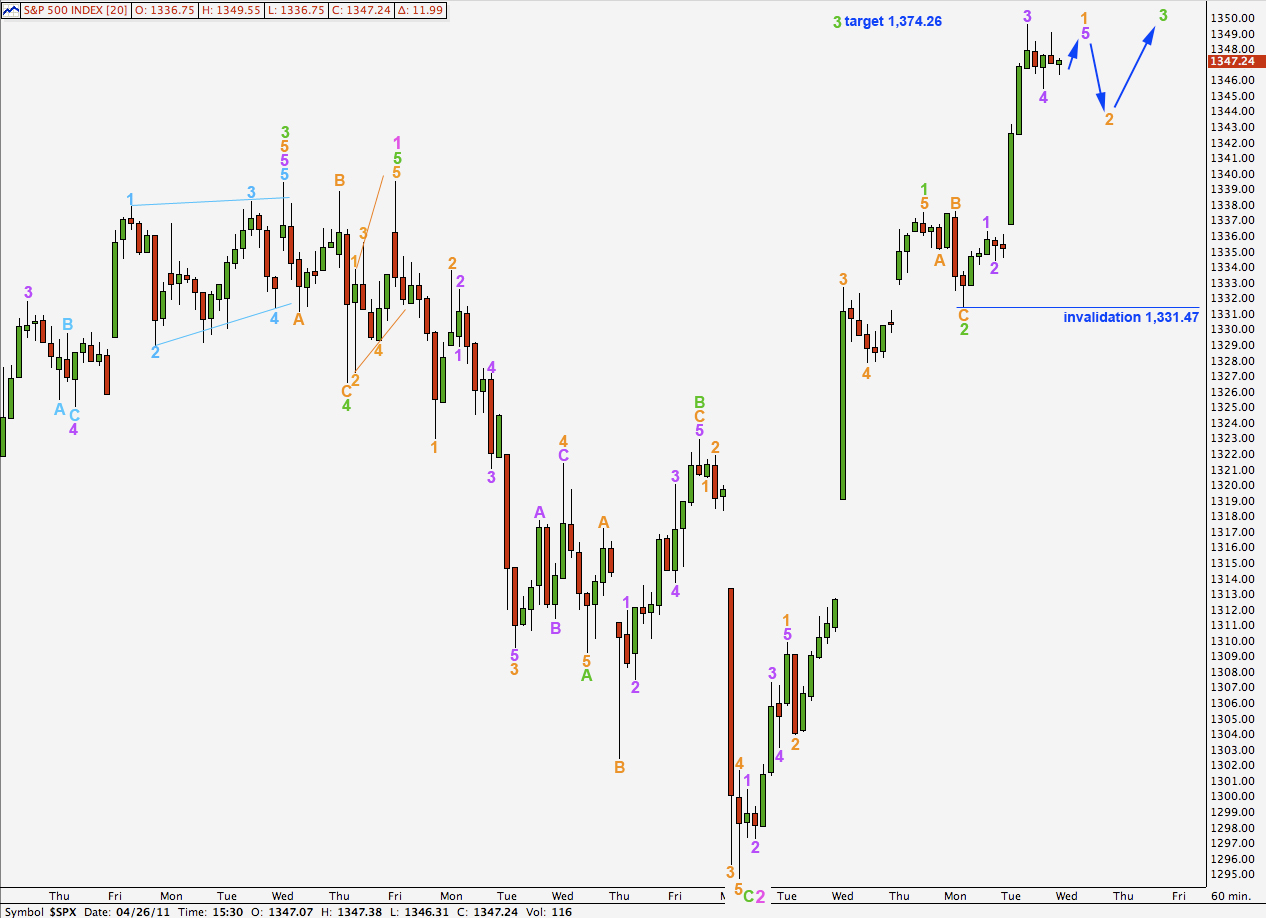
This wave count sees upwards movement as only wave 1 within wave 3 green. This would be the case if wave 3 is extending which is very common.
At 1,374.26 wave 3 green would reach equality with wave 1 green.
A little upwards movement is most likely required for wave 5 purple to end wave 1 orange as this fifth wave is unlikely to be truncated.
Wave 2 orange may not move beyond the start of wave 1 orange. This wave count is invalidated with movement below 1,331.47.