
Elliott Wave chart analysis for the S&P 500 for 25th April, 2011. Please click on the charts below to enlarge.
We were expecting downwards movement when markets opened after Easter and we did get some, but not as much as anticipated.
I have two hourly wave counts. This second wave correction may have been over as a shallow brief flat, or we may have only seen wave A within this second wave correction.
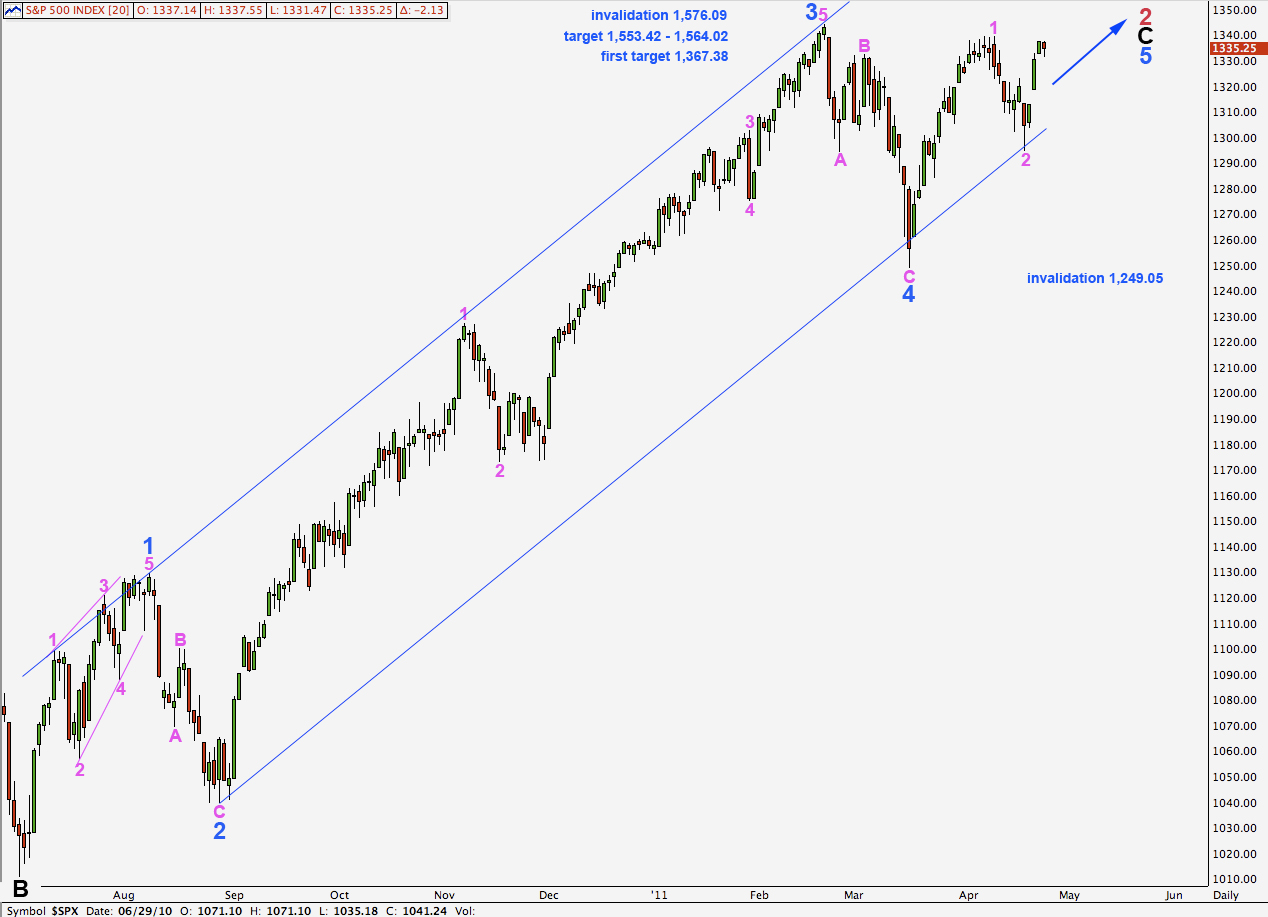
Targets for wave 5 blue to end remain the same. At 1,367.38 wave 5 blue will reach equality with wave 1 blue. At 1,553.42 wave 5 blue will reach equality with wave 3 blue. At 1,564.02 wave C black will reach equality with wave A black.
Main Hourly Wave Count.
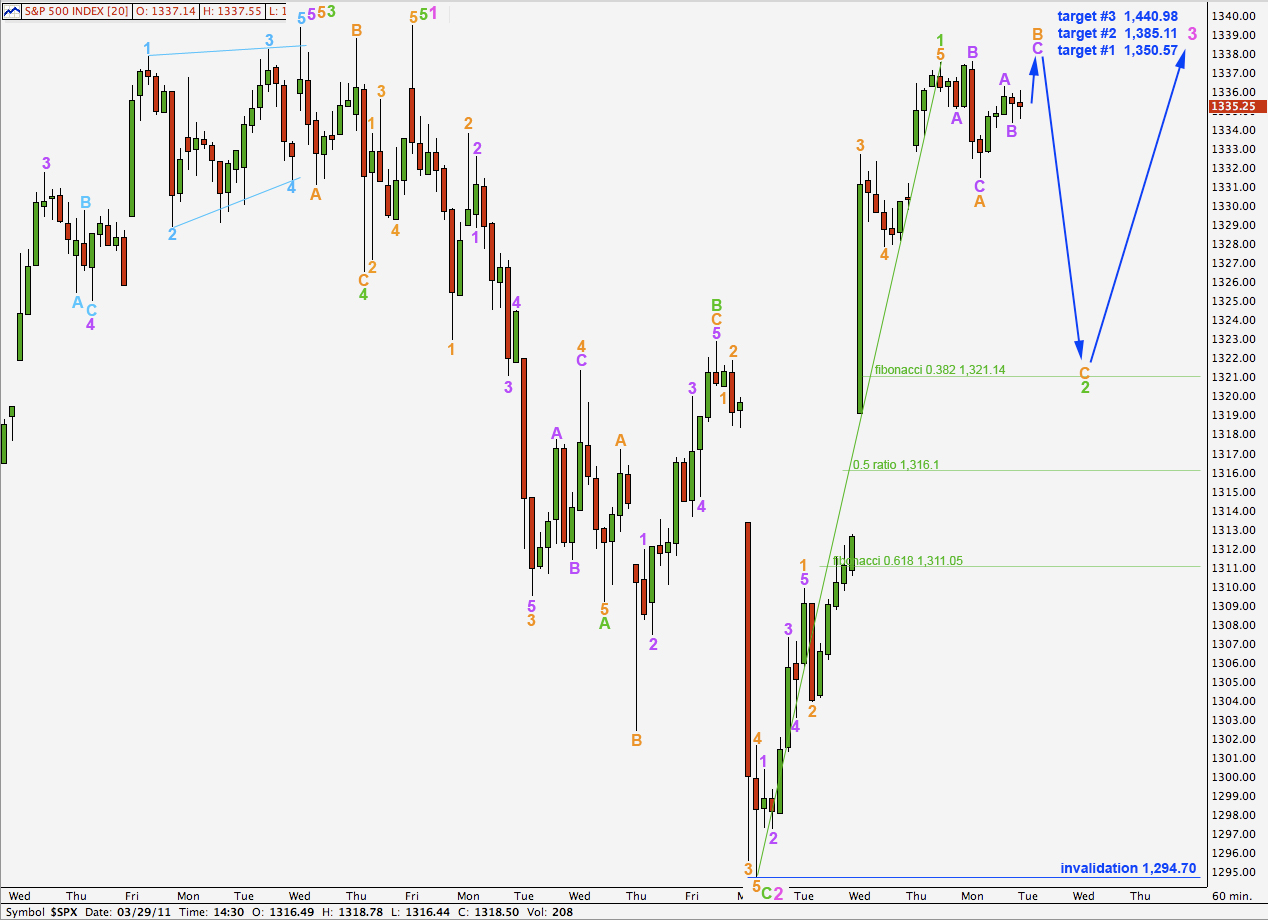
It seems most likely that downwards movement was only wave A within wave 2 green. Wave 2 would be unfolding as a flat correction.
Wave B orange must be at least 90% the length of wave A orange for a flat correction. This was achieved at 1,336.89.
The maximum most common length of wave B in relation to A within a flat is 138% and this would be achieved at 1,339.78.
Wave B orange must subdivide as a three.
Thereafter wave C orange is highly likely to take price below 1,331.47 and may end about the 0.382 fibonacci ratio of wave 1 green.
If upwards movement is not a three and looks impulsive then the alternate wave count below may be used.
Alternate Hourly Wave Count.
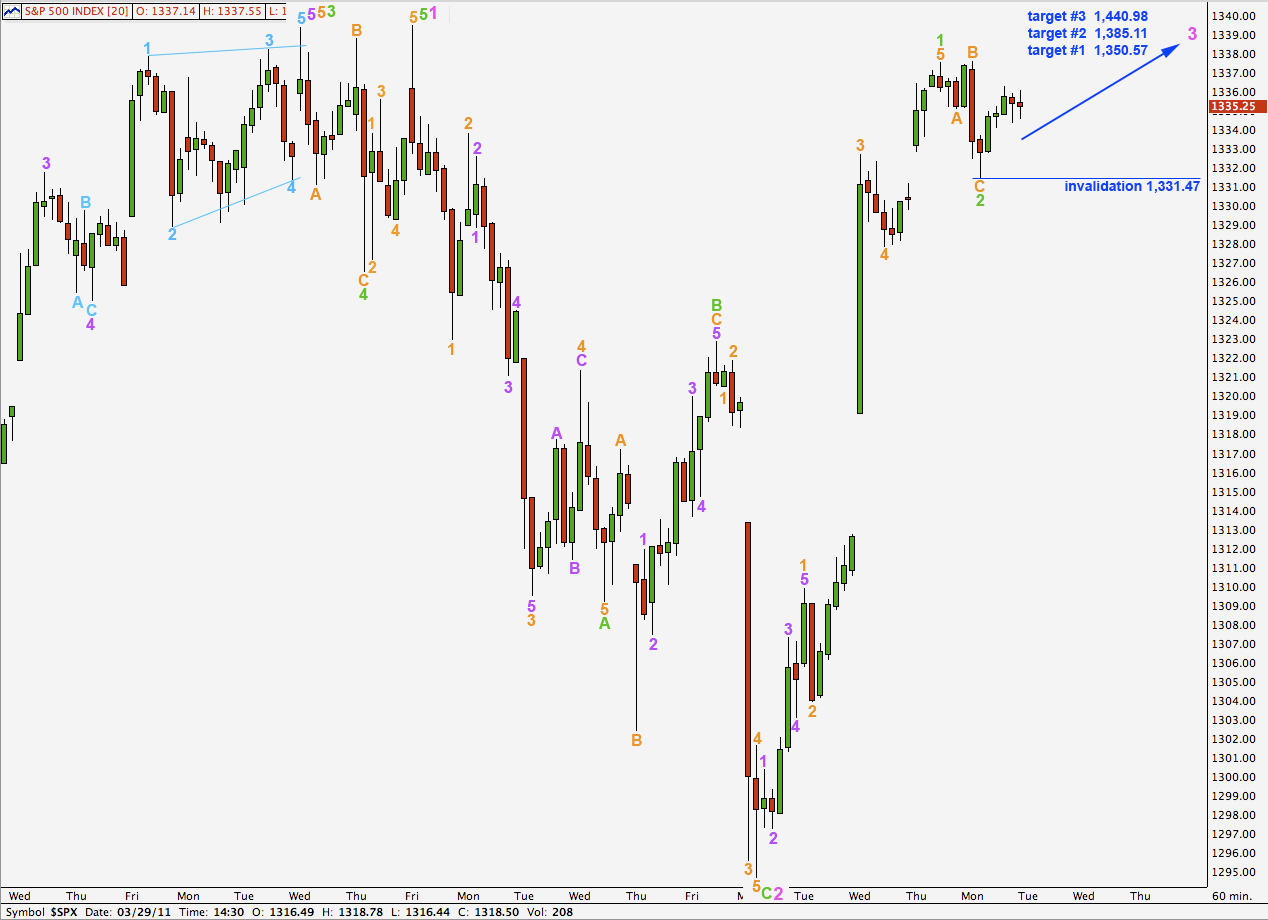
Downwards movement may have been a flat correction which is over for wave 2 green. It is possible that this second wave was brief and shallow as this is the middle of a third wave, but it is unlikely.
Movement below 1,331.47 would invalidate this wave count.
If upwards movement develops strongly and looks impulsive then this wave count may be correct.