
Elliott Wave chart analysis for the S&P 500 for 21st April, 2011. Please click on the charts below to enlarge.
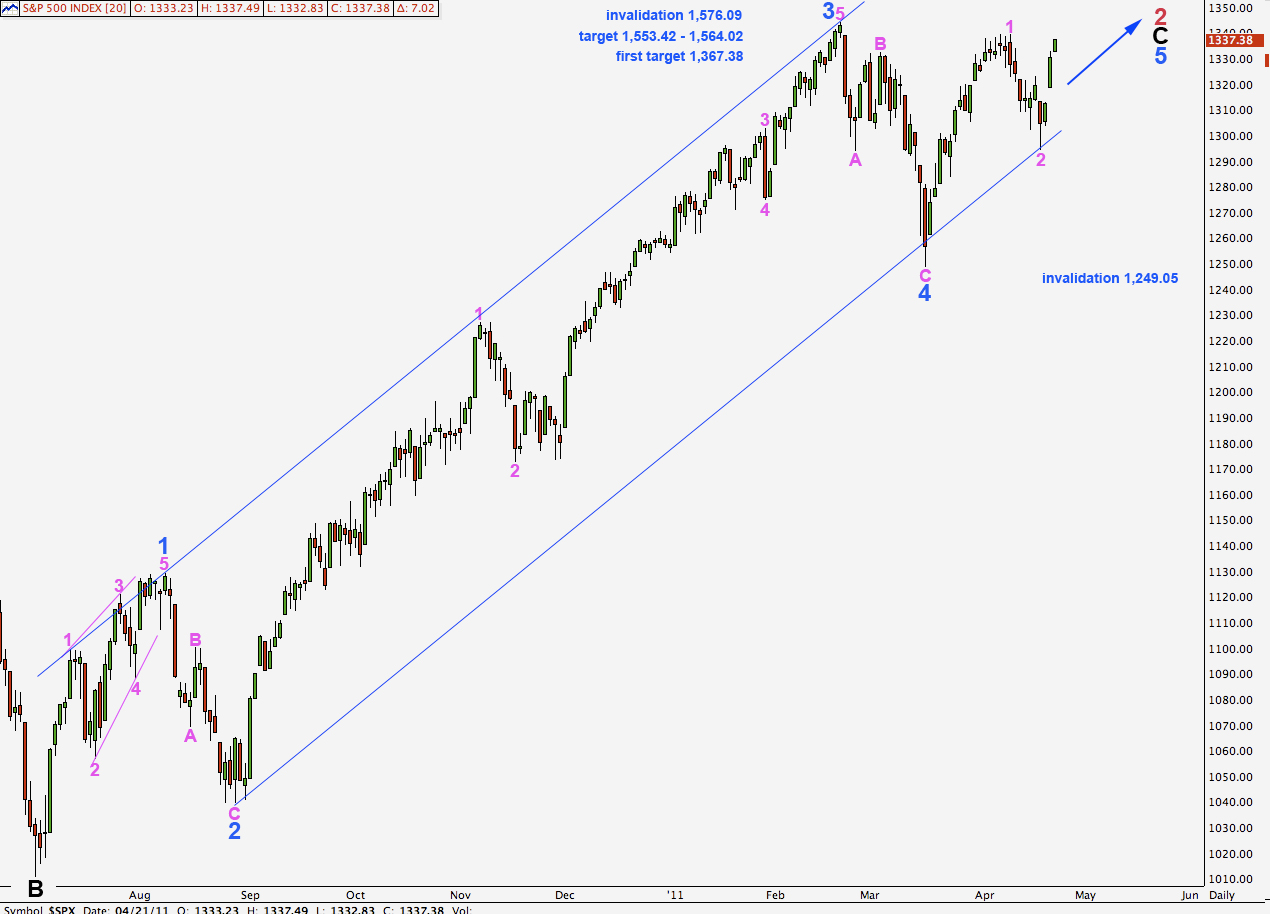
We had expected a fourth wave correction to take a little longer than it did. It was over quickly and we have seen the end to the first five waves up within wave 3 pink.
We can now have more confidence that the degree of labeling on the hourly chart is correct. Wave 3 pink must move beyond the end of wave 1 pink and so only wave 1 within it may be over.
We will be expecting a second wave correction to begin next week after Easter. Thereafter, we will expect the middle of the third wave within this wave 5 blue to begin probably towards the end of next week.
Targets for wave 5 blue to end remain the same. At 1,367.38 wave 5 blue will reach equality with wave 1 blue. At 1,553.42 wave 5 blue will reach equality with wave 3 blue. At 1,564.02 wave C black will reach equality with wave A black.
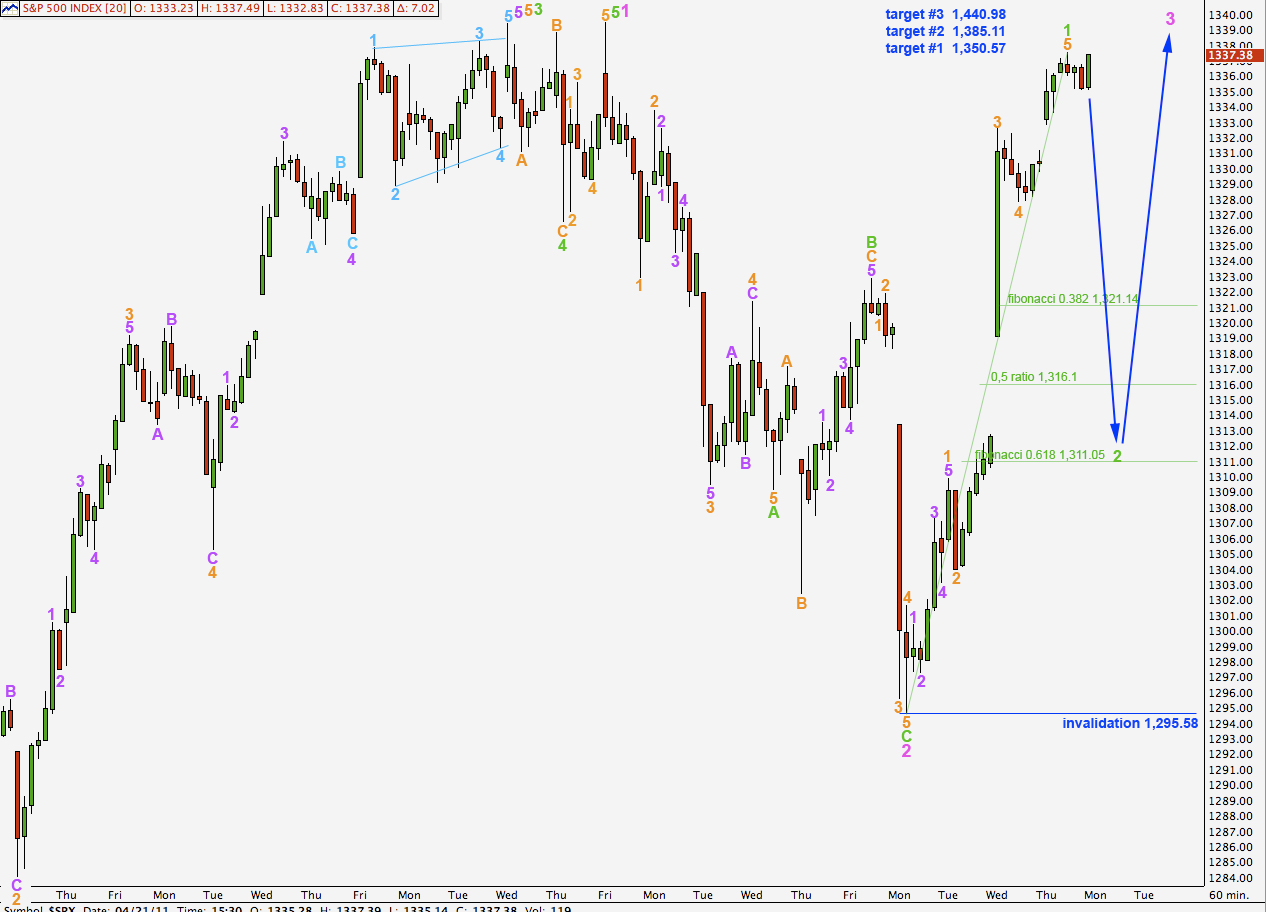
The small zigzag down was not wave A within wave 4 orange; it was wave 4 orange in its entirety. There is no alternation in structure between waves 2 and 4 orange within wave 1 green, illustrating why alternation is a guideline and not a rule.
At this early stage we will expect, that because this upcoming correction is a second wave, that it is more likely to correct to about the 0.618 fibonacci ratio at 1,311.05. However, this is within a third wave and so the correction may be briefer and more shallow than usual.
When wave 2 green is complete we will expect a strong third wave upwards which must take price above the end of wave 1 green at 1,337.49.
Wave 2 green may not move beyond the start of wave 1 green. This wave count is invalidated with movement below 1,295.58.
The first target for wave 3 pink to end now looks too low. The second target at equality with wave 1 pink is more likely. The third target at 1.618 the length of wave 1 pink is also possible.